


 English (pdf)
 Article in xml format
 Article references
 Send this article by e-mail
 Cited by SciELO
  Cited by Google
  Similars in
SciELO
Similars in
SciELO  Similars in Google
 Permalink
1. Introduction
Drought is one of the most complex yet least well understood of all the natural threats [1]. For this reason, it has been the subject of several scientific studies [2], however the planet´s climatic variability makes it difficult to use the same rainfall deficit threshold in different places [3]. As a consequence of this diversity, a multitude of outcomes and tools for the quantification of drought have been implemented [4].
Drought can be defined as a natural phenomenon that occurs when rainfall is considerably lower than normal recorded levels [5], or alternatively, may be interpreted as a water deficiency that varies considerably according to the geographical situation of the territory [6]. According to this, the scientific community has classified drought as: meteorological, agricultural, socioeconomic and hydrological [7].
Drought studies are carried out using indices derived from in situ meteorological stations dedicated to rainfall characterization [8], and that allow the analysis of intensity, duration and spatial coverage [9]. Among these indices is the Standardized Precipitation Index (SPI) [10], which focuses on the analysis of accumulated precipitation from historical records for certain periods of time. It should be noted that the multiscale nature of the SPI is one of the main advantages it provides over other drought indices [11], in addition to the identification of different types of drought, since different natural systems and economic sectors may respond to conditions of drought on very different time scales [12-15]. There is also the Palmer Drought Severity Index (PDSI) that considers humidity conditions, including water balance [16]. These indices are based on statistical calculations [17] which allow the obtainment of reliable information on the state of drought, in terms of intensity and duration [18], however they do not adequately describe spatio-temporal behavior [19].
Studies such as those of the International Water Management Institute (IWMI) in 2015 [20], and the Mining and Energy Planning Unit in 2013 [21], have shown how rainfall reduction affects the photosynthesis of plants due to lack of water availability [2], and thanks to the use of remote sensing techniques, a relationship has been established between the state of vegetation in times of low rainfall [22], the use of spectral vegetation indices (SVI) at different times, and the statistical drought indices (SPI and PDSI). These techniques have been implemented for monitoring studies of meteorological drought [23]. Furthermore, indices based on satellite data have used the state of vegetation to assess the spatial and temporal characteristics of meteorological drought [24]. However, although the ENSO warm phase indices, which are derived from remote sensing data, have been used to monitor weather or agricultural drought, there are no indices that can adequately reflect the complete weather drought information from agricultural aspects, known as comprehensive drought [25].
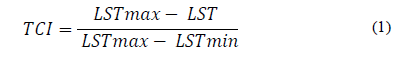
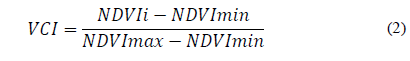
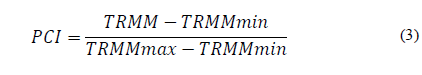
Within the indices that characterize this drought, we have the Synthesized Drought Index (SDI) that simplifies the precipitation deficit, thermal stress of the soil and the state of vegetation growth during a warm event [26], through Principal Component Analysis (PCA) of the Indices of Vegetation Condition (VCI), Temperature Condition (TCI) and Precipitation Condition (PCI) [27], which correspond to the normalization of the Normalized Difference Vegetation Index (NDVI), of the Land-Surface Temperature (LST) and precipitation (TRMM Sensor), respectively. This in order to obtain the product image with the covariance present between these variables [28] and thus achieve the characterization of drought intensity, known as SDI [25]. The remote sensing process requires validation with data from stations in situ, for which, Pearson's coefficient is used to express the relationship between the satellite product and what happened on the ground [20]. Thus, with the intensity of drought and other variables that increase the probability of the desertification of a region, the susceptibility to drought events was obtained, associated with the warm phase of the ENSO for the region under study [17]. It is important to highlight the importance of characterizing these events, since their occurrence has generated serious consequences in the agribusiness sector due to the frequency and intensity with which they occur in the region.
Remote sensors offer the possibility to make advancements towards this goal of characterizing drought events [29], since they allow the monitoring of the behavior of meteorological variables, such as precipitation, temperature, humidity and vegetation, in a more detailed way [30]. This enables drought indices to be generated based upon remote sensing data [8, 31], thereby more closely capturing the spatial behavior of this phenomenon [27], a situation that makes them a promising tool for the study of droughts at regional level [32].
Using remote sensing indices and with the help of in situ meteorological stations, a spatial analysis was developed to determine the areas in Valle del Cauca with the greatest vulnerability to warm phase ENSO events.
2. Methodology
2.1. Scenario definition
Valle del Cauca is in the southwest of Colombia, with a geographical extension of 21,277 km2. Within the department, 5,011 km2 are areas undergoing desertification processes, which corresponds to 23.5% of the total area [33]. Fig. 1 depicts the physiography on four fronts: 1) the Pacific coast with a sequence of swamps and jungle plains is one of the rainiest regions on the planet, with rainfall between 8,000 and 12,000 mm/year, 2) the Western mountain range that reaches its highest peak in the Farallones of Cali with an altitude of 4,200 m.a.s.l., 3) The geographic valley of the Cauca river that has a length of 200 km by about 15 km (mean) of width, and 4) the western ridge of the Central mountain range, that comprises the slope of the valley of the Cauca river and includes the Colombian massif or paramo area, at its limit with the department of Tolima.
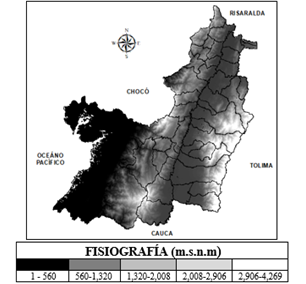
Source: The Authors.
Figure 1 Geographical location of Valle del Cauca. Modified cartography provided by the IREHISA Group, Universidad del Valle.
Several studies carried out in the region have shown a strong association of ENSO with the hydroclimatology of the country [34]. Furthermore, the region is just over the central tropical zone of the Pacific Ocean, determined by the oscillation of the Intertropical Convergence Zone (ITCZ), a situation which makes it highly susceptible to hydro-meteorological phenomena [35,36].
One of the factors that influences the climate of the region are the wind currents of the CHOCO, which transports a large content of moisture from the Pacific Ocean into the interior of the country, equivalent to 3,774 m3/s of water [37-39]. The winds of the Chocó jet stream, as well as the precipitation in the Pacific region, show a monomodal regime, that is, they express the highest figures between September and October and present the lowest values between February and March [40]. In contrast, the behavior of precipitation in the flat area of the department exhibits a bimodal regime, with two rainy events in the quarters March-April-May (MAM) and September-October-November (SON), and two dry events in the quarters December-January-February (DJF) and June-July-August (JJA).
Among the areas most affected by the precipitation deficit related to the warm phase of ENSO are the extensive plains of the inter-Andean valley of the Cauca River [33], generating large losses in the environmental, economic and social sectors of the department.
2.2. Materials & methods
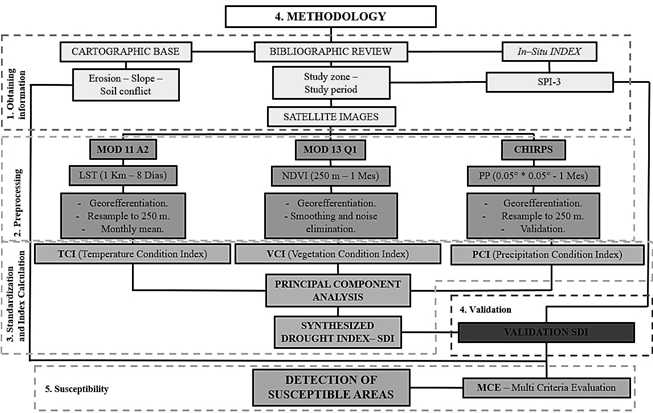
In Fig. 2, the procedures followed in the drought analysis by means of remote sensing techniques are presented and are divided into stages according to the logical sequence of results.
2.3. Standardized Precipitation Index (SPI)
The SPI provides information on the atypical deviation of mean rainfall, according to the historical data of a region, proposed by McKee, Doesken & Kleist (1993). This indicator quantifies the precipitation deficit for different time scales, which is mainly used as an indicator of meteorological drought. In this study, the SPI-3 (quarterly accumulated) was used to select the study periods and for the validation of the SDI.
2.4. Selection of study periods
The study periods were selected considering the date for which satellite records of the earth's surface were first recorded, with respect to the precipitation records of the in situ stations, thus being the period between 2000 and 2010, during which period, the years where EL NIÑO events occurred were identified using the ONI-ENSO Index (According to NOAA). Over these time intervals, the most critical periods are selected, that is, those where the SPI values are less than -1.0. Likewise, a proxy graph was plotted (Fig. 3) that consists of creating a matrix in which it is possible to express the percentage amount of stations that present a certain trend for each month in the different years of study; in this case, the spatial coverage in which the number of stations that record drought are identified.
Fig. 3 (Proxy Chart) indicates that the largest number of stations which register SPI-3 values below -1.0, correspond to the months of August - September for the years 2002, 2004, 2005, 2006 and 2009, and the months of February-March for the year 2010, with a percentage that varies between 84.0% and 41.0% of stations. This indicates that in the majority of the study area the presence of drought events is recorded, therefore these months were selected as the subject of this study.
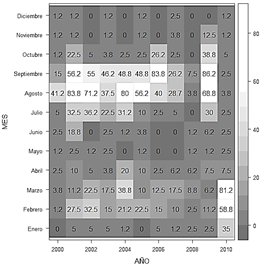
Source: The Authors.
Figure 3 Proxy chart with the percentage of stations with SPI-3 less than -1.0, corresponding to the 2000-2010 drought events. Prepared using the R. Language.
In Table 1, each of the study periods is described, with its corresponding year, the percentage of the stations with an SPI-3 less than -1.0, the duration, classification (Weak or Moderate) and the mean El Niño Oceanic Index (ONI), for each meteorological event under study.
Table 1 Periods under study. According to NOAA classification.
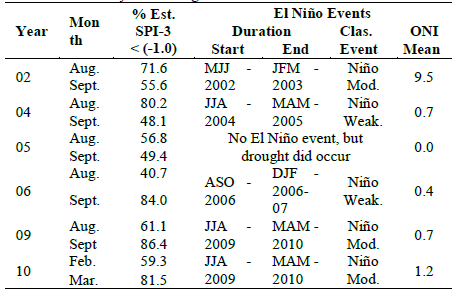
Source: Modified from NOAA // http://ggweather.com/enso/oni.htm
2.5. Normalized Difference Vegetation Index (NDVI)
NDVI is an indicator derived from spectral indices that describes the amount of photosynthetically active radiation absorbed by plants. Measurements made by radiometric instruments are related to biomass and ground-level photosynthesis [41]. The NDVI is obtained from the MOD13Q1 product at a temporal resolution of 16 days and a spatial resolution of 250 m. Although these images are preprocessed, atypical data can be identified, and to reduce these values the Savitzky-Golay filter is applied [42], which allows the smoothing of any noise in NDVI data, caused mainly by cloud contamination and atmospheric variability.
2.6. Land-Surface Temperature (LST)
The LST is downloaded from the MODIS products as well as MOD11A2 and MYD11A2, which have a time resolution of 8 days and a spatial resolution of 1 km. With these images a compound of the monthly mean is generated using the images of day and night, with a total of 16 images per month. The empty spaces or cells within the image, known as No Data (NA) values are estimated with the Kriging interpolator, since it considers the amount of points or values existing in the raster by means of a polynomial function or linear combination.
2.7. Precipitation Images (CHIRPS)
The Climate Hazards Group Infrared Precipitation with Stations (CHIRPS) has been calculating rainfall data worldwide for over 30 years [43]. This data set geographically covers from latitude 50 ° S to 50 ° N and all longitudes and began to take information from 1981 to the present. These satellite images have a spatial resolution of 0.05 ° (Approx. 5 km), including in their results the field station data, in such a way that they allow the creation of a grid with rainfall time series for the analysis of trends and surveillance of seasonal drought [43].
2.8. Normalization of variables
For the calculation of SDI, the variables were scaled and reduced to a standardized series of drought parameters. This is achieved, developing a normalization that transforms the ranges of data values to the same interval, thereby being able to operate each of the images, applying the method proposed by Kogan (1995):
2.9. Synthesized Drought Index (SDI)
The SDI proposed by Du et al. (2013), consists in developing PCA between the VCI, TCI and PCI, to extract the largest amount of correlated information reflected in the first component of the variables under study, with the interest of analyzing the variability that occurs between each of these. This was achieved, thanks to the preprocessing applied to the images as smoothing filters, interpolation methods and resampling (using the R Language libraries), with the objective of standardizing the spatial resolution, that is, to the NDVI images (Spatial Resolution = 250 m), LST (1,000 m) and CHIRPS (5,000 m approx.). A resample was applied to match its pixel size, at a spatial resolution of 250m.
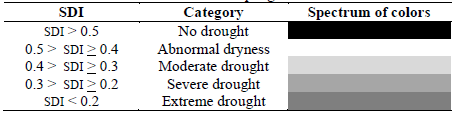
The product of the analysis is an image with the main components uncorrelated and exposed according to the covariance of the original images [20], which express the intensity of the drought over the studied region, according to Table 2.
2.10. Validation
The data obtained from the remote sensors are validated, with respect to the data of the in situ stations. The SPI-3 is taken, by means of a Pearson correlation analysis between values recorded by the 78 meteorological stations and the values obtained by each pixel of the images, where the meteorological event is identified by the SDI in each station.
2.11. Identification of susceptible areas
Next, areas susceptible to being affected by drought are determined, in the municipality of Dagua (pilot area), which is measured as the ability to cope with and recover from the adverse effects of such eventuality. For this, weights were assigned to the following factors: Degree of slope, Degree of erosion, Conflicts over land use and Intensity of drought (SDI). These variables are included, because they are factors that accelerate desertification processes [44].
For the allocation of weights, the Analytical Hierarchical Process (AHP) was used, a method developed by Thomas L. Saaty, in 1980, which consists of a comparison between pairs of variables seen as criteria and / or alternatives [17,45].
When classifying the evaluated criteria according to the assigned weights, the map is made that allows identifying the areas with greater or lesser susceptibility over the municipality of Dagua. This task is carried out using the Qgis 2.18 software, with the map algebra (Raster Calculator), multiplying the corresponding weight by each variable and then performing a summation between them. For this, it is necessary that all the variables be in the same format of cartographic representation (Vector or Raster).
3. Results
3.1. Synthesized Drought Index (SDI)
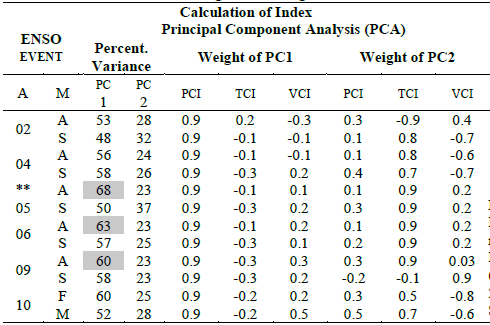
Being a large volume of data and being highly correlated, the PCA was applied to the three selected variables, to decrease the dimensionality of the data with Component 1. Table 3 presents in each ENSO Event: the percentage of covariance between each of the variables and weights corresponding to Component 1 (PC1) and Component 2 (PC2).
Table 3 Statistics of Principal Component Analysis. Year: 2005 **: No El Niño event occurred, but there was drought. According to the NOAA.
Source: The Authors.
It is observed that the largest amount of uncorrelated information is found in PC1, which has been used as the SDI, since it contains more than 57% (mean), in all the images produced for each month under study. PC1 expresses in a new vector space, composed of the three orthogonal axes between the PCI, VCI and TCI, the behavior of the comprehensive drought. On the other hand, PC2 has 25% (mean) of non- correlated information within its vector space, which can indicate atypical weather events and / or the condition of vegetation (agricultural sector, plant cover) in an El Niño event, because it gives priority to vegetation and temperature in its weights, which are variables used to study agricultural drought [46,47].
In the column of weights or eigenvalues, the value by which each of the variables was multiplied to obtain the component is presented, where PC1 gives priority to precipitation (PCI) as the most influential variable in this vector space, emphasizing meteorological drought and also its high correlation with the SPI-3. In addition, it assigns a more moderate weight to the NDVI and LST, to study its influence on agriculture, thus determining the SDI that characterizes comprehensive drought. The values assigned to PC2 give more importance to vegetation and temperature, VCI and TCI respectively, leaving open the possibility of studying this component as an index that characterizes agricultural drought.
3.2. El Niño Event 2006 - 2007
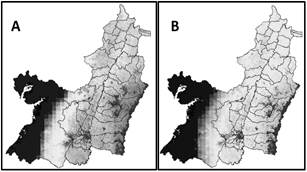
For the analysis of the SDI, the division in the physiography of the study area (Fig. 1) was considered due to its climatological and topographic diversity (Fig. 4A and 4B).
Source: The Authors.
Figure 4 Characterization of Comprehensive Drought through SDI. Phenomenon of El Niño 2006-2007, over the Valle del Cauca region. The map’s legend can be seen in Table 2. Period: A: August 2006. B: September 2006. Made with MODIS images (resolution 250m, year 2006) and CHIRPS images (resolution 250m, year 2006).
The Pacific coast, being one of the regions with the highest rainfall records worldwide, presented optimal conditions for vegetation and high humidity values in large parts of the coastal municipality. In the SDI, these values correspond to the greater than 0.5 range, which is classified as Non-Drought, according to Du et. al. (2013). As the altitude rises on the Western mountain range, a slight change in pixel tones (from blue to aquamarine) is observed, which indicates that these municipalities begin to be influenced by the hydro-climatological event, which correspond to values between 0.40 and 0.50. This indicates a certain degree of influence of the El Niño event, which is not so strong in the south-west of the Valle del Cauca Department.
In this same area, several sectors were strongly influenced by this phenomenon, since values less than 0.2 were recorded in an area of approximately 39 km2, which is indicative of extreme drought events, which poses a risk to the water supply network that originates in this part of the mountain range (Dagua and Anchicayá rivers) where the Alto Anchicayá reservoir is located, which in turn can be affected when its capacity is at minimum levels.
The geographical valley of the Cauca river, and some zones of the piedmont are potential areas for tropical dry forest ecosystems and wetlands, of which there are only 15 relics reported with extensions between 1 and 10 ha, which are isolated between sugarcane fields and large paddocks [48]. In the map corresponding to the characterization of droughts, associated to the El Niño event of 2006 and 2007 (Fig. 4), it is observed that the flat area of Valle del Cauca, shows a severe to moderate drought influence, due to anthropogenic factors such as crop irrigation that induce the satellite sensor to detect moisture levels over the vegetation cover, even though the surface temperature is as high as in other sectors; this causes levels between 0.30 and 0.20 over the region. On the other hand, in the geographical valley, 90% of the municipalities showed extreme drought levels as would be expected, since these are areas that constantly radiate heat due to industrial activities and city traffic, among others.
It can be evidenced that the High Andean Zone (HAZ) of Valle del Cauca, which is located on the western slope of the Central mountain range, is one of the sectors with the greatest drought influence during the ENSO. This area has vegetation typical of paramos and is located within the coverage area of the Las Hermosas National Natural Park (LHNNP), adjacent to the department of Tolima. However, the IGAC and CVC [49], state that the paramos became the most affected ecosystems by drought, due to factors such as: the burning of the ecosystem for livestock or grazing (according to reports from national newspapers, 635 ha of land belonging to 31 municipalities of the Valle del Cauca suffered wild fires during 2006, due to a dry period), rural development through the extension of the agricultural frontier (artisanal agriculture), illegal mining by multinationals and even hunting of endemic species [49]. All these factors have been evident in much of the Valle del Cauca department, but especially in the HAZ.
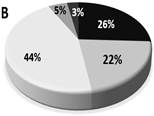
Fig. 5 shows the quantification of the areas affected by the drought in the El Niño event of 2006 - 2007 in the Valle del Cauca department, and also a brief description of each drought event [50].
Source: The Authors.
Figure 5 Areas affected by drought intensity (Legend in Table 2). Valle del Cauca Department. Period: A) August 2006, B) September 2006.
No drought: there is no drought.
Abnormal dryness: It is not a dryness condition, nor a category of drought. It occurs at the beginning and end of a period of drought. At the beginning of a drought, due to the short-term dryness it can delay or even damage a crop. There is risk of fire.
Moderate drought: There is some damage to crops and pastures; there is a high risk of wild fires, low river levels, streams, reservoirs, watering holes and wells, voluntary restriction in the use of water is suggested.
Severe Drought: Probable losses to crops or pastures, high risk of wild fires, and as water becomes scarce, restrictions on water use must be imposed.
Extreme Drought: Major losses to crops and pastures, extreme risk of wild fires, and water use restrictions are generalized due to its scarcity.
The sequence of images shows a variation in the surface of the entire geographic valley of the Cauca river, from August to September 2006, determined by the index in a slight increase in its values; which are indications of greater humidity in the area due to various factors: crop irrigation influences the products obtained from the sensor and increases in precipitation levels. In addition, August is the last month of the dry quarter, and September, the first month of the rainy quarter, according to the hydrological year of the area.
3.3. Validation
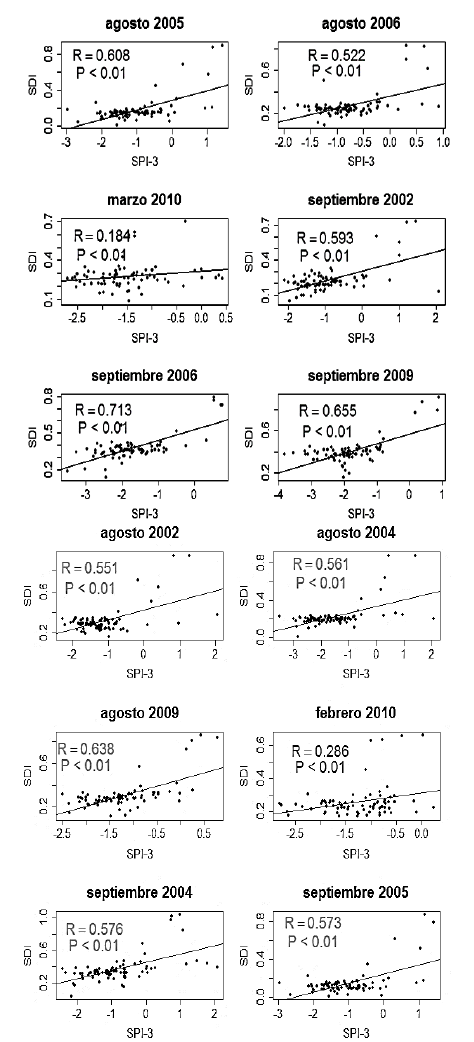
The SPI-3 was used to validate the SDI; for this, the records of 78 stations are used for each study date and the corresponding data of each pixel of the images where the station is located; this is obtained from a data dispersion analysis by means of linear correlation. In Fig. 6, the highest correlations are observed in the months of August and September for the different years of study, while the lowest values are obtained for the months of February and March 2010 (0.29 and 0.18 respectively), This difference in correlation between these two periods of the year is due to the fact that the behavior of precipitation on the Pacific coast during the first semester tends to decrease. This is detected by the SPI as drought, since it presents an atypical deviation from the mean, according to the historical records of precipitation for those stations, not counting that rainfall for the Pacific region registers a historical average of 8,000 mm / year while for the Andean region 1,500 mm / year. Hence, in these cases SPI-3 can misinterpret a drought event, where there are areas with great difference in precipitation levels, whilst the decrease in precipitation does not present a risk of being affected by droughts. Thus, SPI-3 registers dry events in the months of February and March over the Pacific region, while the SDI expresses high values that indicate wet zones with high precipitation over this region. Due to this, the results showed that the SDI has an insignificant correlation (P value <0.01), leading to high values of certain correlation coefficients while others are below 0.60 (R).
3.4. Susceptibility to comprehensive drought
When developing the multicriteria evaluation in the detection of areas susceptible to drought, it was found that the areas that have the greatest risk of being affected by drought are located on the Dagua river canyon, of which a certain area is covered by the type of Orobioma Herbazal ecosystem of the Dagua river which comprises dry, xerophytic and sub-xerophytic forests.
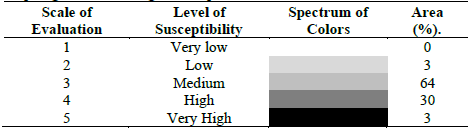
The values obtained in the susceptibility map (Fig. 7 and Table 4) are generated by the dryness of the area, where several factors influence in a certain way:
The degree of erosion that occurs in the area adjacent to the Dagua river reaches very high levels with deep canyons and crevasses of reddish and compact soils.
The improper use of land and devastation of the area due to logging, indiscriminate burning, extraction of natural resources and expansion of the agricultural frontier.
The irrigation system of the Paprika, Tomato and Pineapple crops diverts the creeks that cross the sub-xerophytic enclave of the affected area.
The central-southern area of the municipality presents a high susceptibility. It has a high soil conflict; erosion is severe and natural due to bovine livestock activity (extensive and semi-extensive cattle industry), deforestation of forested areas, the low use of soil conservation techniques and organic fertilizers, which facilitate erosion [51].
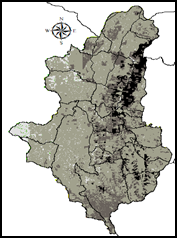
Source: The Authors.
Figure 7 Map of susceptibility to comprehensive drought in the municipality of Dagua, Valle del Cauca. Cartographic base provided by Grupo IREHISA, Universidad del Valle.
4. Discussion
This investigation further evidenced the relationship between the hydrometeorological behavior of the geographic valley of the Cauca river and the dry events associated with the warm phase of the ENSO phenomenon, which is consistent with various studies [37,40,54,55], that demonstrate the correlation found between Colombian hydroclimatology and ENSO indices, according to Poveda and other authors. Furthermore, Canchala et al. [3] in southwestern Colombia, showed significant high correlations on interannual and interdecadal time scales between macroclimatic indexes generated by ocean-atmospheric phenomena and streamflow at basins located on the Chocó biogeographic (Atrato river and Patía river). Likewise, Sedano et al. [52,53], in 2020, analyzed the floods and decreases in the Cauca river with respect to the macroclimatic indices of the ENSO and an anthropic index, finding a better adjustment of the variability of the series of flows. All these studies have enriched the state of the art of Colombian hydroclimatology, contributing to studies that can improve the prediction of extreme ENSO hydrological events in our region [39].
In this project, part of the methodology described by Du et. al., (2013 and 2014) [25,26] and that of the IWMI (2015) [20], was employed. Also, were obtained Pearson’s coefficients (Fig. 6) during the validation process are within the range obtained by these authors in the south-east of China and India, which means that this index can be applied to regions that are geographically located on the tropical belt, such as Colombia. This makes these tropical areas prone to being affected by El Niño events, associated with the Pacific Ocean current.
5. Conclusions
Due to its adequate spatialization and accurate values that measure its intensity, the SDI allows the identification of areas susceptible to drought, as well as maintaining the incidence that extreme values have on sectors that have considerable variability.
The integration of drought indices based on satellite data (SDI) and on-site station data (SPI) allows progress in the study of this phenomenon, because each tool provides complementary information that improves estimates in terms of intensity, magnitude and spatiality.
The correlations with SPI-3, show that the index is suitable for monitoring comprehensive drought, since it provides information on meteorological drought. Furthermore, given the presence of the plant component in the analysis, it can be related to the signs of agricultural drought. In addition, in the periods with the highest intensity of drought, the highest correlations in the validation were recorded, meaning that the SDI best characterizes drought when its variables are more intense.
This study clarifies many scenarios that are generated with the occurrence of a dry event during the ENSO Phenomenon, such as the areas susceptible to being affected by droughts in the Valle del Cauca department, forcing local entities to carry out better planning and implementation of strategies in the integral manage of the resources hydrics, which help to mitigate the risk of the most vulnerable communities in the face of local, national and global scenarios of Climate Change.

