


 Inglês (pdf)
 Artigo em XML
 Referências do artigo
 Enviar este artigo por email
 Citado por SciELO
  Citado por Google
  Similares em
SciELO
Similares em
SciELO  Similares em Google
 Permalink
1. Introduction
In general, the reliability of a component is given by its capability to withstand the applied stress. Therefore, due to both the stress and the strength variables are random, then in the reliability field, the analysis is performed by using a probability density functions (pdf) to model the stress variable and a pdf to model the strength variable [1]. Moreover, because in general two types of failure modes exist, to know the fatigue and shock failures modes. And since fatigue occurs due to the repeated application of the load (cyclical load behavior), and the shock occurs when the applied stress (s) is higher than the product’s strength (S) (s>S). Then in both cases, the reliability of the analyzed component can be accessed by applying the stress-strength reliability analysis [2]. Unfortunately, if the stress and the strength variables follow both a Weibull distribution W~(β,η) with different shape parameter β , then a close solution of the Weibull/Weibull stress-strength function does not exist [3]. Therefore, in response to this problems researchers have being proposing some solutions as [4-12]. Unfortunately, their approaches are not efficient to determine the reliability of the analyzed product. This because of the solution for different shape parameter (β S ≠β s ) has been possible only in the case of ( 2β S =β s ), ( β S =2βs ). But a general solution has not been found yet. Even [7] mention that it is important to continue studying the Weibull/Weibull stress-strength behavior to generate a general solution for different shape parameter combinations.
Therefore, in this paper, based on the desired reliability index and the value of the estimated shape parameters η a common shape parameter β c is derived. And then it is used to determine the reliability of the designed component. Moreover, based on the stress-strength analysis and the estimated Weibull parameters the safety factor which corresponds to the found reliability is also determined. And because its formulation is based only on the desired (or observed) R(t) index, given by the stress/strength Weibull analysis (see section 4.3), then the derived SF index could be considered as a probabilistic index also. In particular, it is highlighted that because the formulated SFi index is based on the Weibull stress-strength analysis performed by using the addressed common shape parameter, the SF index also represents the corresponding stress-strength reliability R(t) index.
The structure of the paper is as follows: in section 2, the generalities of the Weibull distribution are given. Section 3 presents the stress strength of Weibull formulation. In section 4 the estimation of β S =β s , and β S ≠β s are both given. In section 5 an application of the methodology is sowed. Finally, section 6 presents the conclusion and references.
2. Generalities of the Weibull distribution
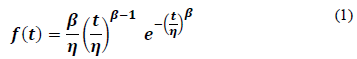
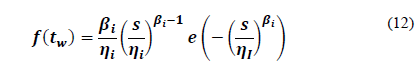
Due to its flexibility to model the design, production, and wear out or aging phases of a product, the Weibull distribution is widely used in reliability and lifetime analysis [2]. And since all products are subjected to a random (variant) environmental stress, and they have a strength to withstand the applied stress, which means that both the stress and the strength are modeling by a probability density function, then their reliability analysis is performed by using the stress-strength analysis given in the next section [13]. The compound Reliability Weibull/Weibull stress/strength probability density function is based on the Weibull distribution [14] given by:
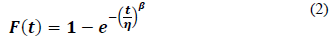
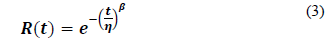
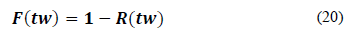
with cumulative failure function and reliability function given by:
where the estimation of the β and η parameters is performed by using the linear form of eq. (2) as
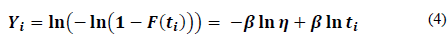
which represents the linear model given by:
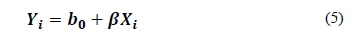
with Y i =ln(-ln(1-F(t i )),b 0 =-β ln(η), and x i =ln(t i ). In practice F(t i )in Eq. (4) is estimated by the median rank approach to estimate the corresponding reliability of a data set and is given by [16]:
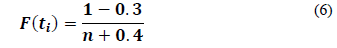
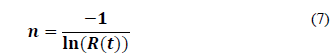
In eq. (7), form [2], the sample size n is determined to ensure the desired reliability index as:
Now based on the formulation from the above, let determine the corresponding Weibull/Weibull reliability strength function.
3. Stress-strength Weibull reliability formulation
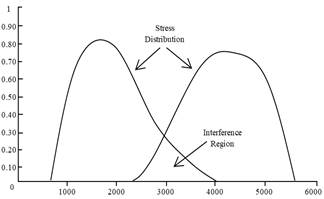
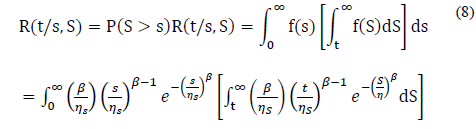
The stress/strength function is the one we must use to determine the reliability of a product which is subjected to variant stress [8]. And since the Weibull/Weibull stress-strength function does not have the closure property [16,17], implying that it has not a close solution for β s ≠β S , then the purpose of this section is to present the formulation of the stress-strength Weibull/Weibull reliability function when (β s =β S ), as well as when (β s ≠β S ). In general, the stress/strength reliability function, as shown in Fig. 1, is given by the probability that the strength (S=Y) will be higher than the applied stress (s=X) R(t)=(P(Y>X)) [13]. Therefore, the inference region represents the corresponding cumulative failure function [18].
Thus, based on the Weibull distribution defined in Eq. (1), the Weibull/Weibull stress/strength formulation for β s =β S is as follows.
3.1. Stress-strength Weibull function for ( 𝛃 𝟏 = 𝛃 𝟐 )
When the shape Weibull parameters are equal to β s =β S [19], the Weibull/Weibull stress/strength function is given as:
Unfortunately, because the stress behavior is determined by the environment on which the product is performing, and the product’s strength depends on the manufacturing process and material properties, then the stress and the product’s strength variables are independent each other, and as a consequence the probability that β s =β S is very low. Thus, now let present the stress-strength formulation when βS≠βs.
The formulation is as follows.
3.2. Stress-Strength Weibull Formulation for (β1 ≠β2)
Let first mentioning that for βS≠βs the Weibull distribution has not the closure property [19] given by:
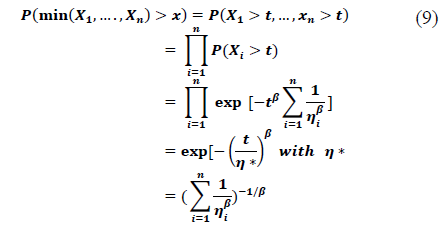
It is to say, the closure property defined in Eq. (9) for the stress variable X1=X and the strength variable X2=Y holds only for β s =β S Therefore, the fact that the stress/strength Weibull/Weibull reliability function, for β S ≠β s has not a close solution is given as
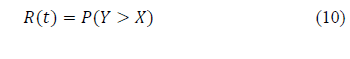
Thus, in order to determine the reliability of a product when β S ≠β s , first a common β c value must be determined and second, it has to be used in eq. (8) to determine the corresponding reliability. The common β c value is determined as follows.
4. Common Beta parameter estimation (βS≠βS)=βc
The common β c value which can be used to determine the reliability given by eq. (8), based on the desired known reliability R(tw), is given by:
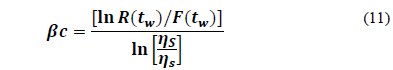
In eq. (11) η S and η S are the Weibull strength and stress parameters respectively. Now, because the common approach consists of using a safety factor to deal with uncertainties, let derive the corresponding formula to relate the used safety factor with the desired reliability.
4.1. Probabilistic Weibull safety factor by using the common β value
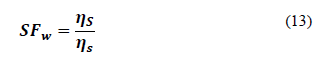
The Weibull safety factor is based on the strength and stress scale parameters (ηS,ηs), of the two parameters Weibull distribution is given by:
Thus, the SF w index for β S =β s is directly given by
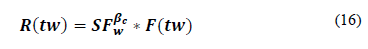
And for β S ≠β s , because by using Eq. (10) in terms of eq. (13) with the common βc value
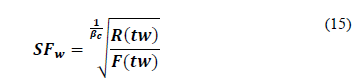
Then, the SF w index for any desired R(w) index is given by
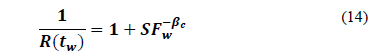
Or equivalently R(tw) in terms of known SF w index is given by
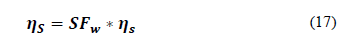
Also, notice that from Eq. (11), η S in terms of SF w is given by
Finally, the corresponding mean
 and standard deviation σwS of the strength variable (or the mean
, and stress standard deviation σwS of the stress, variable), by using the desired η
S
(or η
S
) value is determined as follows.
and standard deviation σwS of the strength variable (or the mean
, and stress standard deviation σwS of the stress, variable), by using the desired η
S
(or η
S
) value is determined as follows.
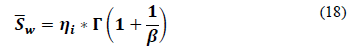
The mean
(or
 )is given by:
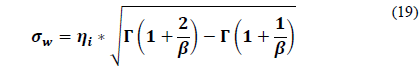
And the standard deviation σwS (or σwS) is given by
Now let present the steps to determine the common β c value.
4.3. Steps to determine common β C , SF w and the stress-strength analysis for (β 1 ≠β 2 )
In this section the steps of the proposed methodology to estimate the reliability index R(t w ) and the corresponding safety factor SF w are given. However, it is important to notice that 1) the derived safety factor is unique to the used reliability index R(t w ) 2) by using the common β c value, the stress-strength analysis for (β 1 ≠β 2 ) can easily be performed. The steps are as follows:
Step 1. Determine the desired reliability R(t w ) index to perform the analysis.
Step 2. By using the R(t w ) index of step 1, estimate the corresponding cumulative failure probability as:
Step 3. By using the R(t w ) index of step 1 in Eq. (7), determine the corresponding n value.
Step 4. Collect the set of n stress data and the set of n strength data.
Step 5. Determine the average (μ) of the stress and strength collected data.
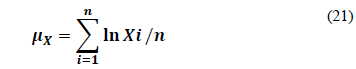
Step 6. Determine the logarithm of each one of the stress and strength collected data and determine their log-average values as
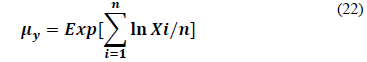
Then determine the exponential of the average of the estimated logarithms as
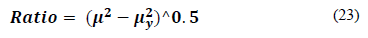
Step 7. With the average of step 5 and step 6 calculate the corresponding Ratio as
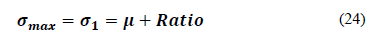
Step 8. By using the result of step 7 estimate the maximum and minimum stresses σ max and σ min values of the stress and the strength data as

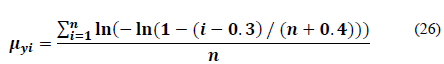
Step 9. By using the median rank approach estimate the average of the generated n y i elements as
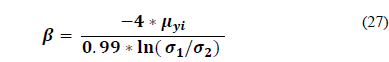
Step 10. Using the maximum and minimum stress σ 1 , σ 2 and μ y values [13], determine the corresponding Weibull shape β value as
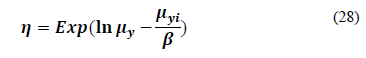
Step 11. By using the estimated β value of step 10, determine the corresponding Weibull scale η parameters as
The addressed β value of step 10, and the η value of step 11, are the Weibull stress distribution W s (β( s ,),η s ).
Step 12. By using the strength σ 1 , σ 2 values of step 5 in Eq. (28 and 29) determine the Weibull strength family W S (β( S ,),η S ).
Step 13. With the Weibull family of both the stress, strength and the desired reliability estimate the common β c by using eq. (11).
Step 14. By using the βc, η s and η s values in eq. (8), determine the corresponding reliability index R(t w ).
Step 15. By using eq. (13) calculate the corresponding probability safety factor SF w
5. Numerical application
In this section the numerical application to determine the reliability R(t w ).index and its corresponding safety factor SF w is showed. In section 5.1 the reliability index for β S =β s , is presented. Section 5.2 presents the reliability index estimation besides to the corresponding probabilistic safety factor in the case of β s ≠β S
5.1. Numerical application for β S =β s
The stress in this application is the usage mileage distribution, the strength is the miles to failure distribution of the component. Table 1 gives the data for the distribution of stress and strength.
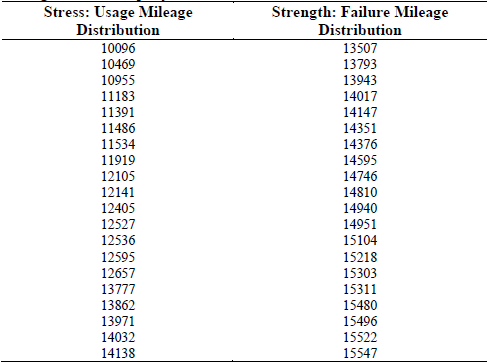
Since from this data the Weibull stress parameters are βs=12.2171, and ηs=12791 and the Weibull strength distribution parameters are βs=12.2171 and ηs=15041, then, from eq.(8) the reliability index is R(w)=0.878643, and from eq.(13) the corresponding Weibull safety factor is SF w =1.1759. Now let present the stress-strength analysis for β S ≠β s .
5.1. Numerical application for β S ≠β s .
A shaft testing subjected to bending and torsion stress load is presented. The shaft is subjected to random variable stress, then its behavior must be represented by a probability density function. On the other hand, all elements or products possess an inherent variable strength to support the stress exposed, in such a way in Table 2 the corresponding test results are presented.
Step 1. The desired reliability to perform the analysis is 95%.
Step 2. From eq. (21), the failure probability is 5% i.e. F(t w )=0.05.
Step 3. From eq. (7), the number of observations to be collected is n=19.49572575≅20.
Step 4. The experiment data is taken from Table 2.
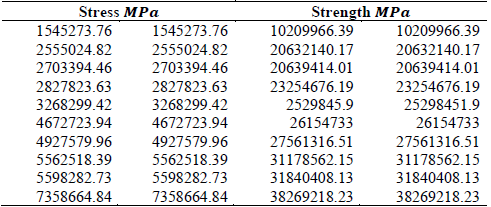
Step 5. From eq. (21), the average of the experiment data is μ s =9142854.736 for the stress and μ S =34847504.61 for the strength.
Step 6. Since the average of the log stress data is μ Xs = 15.75, and the average of the log strength data is μ Xs =17.3, then from eq.(22) μ ys =6989990.705 and μyS=32633020,09.
Step 7. From eq.(23), the ratio of the stress and strength data are Ratio s =5893371.078 and Ratio S =12224343.63.
Step 8. From eq.(24 and 25), the maximum and minimum values of the stress are σ1=15036225.81 and σ2=3249483.65 and for the strength they are σ1=47071848.24 and σ2=22623160.98.
Step 9. From eq. (26), μ yi =-0.5444.
Step 10. From eq. (27), the strength and stress shape parameters are βs=1.44 for the stress and βS=3.00 for the strength.
Step 11. From eq. (28), the strength and stress scale parameters are ηs=10201500.14 for the stress and ηS=39126161.24 for the strength.
Step 12. From eq. (11), the common shape parameter is βc=2.19038.
Step 13. From eq. (8) the corresponding reliability index R(t w )=0,9499997.
Step 14. From eq. (13) the corresponding probabilistic safety factor is S fw = 3.835.
6. Conclusion
Because all products or elements are subject to a random stress variable, and, the product or element possesses an inherent random strength to support the applied stress, then, the reliability of products must be determined by using the stress-strength reliability methodology. And because the Weibull distribution does not possess the additive property then the stress-strength analysis is not possible to perform, but by the formulated of a common shape βc parameter the stress-strength Weibull analysis can be performed. And because the βc value only depends on the desired reliability of the analysis, then for this reliability value it is unique. Since the derived SFw safety factor depends on the desired reliability, then it is a random variable, And because the SFw value is unique for the corresponding reliability index, then in practice the 𝑆𝐹𝑤 index can be used to represent the R(t) index and vice versa.

