


 Inglés (pdf)
 Articulo en XML
 Referencias del artículo
 Enviar articulo por email
 Citado por SciELO
  Citado por Google
  Similares en
SciELO
Similares en
SciELO  Similares en Google
 Permalink
1. Introduction
The increase in the use of nonlinear devices such as luminaires, appliances, computers, electric vehicle chargers, and photovoltaic inverters in distribution networks increases the harmonic distortion of voltage and current signals [1-5]. This causes the malfunction of equipment, heating of conductors and transformers, power demand increases, interference of communication systems, and audible noise in the case of certain lamps [6].
Therefore, the modeling of nonlinear loads is a topic of interest in the operation of low-voltage electric networks owing to the possibility of describing and predicting the behavior of these loads and consequently, estimating their impact on the networks and analyzing mitigation strategies.
Generally, electric loads can be studied using static models based on fundamental frequency, such as ZIP and exponential models, which are mathematical representations that relate the active and reactive powers consumed as a function of the supply voltage root mean square (RMS) value [7]. Multifrequency models such as the Norton equivalent model may also be used, which are predominantly applicable to loads with switched-mode power supplies (SMPSs), such as appliances and lighting loads, and converters, such as battery chargers or photovoltaic inverters [8].
The ZIP and exponential models tend to be widely used in the study of electrical network behavior owing to their simplicity and easy programming in simulation tools; in contrast, the Norton models are not used because of the greater programming complexity and computational cost in these models.
1.1. ZIP and exponential models
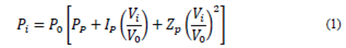
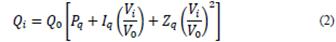
The ZIP model is composed of three types of loads: constant impedance (Z), constant current (I), and constant power (P). This model is described by polynomial eqs. (1) and (2), which allow the estimation of the active (P i ) and reactive (Q i ) powers consumed for a voltage V i , respectively; the coefficients of both equations must comply with the restrictions presented in eqs. (3) and (4) [9,10]. P 0 and Q 0 represent the nominal values of the active and reactive power for a nominal supply voltageV 0 , respectively; P P , I P , and Z p represent the corresponding coefficients of the ZIP model for active power; moreover , P q , I q , and Zq represent the coefficients of the ZIP model for reactive power.
The exponential model is obtained by the functions described in eqs. (5) and (6) to estimate the active (P k ) and reactive (Q k ) powers for a voltage V k , respectively. The parameters ⍺ and 𝛽 describe the behavior of the load; when these parameters are equal to 0, the load behaves as a constant power; in case both parameters are equal to 1, the load behaves as a constant current; and if both parameters are equal to 2, the load corresponds to a constant impedance [7].


1.2. Norton equivalent model
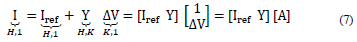
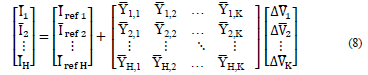
The Norton equivalent model based on the coupled admittance matrix method linearizes the behavior of a nonlinear load at a reference operating point for various harmonic orders. Eqs. (7) and (8) present the model in a compact and extended matrix form, respectively. I is the vector of currents, Y is the coupled matrix of admittances, ΔV is the variation of the voltage signals, and I ref is the vector of reference currents [11], whose dimensions are given by H and K, which represent the highest odd harmonic order used for current and voltage signals, respectively.
1.3. Load models applications
Based on revised studies [9,12-24], it can be observed that residential, commercial, and industrial loads are generally modeled under the measurement approach. This approach requires the use of monitoring tools to determine the sensitivity of the load to changes in the level of voltage and frequency; moreover, it is one of the most reliable ways to reflect the behavior of real loads.
Static models based on the measurement approach are widely used for the study of several electrical loads. Bokhari et al. [9] experimentally determined the ZIP coefficient model to represent modern loads such as compact fluorescent lamps (CFLs), and described the effect of SMPSs on the behavior of certain loads. Quilumba et al. [10] determined the ZIP coefficients model of flat-screen televisions to update the models of these residential loads. Chiang et al. [7] examined the accuracy of estimation of active power using five load models, i.e., static power system simulator for engineering, ZIP, exponential, a model of the Electric Power Research Institute, and ZIP-exponential, based on measurements made at substation loads. Pijnenburg et al. [17] proposed a nonintrusive monitoring approach for residential loads based on the ZIP model.
Conversely, multifrequency models were applied to study light loads, inverters, and motors. Sun et al. [18] calculated the parameters of the coupled admittance matrix of AC/DC converters based on a frequency analysis of random electrical signals obtained from simulations. Zhou et al. [19] estimated the parameters of an admittance matrix for a charging station for electric vehicles from measurements. Wang et al. [20] (2011) determined the Norton model of an inverter to analyze, from simulations, its harmonic interactions, including harmonic resonance. Subsequently, Wang et al. [21] (2018) investigated the harmonic interactions produced by microinverters and the stability of a low-voltage power grid using a Norton model.
One of the frequently studied light loads using the Norton equivalent model is the CFL. Yon et al. [22] presented the Norton equivalent model to assess the collective impact of several CFLs; further, Watson et al. [23] used a model to quantify the effect of widespread adoption of CFLs in a distribution network. Molina et al. [12] (2014) and Molina et al. [24] (2015) presented Norton models based on the coupled admittance matrix to estimate the harmonic distortion produced by CFLs, validated from experimental laboratory tests.
Molina et al. [13] (2017) calculated the parameters of the coupled admittance matrix for light-emitting diode (LED)-type lighting loads to calculate harmonic emissions and contribute to the development of a procedure for experimental determination of model parameters.
According to the findings observed in the reviewed literature, the ZIP and exponential models and equivalent Norton models are used extensively to model small electrical charges, including nonlinear charges.
1.4. Scope of the study
Studies on the impacts caused by harmonic distortion associated with nonlinear loads should consider the diversity of the existing loads in the electrical network and their representativeness in energy consumption. In the case of lighting loads, the current penetration of LED lighting in commercial, industrial, academic, and residential buildings is evident, replacing fluorescent lighting and other technologies; consequently, LED luminaires are the subject of recent studies in load modeling [13]. However, it is essential to indicate that such changes are gradual and the representativeness of fluorescent lighting is still significant in the energy consumption of buildings, as is the case in Colombia. Lighting can represent between 20-30% of the energy consumption of commercial, industrial, and educational facilities, among others [14]. Therefore, it is necessary to have load models that describe both LED and fluorescent luminaires.
Fluorescent luminaires can be compact or fluorescent tubes; some of these can be characterized by high levels of total harmonic current distortion, which is close to 100% [25-27]. Fluorescent recessed lightings are frequently used in buildings, although there are only limited studies when compared to CFLs. Therefore, this work presents a modeling study on this type of load using the ZIP, exponential, and Norton equivalent models based on the measurement approach. The parameters of the models were determined from the measurements of the waveforms of the electrical voltage and current signals, for two types of single-phase fluorescent luminaires of 2.0 ft × 2.0 ft: one on-off-type luminaire and one dimmable-type luminaire fed with distorted voltage signals.
The coefficient of determination R2 was used to assess the degree of adequacy of the ZIP and exponential models, while the Norton model was verified through the training approach. The validation of the models regarding the estimation of the active and reactive powers was based on the calculation of errors, i.e., absolute and percentage errors, considering 20 special voltage signals. The models were also validated for the estimation of the current signal based on the calculation of the RMS error (RMSE) and normalized RMSE (NRMSE) rates.
2. Experimental methodology
This section describes the selected loads, scenarios for taking measurements, experimental assembly in the laboratory, and adequacy and validation methods to analyze the performance of the established load models.
2.1. Light loads
This work studied two types of fluorescent luminaires, i.e., the on-off type (constant luminous flux) and dimmable type (variable luminous flux), installed in the Edificio de Ingeniería Eléctrica of the Universidad Industrial de Santander (UIS; Bucaramanga, Colombia). These luminaires were selected because they represented the highest energy consumption in the building.
Table 1 lists the general characteristics of the utilized luminaires based on the rated power, type, and number of tubes in the case of fluorescent luminaires, active power for each fluorescent tube, and type of luminous flux control used by dimmable luminaires.
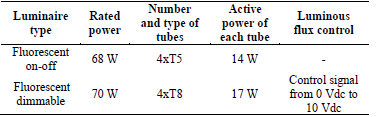
This study considered three levels of luminous flux: minimum (0 Vdc), intermediate (5 Vdc), and maximum (10 Vdc).
2.2. Experimental assembly
Fig. 1 illustrates the electrical connection scheme of the experimental assembly components for the development of this study, whose primary components are a source (Chroma 61701), an energy meter (PQube3), and a load. The Chroma 61701 programmable source (1500 VA with three-phase-neutral-ground output) generated the distorted supply voltage signals for loads with a maximum error rate of ± 0.2%. The PQube3 network
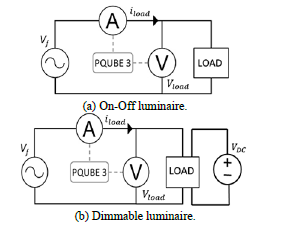
analyzer is a 0.2s accuracy class meter and a high-performance monitoring instrument on energy quality issues, which recorded the electrical signals of voltage and current in the load. The sampling frequency chosen was 7680 Hz, which allowed 128 samples to be obtained per cycle for a fundamental frequency of 60 Hz.
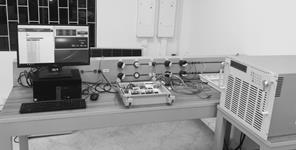
Fig. 2 shows the physical assembly of the equipment and remote monitoring from a computer.
2.3. Scenarios and test measurement
The experiment involved determining the parameters of the load models for four operation cases: one case for the On-off luminaire and three cases for the dimmable luminaire (minimum, intermediate, and maximum). In each case, four scenarios or types of test voltage signals were applied. The number of signals that compose a scenario corresponds to the number of measurements. The analysis scenarios were as follows: a) pure sinusoidal signal (9 measurements), b) signal with third harmonic (54 measurements), c) frequency sweep (181 measurements), and d) special signals (20 measurements). Each case consisted of 264 measurements, for a total of 1056 measurements taken in this experiment.
The determination of the ZIP and exponential parameter models was based on 63 measurements for each of the four cases, which corresponds to the measurements obtained for the 9 pure sine signals and the 54 voltage signals formed by a fundamental component and a third harmonic, respectively. The determination of the Norton model is based on the samples of 181 measurements (1 measurement of pure sine signal and 180 measurements of the frequency scan). Finally, the validation of the load models consisted of analyzing their performance against 20 special voltage signals.
a) Pure sine signal. The RMS value of the fundamental component consisted of values ranging from 100 to 132 V, with a step of 4 V and phase of a blow, to guarantee a considerable amount of data in the determination of the ZIP and exponential parameter models. In the four cases that were analyzed, these 9 signals were applied for a total of 36 measurements in this scenario.
b) Signal with third harmonic. This scenario consists of voltage signals with a fundamental component and third harmonic component; both components had the same phase angle, φ_1=φ_3=0°. We considering the nine signals of the previous scenario and six RMS values for the third harmonic, which are 1, 3, 5, 10, 15, and 20 V; then, 54 measurements were taken per case, for a total of 216 measurements. Fig. 4b shows one of the waveforms obtained by adding the third harmonic order to a fundamental component signal.
c) Harmonic sweep of the supply voltage signal. Each signal consisted of a fundamental component (120∠0° V) and harmonic component of the 3rd, 5th, 7th, 9th, or 11th order, each of which took RMS voltage values of 1, 3, 5, 10, 15, or 20 V with phase angles of 0, 60, 120, 180, 240, or 300°. For each case, 180 measurements were taken for a total of 720 measurements.
d) Specific voltage signals. We selected 20 specific voltage signals to analyze the performance of the load models, i.e., two voltage signals obtained in the low-voltage bus bar of the Edificio de Ingeniería Eléctrica (Signals 1 and 2); a voltage signal from the power grid of the Edificio de Alta Tensión - UIS Campus (Signal 3); a voltage signal at the residential level in the city of Bucaramanga (Signal 4); two typical voltage signals in BT distribution networks: flat-top signals present in residential networks (Signal 5) and pointed-top signals present in industrial networks (Signal 6) [28]; three voltage signals corresponding to research articles (Signals 7, 8, and 9) [22]; a set of three voltage signals (Signals 10, 11, and 12); and eight signals obtained from the Appendix of Nassif et al. [11] (Signals 13-20).
2.4. Power and harmonic distortion parameters estimation
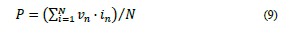
The single-phase active power can be determined using eq. (9), where v n and i n are the sample vectors of N values of the voltage signals and current, respectively, obtained from the meter.
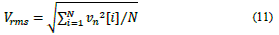
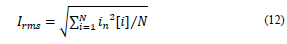
The apparent power per phase is determined using eq. (10), where the RMS values of the voltage and current signals can be calculated using eqs. (11) and (12), respectively.

The power factor (FP) was calculated as P⁄S. The reactive power (Q) can be calculated as
 corresponding to the Fryze model [29].
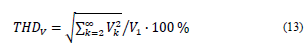
The total harmonic distortion index of the voltage and current can be determined using eqs. (13) and (14), respectively, where k is the harmonic component number, V 1 and 𝐼 1 are the RMS values of the fundamental voltage and current components, respectively, and 𝑉 𝑘 and 𝐼 𝑘 are the RMS values of the harmonic components k of voltage and current, respectively.

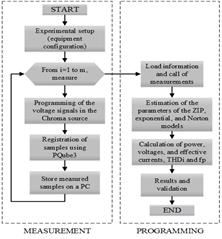
The calculation of the power and distortion parameters and the parameters of the load models, i.e., ZIP, exponential, and Norton equivalent, was performed based on the analysis of the measurements in a tool developed in MATLAB. Fig. 3 presents the structure of this study, from the assembly of the equipment to obtaining the results.
2.5. Adequacy and validation methods
The adequacy of the ZIP and exponential models was analyzed based on the coefficient of determination R2, while the training approach was used in the case of the Norton model. Training is a technique used to evaluate the uncertainty or possible errors of a model or simulation based on the data that was used to create it. This approach allowed the analysis of the magnitude and phase angle deviations, taking into account the calculation of percentage errors in the case of the magnitude and absolute errors in the case of the phase angles.
The models were validated based on the calculation of absolute errors between the measured and estimated values of the obtained active and reactive powers. The quality of the current signal estimation by the Norton model was also validated based on the calculation of the RMSE and NRMSE error indices.
3. Analysis results and discussion
This section describes the characterization of the parameters of the power and current signal of the luminaires when they are fed by the special voltage signals (aforementioned scenario d), determination of the ZIP, exponential, and Norton equivalent load model parameters, validation of the established load models, and a performance comparison of the load models.
3.1. Characterization of voltage and current signals and power parameters
Tables 2 and 3 list the values of Vrms, Irms, P, QF, S, THDV, and THDI measured from the operation of the luminaires using the 20 special voltage signals (scenario d). These data indicate that the luminaires have a capacitive behavior, where the magnitude of Q corresponds to the application of the Fryze model; the power factor is measured to be at values over 0.97 in all cases. Similarly, it is possible to observe that the intermediate operation (5 Vdc) of the dimmable luminaire does not represent a value close to half of the nominal power as the current and powers demanded are close to 0.4 A and 52 W, respectively, which are values similar to those obtained during the maximum operating state (10 Vdc), which are 0.5-0.6 A and 71 W.
Table 2 Characteristic values of voltage and current obtained during the operation of the luminaires
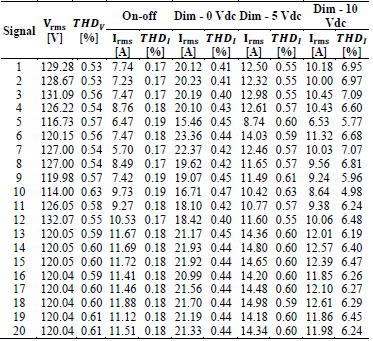
Source: The Authors.
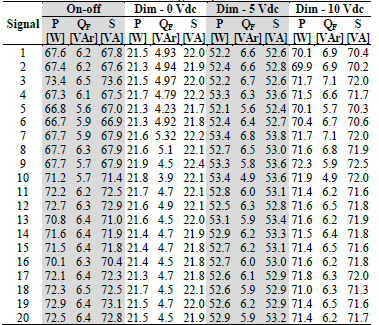
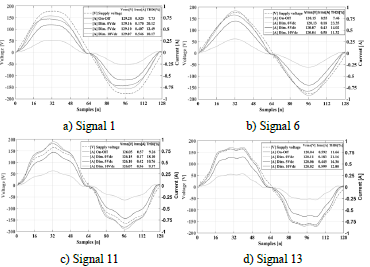
Fig. 4 illustrates the results of the current signals for the four cases in the operation of the luminaires, where they are inputted with six specific voltage signals. Visually, a significant distortion of the current signal is not appreciated. Specifically, the values of 𝑇𝐻𝐷 𝐼 vary between 5.70 and 12.00% for the on-off and dimmable luminaires with maximum luminous flux; however, the value of this parameter increases when the dimerization of the luminous flux is intensified, reaching maximum values of 15.45 and 23.35%.
The two fluorescent luminaires are characterized by a marginal distortion of the current signal when compared to the CFLs, which can produce highly distorted currents with 𝑇𝐻𝐷 𝐼 values of up to 100% [15,22,30].
3.2. ZIP and Exponential models
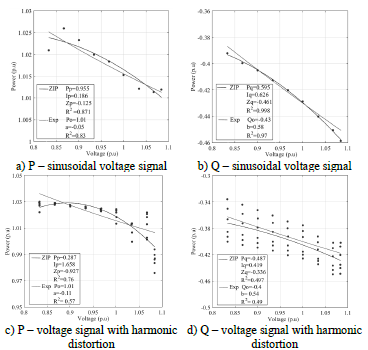
Fig. 5 illustrates the behavior of the ZIP and exponential models for the on-off luminaire. The values of the determination coefficients indicate that the adequacy of the models is satisfactory for estimating the active (R2 = 0.87 and R2 = 0.83) and reactive (R2 = 0.9989 and R2 = 0.97) powers, for the ZIP and exponential models, respectively, when the voltage signal is pure sinusoidal. However, these values are unsatisfactory (R2 = 0.76, R2 = 0.50, R2 = 0.57, and R2 = 0.49, for the ZIP and exponential models, respectively) when the voltage signal is distorted with the presence of the third order harmonic component.
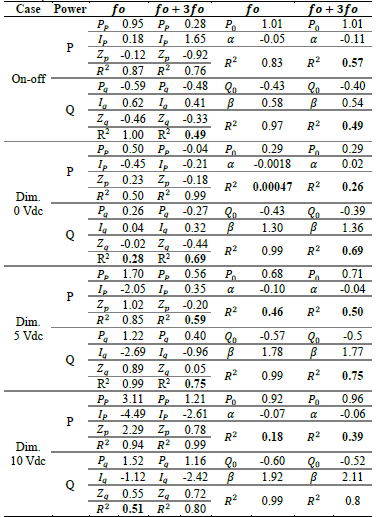
Table 4 lists the parameters of the ZIP and exponential models for the four operation cases of the luminaires. Additionally, it relates the values of R2 in two shades of gray, dark and light, which indicate that the model may or may not result in a good estimate of the power, respectively. The values of the model parameters show the significant sensitivity of the ZIP and exponential models to the harmonic distortion of the voltage signal, which undermines their estimation quality.
Source: The Authors.
Figure 5 Active and reactive power values and estimation curves of the ZIP and exponential models: On-off luminaire case
The distortion of the voltage signal significantly affects the R2 values as they vary between 0.5 and 0.7 for the on-off luminaire and between 0.4 and 0.7 for the dimmable luminaire. Therefore, these values show that the ZIP and exponential models exhibit unsatisfactory behavior in the presence of distorted power voltage signals.
These results are in line with the conclusions of Asres et al. [31] and Bagheri et al. [32], who claim that the ZIP and exponential models do not consider the effect of nonsinusoidal supply voltages, which can cause the accuracy of exponential and polynomial load models to degrade in the presence of distortion.
3.3. Norton equivalent model
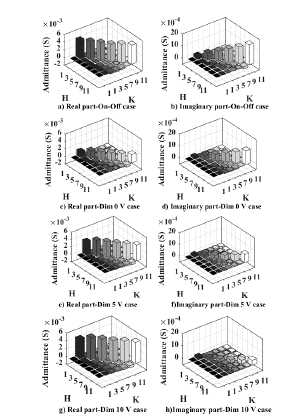
Fig. 6 shows the admittance matrices of the Norton model for the four cases that were studied (on-off luminaire and the three operating states of the dimmable luminaire), which allow us to appreciate that the diagonal has a dominant presence with respect to the other components of the matrix, which is owing to the greater intensity of the relationship between the harmonic voltage and current components of the same order.
Source: The Authors.
Figure 6 Graphical representation of the coupled admittance matrices for the four operation cases of the luminaires
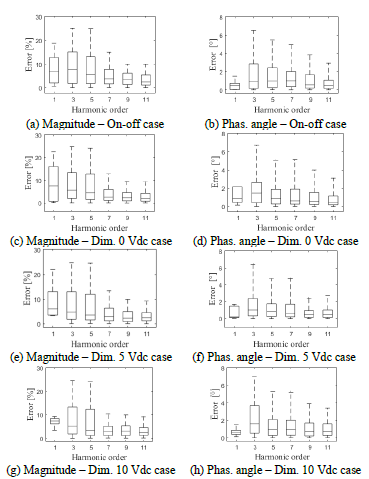
The verification of the Norton model was performed using the training approach. Fig. 7 shows the boxplots, which allow us to appreciate the distribution of the error deviations in the magnitude and phase angles. For example, Fig. 7a indicates that 50% of the error values between quartiles 1 and 3 are between 3 and 13% and are represented by the box; the line inside the box indicates that 50% of the errors are less than 7%. This value is closer to the first quartile (errors less than 3%), which indicates the existence of a positively biased data distribution. Finally, the extremes indicate that the minimum and maximum errors are 1 and 19%, respectively.
Source: The Authors.
Figure 7 Boxplot diagrams of the Norton model for the four operation cases of the luminaires
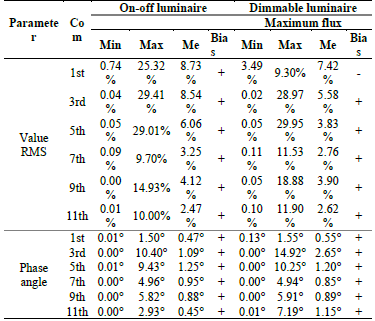
Table 5 lists the data of the percentage and absolute errors of estimation of the magnitude and phase angle, respectively, for each fundamental and harmonic component of the current signals for the on-off and dimmable luminaries in their maximum operating state.
Table 5 Training approach parameters for the on-off luminaire and maximum operation case of the dimmable luminaire
Source: The Authors.
Most of the established models have a positive bias in the deviations of magnitude and phase angles in the fundamental and harmonic components, with errors in magnitude between 0 and 18% for the on-off luminaire and between 0 and 15% for the dimmable luminaire. In the case of phase angles, 50% of the errors in estimating the phase angles of the components of the on-off luminaire and dimmable luminaire are predominantly between 0 and 2° and between 0 and 4°, respectively.
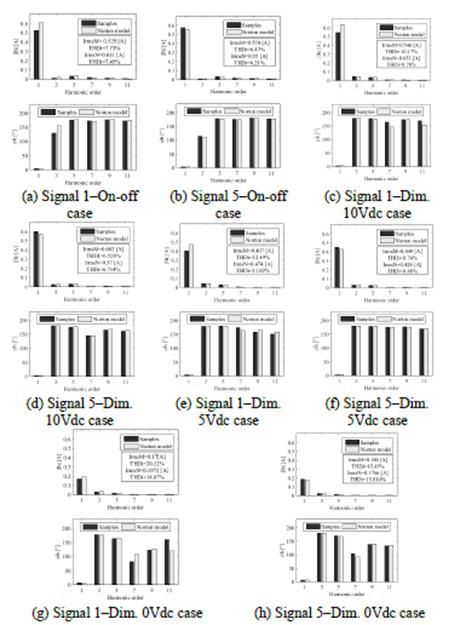
The Norton model validation consisted of evaluating the quality of estimation of the current signal for 20 specific voltage signals. Fig. 8 shows a comparison of the RMS values and phase angles of the fundamental and harmonic components obtained from the measurement (dark bars) and the estimation (light bars) for three specific signals. In general, the results show a satisfactory performance of the established Norton models, with relative error percentages of less than 11 and 16%, respectively.
Source: The Authors.
Figure 8 Current demanded spectra by the luminaires for the four operation cases when they are fed by the specific signals 1 and 5
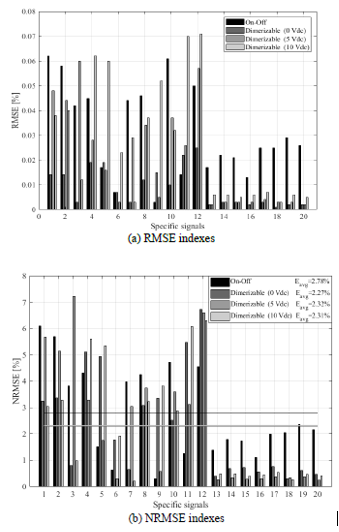
Fig. 9 shows a comparison of the RMSE and NRMSE indices that evaluate the ability of the Norton equivalent model to estimate the current of the on-off and dimmable luminaires in three states. RMSE estimation errors are less than 0.08 A for all cases, while NRMSE errors range between 0.30 and 7.20%, whose average errors are significantly similar in the four cases (2.78, 2.27, 2.32, and 2.31%), which indicates a satisfactory performance of the Norton models. In short, this model describes the harmonic interaction between voltage and current; therefore, it is a useful tool to study the harmonic distortion effect caused by nonlinear loads.
Source: The Authors.
Figure 9 Root mean square error (RMSE) and normalized RMSE indexes between the model values and the measured values for the four operation cases of the luminaires
Each admittance matrix obtained in this study demanded 181 laboratory measurements with an average current estimation error of 2.4%, which is a significantly small amount of data when compared to the Norton model for the 14 W CFLs developed by Molina et al. [24], who used data from 100,000 Monte Carlo simulations and obtained average errors of less than 2%; however, they considered relative errors of magnitude and phase angle of load currents of up to 5% and 10°, respectively, as acceptable.
3.4. Models performance comparison
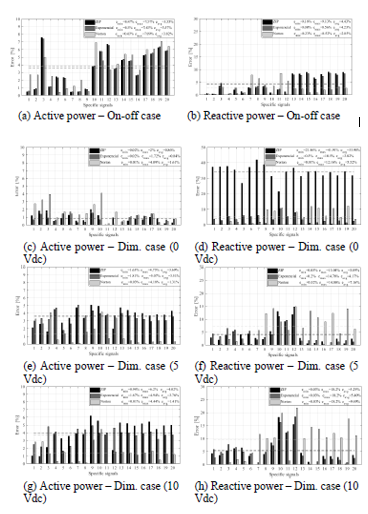
Fig. 10 illustrates the calculated percentage errors between the measured and estimated values of active and reactive powers using the three models for the four operation cases that were analyzed. In the case of the on-off luminaire, the average percentage of active power estimation for each model was similar (3.55, 3.57, and 3.82), while the reactive power was estimated with a lower average error of 2.85% using the Norton model. The comparison of the errors of active and reactive powers obtained from the three analyzed load models for the on-off luminaire are illustrated in Figs. 10a and 10b.
Source: The Authors.
Figure 10 Average estimation errors of the active and reactive power for the three load models for the 20 specific voltage signals
For the intermediate and maximum operation of the dimmable luminaire, the exponential and Norton models recorded average errors of estimation of the active power of 0.84 and 3.73%, respectively, and 1.3 and 1.6%, respectively, and the values were less than 6 and 10% for reactive power, as shown in Figs. 10c-10f. Figs. 10g and 10h show the power estimation errors for the dimmable luminaire operating at 0 Vdc. The exponential and Norton models estimated the powers with maximum errors that were primarily less than 12%, while the estimation errors of the ZIP model were up to 41.91% for the reactive power.
In summary, the exponential and Norton models allow us to estimate the power consumed by the four cases of operation of the fluorescent luminaires; however, the ZIP model is inefficient in describing reactive power owing to the high estimation errors in the minimum state of the dimmable luminaire.
4. Conclusions
This article presented the determination of the parameters and performance analysis of the ZIP, exponential, and Norton equivalent models for two types of luminaires, i.e., on-off and dimmable luminaires, using an experimentation process.
Therefore, the following conclusions can be presented:
It was determined that the ZIP and exponential models do not exhibit a satisfactory behavior when the waveform of the voltage signal changes owing to the presence of harmonics.
The Norton model, obtained from the frequency sweep, managed to describe the behavior of the on-off and dimmable luminaires when the supply voltage signal had more than one odd harmonic.
The Norton model allowed the estimation of the behavior of the luminaires using measurements taken under different RMS values in the fundamental component of the supply voltage signal.
The results showed that the model in the frequency domain reliably simulated the real behavior of the luminaires, both in terms of current and power.

