


 Inglés (pdf)
 Articulo en XML
 Referencias del artículo
 Enviar articulo por email
 Citado por SciELO
  Citado por Google
  Similares en
SciELO
Similares en
SciELO  Similares en Google
 Permalink
1. Introduction
Geiger gaseous detectors have been an effective choice for applications using beta radiation sources, such as dosimetry [1,2] and thickness measurement [3-5]. Although this detector has a detection efficiency of up to 98% and a low cost, the Geiger detector is limited by the counting radiation process (the detector loses the information of the energy loss generated by the gas ionization). Studies using energy distribution analysis with scintillators and semiconductor detectors [6,7] have developed new algorithms for thickness measurement through radiation transmission with beta sources. Using the energy distribution analysis and identification of the beta radiation sources, new methods to improve the instrumentation accuracy and low level of uncertainty have been developed (+/-2mg/cm2 for polyethylene absorber) [6]. However, a study of the identification of beta radiation sources using energy distribution with the latest gaseous detector technology has not yet been carried out. Gaseous detectors evolved to the Micro Pattern Gas Detectors (MPGDs). The MPGDs enhance all the characteristics of previous Geiger and proportional gaseous detectors in terms of detection capacity, energy, spatial and temporal resolution. The MPGDs have evolved mostly due to the interdisciplinary efforts of the CERN RD-51 collaboration program that is in charge of the Gaseous Detector Development (GDD) [8] - with the participation of many institutions from many countries around the world as well.
One of the MPGDs classes is the Gas Electron Multiplier (GEM). The GEM detector is a sealed chamber filled with some gases (normally, a mix of a noble and a quencher gas) composed of a drift (cathode), one or more GEM-foils (Three GEM-foils in our set-up), and a multichannel readout board (anode). The standard GEM-foil is a conductor-isolator-conductor layer with a pattern of triangular holes of 70µm in diameter and 140µm in pitch. The connection of the upper and bottom copper layers of the GEM-foil, with a differential voltage, creates a strong electric field through the holes. When a photon or charged particle ionizes the gases in the drift zone (Ed), an ion-electron pair is created. The electrons then must pass through the holes of the GEM-foil to reach the anode, and the ions travel in the opposite direction towards the cathode. As a result, when the electrons cross the high electric fields in the holes of the GEM-foil, an avalanche is generated that is proportional to the number of primary electrons produced in the drift zone [9-11].
For charged particles, the GEM has reached detection efficiencies greater than 95% when the effective gain of the detector is of order of 104, with an energy resolution between 15% and 25% [12,13]. These characteristics make the GEM detector an effective candidate for applications involving the beta sources previously mentioned in which the detection rate capability, temporal resolution, energy resolution, and detection efficiency are crucial. Most of the GEM studies demonstrate effective detector performance with photons generated by 55Fe source for different applications [14]. Nevertheless, there is not enough information for the GEM performance in terms of energy loss in the drift zone, energy distribution, and possible identification of the main beta sources used in industrial applications.
In this work, all the features of experimentation set-up are described in Section 2. Section 3 shows the theoretical energy loss into the drift zone of the 3GEM of the beta sources used. The detector experimentation results in energy distribution were compared to the theoretical results obtained from 90Sr and 204Tl beta sources. Additionally, Section 3 shows the identification of 90Sr and 204Tl beta sources by energy distribution analysis. Finally, the conclusion of the 3GEM performance with beta radiation sources are discussed in Section 4.
2. 3GEM Assembly and experiment description
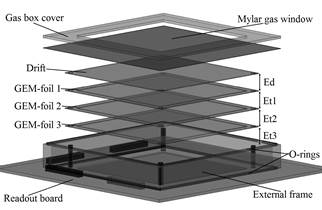
The parts and assembly of the 3GEM are presented in Fig.1. The parts are: the multichannel read-out board that is connected to the electronics and also serves as the detector support; the external frame with upper and lower O-rings for the detector tightness; the gas box cover to seal the top of the detector; a thin window made of mylar of 18.2mg/cm2 to make the radiation lose the minimum amount of energy when it is passed through; the drift and the three GEM-foils in a cascade of 10x10cm2 of area. The measurement of the gaps are: 3mm for the first ionization in the drift zone (Ed) and 2mm for the transfer zones one (Et1), two (Et2), and three (Et3).
Source: The Authors.
Figure 1 Parts of the standard 3GEM detector used at Antonio Nariño University.
All the detector components were assembled in the Detectors Laboratory at Universidad Antonio Nariño in a clean room (ISO 5) to guarantee an environment without dust. We acquired the GEM-foils from CERN. They were tested at 500V (with currents always below 3nA) to burn any possible microparticle inside the holes [12,15].
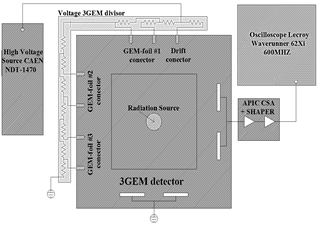
Once the detector was assembled, the set-up and connection of the different components are shown in Fig. 2. For the source voltage, we used a high voltage source CAEN NDT1470. The voltage distribution for the drift and the three GEM-foils was made with a voltage divisor. The voltage percentage for the first GEM-foil was 10%, 9.12% for the second, and 8.0% for the third GEM-foil. The voltage distribution given to the drift zone (Ed) and the transfer zones (Et1, Et2, y Et3) was a voltage percentage of 18.22% for each.
Source: The Authors.
Figure 2 3GEM detector Set-up consisting of a high voltage source, voltage divisor, 3GEM detector, radiation source, APIC and Oscilloscope.
The mixture of gases used was Ar/CO2 with a ratio of 70/30% at atmospheric pressure and at 20°C of temperature. The flux of the gases was 2.0+/-0.5l/h controlled by two flowmeters located at the detector input and output. For the detector start-up, we fluxed the 3GEM for several hours with Ar/CO2 to remove humidity. Subsequently, we increased the total 3GEM voltage slowly until reaching 4100V -limiting the current of the voltage source to 4µA, and verifying that no sparks were inside the detector.
A preamplifier and shaper (APIC) made at CERN was used for the amplification process. The APIC was designed with a charge sensitive pre-amplifier (CSA) and a shaper stage with 1µs of peak time. We tested the APIC response by using and changing the voltage of a square wave generator followed by a capacitor of 1pF to generate known charges in the input (simulating the detector response). The APIC output voltage had a linear behavior with respect to the charge applied at the input with a relationship of 3mV/10-15C with σ = 5.6mV. This calibration ensured the positive performance of the electronic amplifier before testing it with the 3GEM. The APIC output was connected to a Lecroy WaveRunner 62Xi oscilloscope of 600MHz bandwidth. All the components previously mentioned are shown in Fig. 2.
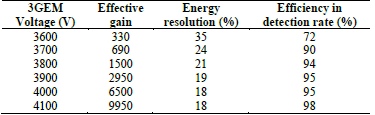
The main 3GEM parameters were measured at different voltages. Table 1 shows the results of our standard 3GEM working between 3600V and 4100V in terms of effective gain, energy resolution and detection rate.
3. Detector response from beta radiation sources
This section is subdivided into the theoretical energy loss by beta radiation in the 3GEM drift zone; the comparison between the detector energy distribution and calculated energy loss; and the results of the fitted Landau distribution depending on the 3GEM total voltage for beta sources identification. All the results are from the 90Sr, and 204Tl radiation sources.
3.1. Theoretical energy loss
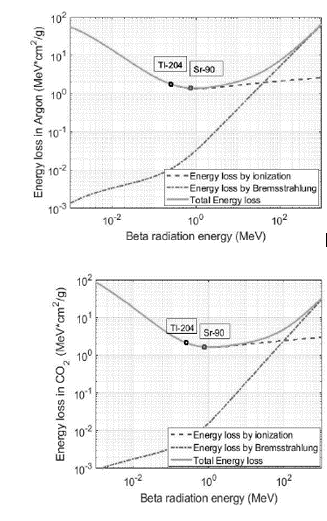
Due to the natural difference between X-ray and beta radiation, they have different interactions with matter. The X-ray photons interact by photoelectric, Compton and pair production. However, the beta electrons interact through ionization and Bremsstrahlung with the gas molecules of the gaseous detector. The energy loss of beta particles by unit length (dE/dx) is given by the Bethe-Bloch equation by eq. (1) [16,17]. In the case of a 3GEM, there is a trajectory of energy loss of about 3mm of length filled with Ar/CO2 with a proportion of 70/30% in the drift zone (Ed).
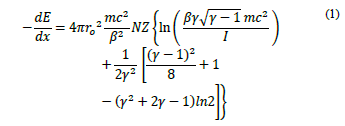
In eq. (1): ro is the electron radius, mc2 is the rest energy of the electron, N is the number of atoms by cubic meter in the absorber material, Z is the atomic number of the absorber material, β is the relative phase velocity of the particle, and γ is the Lorentz factor [16]. However, this formula is applied to monoenergetic electrons and takes into account only the ionization effects. For non-monoenergetic beta radiation sources (such as 90Sr and 204Tl), it is necessary to obtain an approximation of the average energy of the electrons given by Eav = Emax/3 (Eav 90Sr =760keV, Eav 204Tl =254keV). The total energy loss is found by dE/dx total = dE/dxionization+ dE/dxBremsstrahlung, where an approximation of the energy loss by Bremsstrahlung is dE/dxBremsstrahlung = Z*Eav/750MeV * dE/dxionization [16]. Fig. 3 shows the energy loss in MeV*cm2/g for the Eav of the 90Sr and 204Tl beta sources in Argon (top) and in CO2 (bottom).
Fig. 3 shows that energy loss by ionization is dominant and energy loss by Bremsstrahlung was negligible for the beta sources in both gases. The amount of energy loss calculated for the drift zone Ed (3mm) of the 3GEM detector with a mixture of Ar/CO2 in a proportion of 70/30%, was 745eV for 90Sr and 968eV for 204Tl. It is notable that the higher a source energy (up to Eav ~ 2MeV), the less energy loss in the gases.
Source: The Authors
Figure 3 Total energy loss, energy loss by ionization, and energy loss by Bremsstrahlung in Argon (top) and CO2 (bottom) gases calculated by eq. (1).
3.2. Experimental 3GEM energy distribution
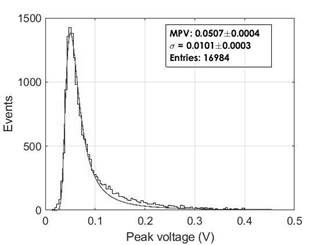
The energy distribution generated by beta particles is shown by a Landau distribution in Fig. 4. The energy distribution shown is a Gaussian distribution at low energies but has a long tail towards high energies. This tail corresponds to the beta particles close interactions with the target nuclei [18,19]. We obtained the energy distribution from the peak voltage of the APIC output (taking into account the mentioned APIC output of 3mV/10-15C). Two parameters are fundamental for the Landau distribution: the Most Probable Value (MPV), that is the more frequent value of energy loss in the histogram (located on the peak Landau distribution), and the sigma value (σ). Fig. 4 shows the experimental energy spectrum taken from the 3GEM working with Ar/CO2 in a proportion of 70/30% at 3700V, as well as the fitted Landau distribution. We checked that the fitted Landau distribution corresponded to the recorded data generated by the detector.
Source: The Authors.
Figure 4 3GEM energy distribution from 90Sr with Ar/CO2 in a proportion of 70/30% at 3700V, and the fitting Landau distribution.
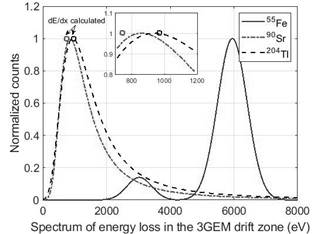
Fig. 5 shows the previous energy loss calculated (squares) in the drift zone (Ed) of the 3GEM from the beta radiation sources 90Sr (0.745keV) and 204Tl (0.968keV). It also shows the normalized fitted energy distribution obtained with the 3GEM detector for the beta sources as well as from the soft X-ray photons generated by a 55Fe source. In the histogram, in order to pass from peak voltage to energy in the X-axis, it is necessary to introduce a knowing energy distribution, such as a 55Fe source. The 55Fe photons of the soft X-ray source transmit most of their energy through the photoelectric effect. From the 55Fe energy spectrum in Fig. 5, the bigger peak corresponds to the detection of photons at 5.9keV and the second peak of 3.0keV to the Argon escape - with it being 15% of the main peak. After obtaining the 55Fe energy distribution, it is possible to pass from peak voltage to energy in the X-axis as is seen in Fig.5.
Source: The Authors.
Figure 5 Calculated energy loss into the 3GEM drift zone (squares) by eq. (1) and fitted energy distribution from beta 90Sr, 204Tl, and 55Fe radiation sources obtained by the 3GEM.
Even when the average energy Eav from beta radiation sources is much higher than the 55Fe source (Eav 90Sr =760keV, Eav 204Tl =254keV), the beta sources lose a minimum amount of energy by ionization into the drift zone of the 3GEM (1% for 90Sr and 3.8% for 204Tl). Fig. 5 shows that the beta radiation sources energy loss calculated (squares) is close to the MPV fitted Landau distribution obtained by the 3GEM. Additionally, Fig. 5 shows that the 90Sr sigma of the fitted Landau distribution is sufficiently different to distinguish from 204Tl (difference of 18%).
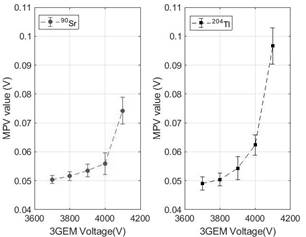
Figs. 6, 7 show the MPV and sigma values from the fitted Landau distribution provided by the 3GEM detecting the beta sources used at different voltages. It is possible to see three main characteristics in the graph. When the 3GEM is working below 4000V, both fitted spectra are similar (MPV and sigma) and it is not possible to identify which distribution corresponds to its radiation source. At 4000V, it is possible to differentiate the MPV and the sigma value from the fitted beta radiation sources. However, the error bars, either the MPV or sigma ones, make it possible to confuse the identification of each beta source. For 4100V, it is clear to identify each beta radiation source through the fitted distribution due to there being enough difference in the MPV and sigma values. The 3GEM high effective gain and energy resolution working at 4100V (showed in Table 1) clarify significantly the fitted energy spectrum beta radiation sources of high energy (90Sr) in comparison to low energy (204Tl) - taking into consideration the MPV and sigma values of the fitted Landau distribution
Source: The Authors.
Figure 6 MPV value of the fitted Landau spectrum at different 3GEM voltages from 90Sr and 204Tl beta sources.
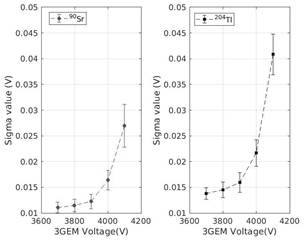
4. Conclusions
The standard 3GEM detector demonstrates that through energy distribution, it is possible to differentiate the main beta sources used in the industry for applications such as tracking, thickness measurement, and dosimetry. We demonstrated that although the standard 3GEM has a minimum volume of gases in the drift zone (which makes minimal differences on the energy loss between different beta radiation energies), the calculated energy loss by Bethe-Bloch formula, and the experimental energy loss results were close (errors of 12.9% from 90Sr, and 3.3% from 204Tl). Additionally, with an energy resolution of 19%, measured at 4100V Ar/CO2, in proportion of 70/30%, it was possible to differentiate the energy distribution of high energy (90Sr) and the low energy (204Tl) beta radiation sources by the MPV (for 90Sr = 74.2mV (+/- 6.3%), and for 204Tl = 96.6mV (+/- 6.5%)) and sigma values (90Sr σ = 26.99mV (+/- 15.4%), and from 204Tlσ = 40.84mV (+/- 9.7%)) of the fitted Landau distribution. The characteristics measured previously with the 3GEM confirm that the detector has optimum performance in applications where the energy distribution analysis is essential in terms of accuracy and precision of the application. We will work in further studies on increasing the drift zone Ed (for a higher energy loss dE/dx) as well as changing the gases mixture and pressure in order to strengthen the 3GEM performance in terms of beta source identification.

