


 Inglés (pdf)
 Articulo en XML
 Referencias del artículo
 Enviar articulo por email
 Citado por SciELO
  Citado por Google
  Similares en
SciELO
Similares en
SciELO  Similares en Google
 Permalink
1. Introduction
To understand the surface roughness, it is necessary to simplify the problem and avoid the rheology of the workpiece material to omit thermal phenomena, wear or vibrations that can affect the ideal path of the edges of the tool [1]. Several authors make representations of the roughness from the idealization of the geometric patterns that are generated by the effect of the trajectory of the cutting tool, however, the hardness of the material, its grain size and the thermal or acoustic effects during cutting prevent the formation of stable geometric shapes. Additionally, machine tool mismatches also include defects on machined surfaces [2].
Surface roughness is mostly a requirement on any product / process design. With this condition, it is possible to determine the quality and functionality of an element. The surface finish is determined by the magnitude of the deviations measured from a nominal surface [3,4]. Deviations are extensively studied in international standards (DIN4760). This work will not deal with fifth and sixth order deviations related to the structure of the material, mechanisms of physicochemical bonding of the surface or particle size.
The prediction of roughness has had several conceptual approaches whose variables are associated with the rheology of the material, the cutting kinematics and even the kinetic effects of the machining process [5].
Digital environments, in addition to allowing a simulated approximation of the kinematics of the process, can mold the surfaces resulting from the interaction of the cutting edges and the raw material. ISV (Integrated Simulation and Verification) techniques digitize the machine tool, its kinematics and the dynamic and geometric interactions of the cutting process [6].
Analytical approaches to the cutting process postulate roughness prediction as a design method, through the geometric deconstruction of the cutting tool. The simplification of the machining problem allows the formulation of process design solutions, reducing development times and minimizing risk during the execution of the cutting process [7].
The simplest and most effective way to simplify the roughness prediction problem is through the construction of elemental volume models MRSEV (Material Remove Shape Elemental Volume) [8]. It includes the generation of these volumes during the interaction between the cutting edge and the material [8]. It consolidates the conceptual primitives of surface roughness.
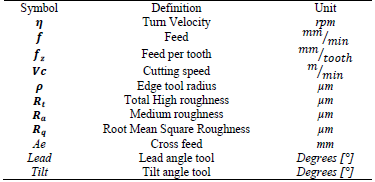
To direct the analysis in Table 1, the parameters that are discussed throughout this are classified.
2. Methodology
The influence of geometric parameters on surface roughness was determined by means of: (a) a 3 3 factorial DoE experimental development, in which roughness is measured using the confocal microscopy technique, (b) supported by an analytical and geometric model that allows approximation of roughness values and reinforced by (c) CAD / CAM computational models to validate the effectiveness of analytical models.
3. Experiment
A 3-factor factorial experiment with 3 levels is designed. The factors to be analyzed are the lead and tilt angles in combination with the transverse feed [9]. Variations in surface roughness are expected in response. The 3 3 experiment is used to determine possible optimum of the factors, to obtain minimum roughness.
Test specimens with flat faces of 5 mm x 5 mm with an excess of material of 0.3 mm are presented, the objective of this experiment is to validate the correlation between the experimental Simulation and Integrated Verification (ISV) setup the theoretical model analytical and roughness measurement on the machined surface.
For lead and tilt angles, the maximum and minimum levels are 5 ° and 15 ° respectively. The transverse feed Ae has a range between 0.05 mm and 0.1 mm. The experiment proposes a quadratic model without excluding effects.
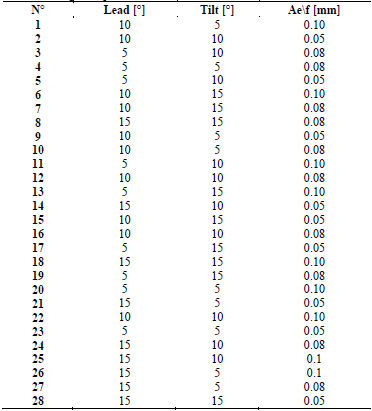
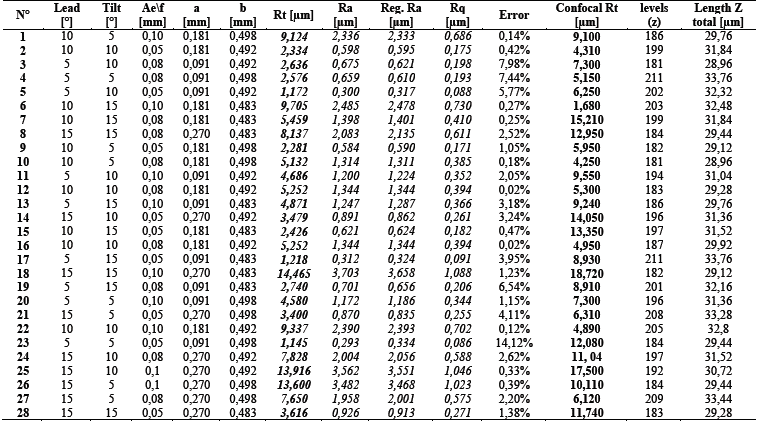
As a result, the 28 samples listed in Table 2 are presented. For this experiment, two central points are analyzed.
3.1. Analytical and geometric model for roughness prediction
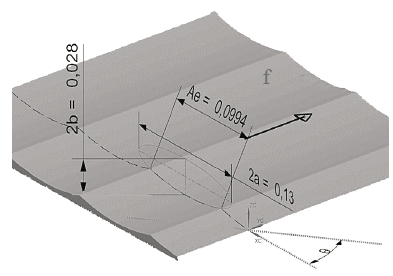
The combination of the height of the ridge, its separation and curvature in the valley allow to position an ellipse on the surface.
This allows estimating the roughness of the machined face by applying the following equations (Eq. 1, Eq. 2, Eq. 3) [10]:
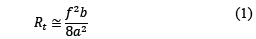
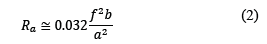
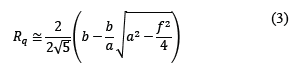
where:
a: Ellipse semi-major axis.
b: Semi-minor axis of ellipse.
f: Feed (Ae).
The ellipse is positioned by means of CAD tools to guarantee the veracity of parameters a and b. Fig. 1 shows the positioning of an ellipse on a point cloud segment generated by the ISV.
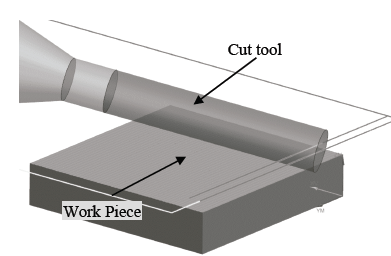
Using the Siemens CAD / CAM / CAE NX 11 tool, the generation of the IPW (In Process Work Piece) is configured so that the point density corresponds to 10 units in 1 μm3, in order to capture the trace of the micro tool on the work surface. Fig. 2 shows the generation of the point cloud as the trajectory validation is done.
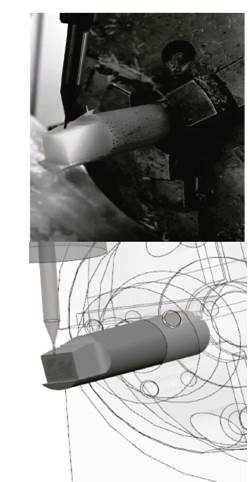
To reduce possible surface defects caused by the generation of incorrect CNC code, a digital model of the machine tool is generated for validation and simulation purposes of each assembly. Fig. 3a and 3b show the actual setting and the custom ISV, respectively.
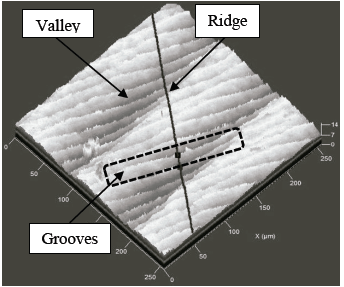
To analyze the resulting surface, the deviation gauge module is used. Through this module, the distances are determined between the generated points of the IPW and a reference plane. The reference plane in this case represents the ideal machined surface. Fig. 4 shows the generated surface in detail and it is dimensional analysis. It should be noted that this method allows determining only third order roughness.
Source: The Authors.
Figure 4 Resulting surface: (a) Surface generated in detail and (b) dimensional surface analysis.
3.2. Experimental development
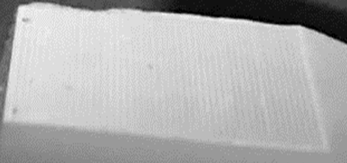
The 28 samples are machined in a Leadwell V20 machining center with fourth axis. The specimens are made of WaxPro machinable wax, which is a highly machinable material that allows omitting the effects of wear on the tool or defects on the machined surface. Fig. 5 shows the assembly experiments and the custom ISV developed to guarantee the stability of the tool paths.
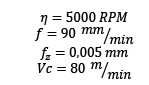
The applied cutting strategy takes advantage of the edges in contradiction and climb cut. The lead angle is controlled by the 4 axes, while the specimen design keeps the tilt angle constant by means of the inclined face to be machined. The constant cutting conditions for the 28 samples are given by:
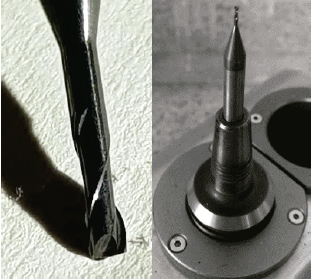
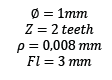
The tool used is a KENNAMETAL F2AH0100AWM30L150 SC micro square end mill of tungsten carbide with alumina coating, with the following features:
To ensure minimal runout, a thermal adjustment clamp ER32-∅6 mm h6 is used for holding the cutting tool. The ShrinkIN Unit V2 device shown in Fig. 5 is used to fix the tool.
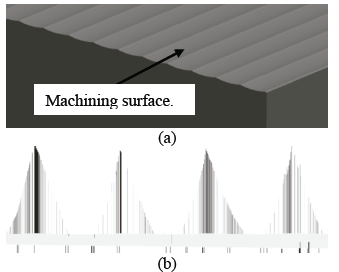
The runout of the tool adjusted in the cone was 1.3 μm, measured in a Zoller Venturion machine for presetting. Once all the samples were machined, it is possible to appreciate the characteristic of the grooves of third-order deviations, as shown in Fig. 6. These profiles are the main input for determining the influence of geometric and kinematic factors on the cutting process. Theoretical and experimental roughness values are determined by confocal microscopy and geometric reconstruction by CAD / CAM applications.
No coolant lubricating medium was used for cutting, only low-pressure air (20 PSI) was used to remove debris from the surface.
4. Discussion and Results
During the exploration of the samples, patterns carved on the surface with diagonal grooves are obtained at the feed of the tool (Fig. 7). This texture represents the footprint generated by the trochoid that describes each edge of the tool. The separation between these micro ridges coincides with the feed per tooth.
On the other hand, the lowest areas coincide with the tool path and their separation coincides with the corresponding transversal feed for each sample.
Measurements on the samples are performed using a Zeiss LSM 700 confocal microscopy, with a 100x lens, a laser intensity of 70% and 230 cuts in 20 µm.
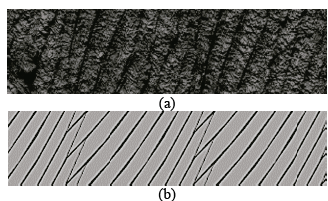
By analyzing the tool edge path and using CAD / CAM tools, the surface of the workpiece is reconstructed, the geometries of the surface are predicted, and the influence is outlined between the parameters selected in the experiment (Lead, Tilt, Ae). Fig. 8 shows the reconstruction of the ideal geometry of a machined surface compared with an image captured by the confocal microscope.
Source: The Authors.
Figure 8 Images of (a) confocal microscopy and (b) geometric reconstruction by removal of volumes of the cut cross-section.
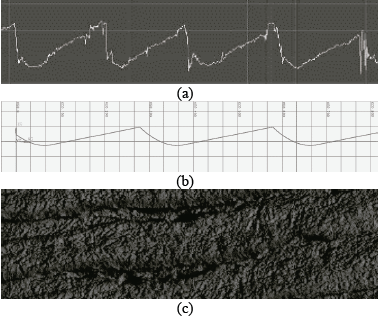
Results of the computational, experimental and theoretical analyses are reported in Table 3. This table contains the parameters for the 28 samples. Microscopies yielded geometric patterns consistent with those predicted by CAD / CAM models. Figs. 9a, 9b and 9c show the representative profiles of a sample with a representative lead angle. The left valley by the tool and the marked grooves of the feed per tooth are perceived.
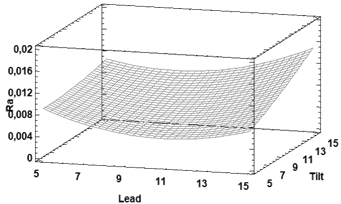
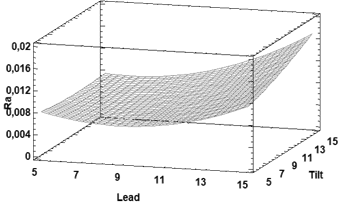
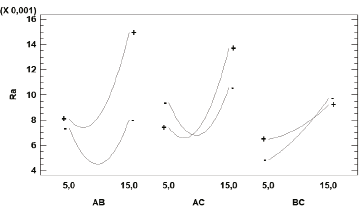
By means of data processing in the Statgraphics 18 ® software, the response surfaces with the optimum roughness are generated. Fig. 10 and Fig. 11 show the response surface with the influence of the lead and tilt angle and Ae parameter for maximum and minimum roughness.
Correlation factors are derived from the response surfaces and the regression formula is constructed with (Eq.7):
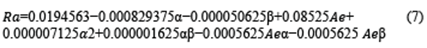
where:
α: Tilt angle.
β: Lead angle.
𝐴𝑒: Cross feed.
According to the response surfaces, an optimum roughness Ra is deduced when the lead angle is 10 °, the tilt angle is 5 ° and the transverse feed is Ae 0.06 mm.
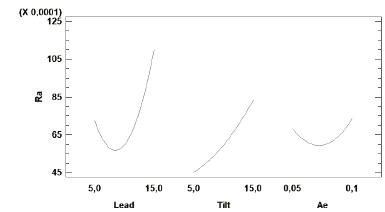
Fig. 12 show the main effects of the variables evaluated. It is worth noting that the tilt angle degrades the roughness as it increases.
During the design of the experiment, the interactions between the effects were considered. It should be noted that the transverse feed Ae is highly influential when combined with any tool angle of inclination. The experiment design considers the interactions between the 3 factors (Lead-A, Tilt-B, Ae-C), with a marked influence between the transverse feed and the angles of tool inclination. Regarding the interaction between lead and tilt, there is no correlation that significantly modifies roughness, as shown in Fig. 13.
On these the profiles generated by a tilt angle greater than 45 °, it is not feasible to position an ellipse with centered semi-axes, which means the analytical model loses validity.
When machining complex surfaces with flat-nose tools, interpolation of axes becomes essential. The simultaneous 4 + 1 and 5 axis configurations allow the control of the lead and tilt angles and, therefore, the variation of the undeformed cheap and the cutting edges incident on the cutting process. In this way, it is possible to keep a cutting pattern constant by generating cutting strategies that maintain the angles of inclination of the cutting tool with respect to the surface of the workpiece in pre-established ranges.
5. Conclusions
The geometric analysis by Material Remove Shape Elemental Volumes (MRSEV) allows approximations of third order and fourth order deviations from a geometric perspective. These analyses allow the validation of the undeformed chip for micro machining with flat tip tools under the surface finishing strategy.
By applying CAD/CAM simulation models, the roughness appreciation on machined surfaces enables the reliable evaluation of roughness and surface texture. The application of methods such as the one presented in this work can be extrapolated to work on free surfaces.
Combining simulation and experimentation techniques makes the experimentation exercise more assertive, thus reducing the expense of resources and bringing a closer conclusion in less time.
Additionally, to perceive the geometric relationship between the roughness and the cutting dynamics, it is necessary to eliminate all the factors that can deviate the tool edge path. An analysis on materials with high machinability properties is made to previously predict the texture of the machined surface.
Machining of complex surfaces with flat-nose tools is possible by considering the limits of the lead and tilt angles at which optimum roughness occurs. This analysis is functional in micro and meso machining.

