


 English (pdf)
 Article in xml format
 Article references
 Send this article by e-mail
 Cited by SciELO
  Cited by Google
  Similars in
SciELO
Similars in
SciELO  Similars in Google
 Permalink
1. Introduction
One of the main challenges today is the adaptation of Information and Communication Technologies (ICT) to different scenarios where the human being is involved. With the arrival of the digital age and the so-called fourth industrial revolution, technological openness has produced a series of changes in the personal and collective sphere, inducing society to put in place a series of solutions that respond to the complexities of this environment and the inclusion of new devices and elements. According to Mahou & Pérez, the growth of ICT will be evidenced in the number of devices connected to a network in the context of Internet of Things (IoT), which they estimate in 75,000 million devices in five years [1].
Similarly, the convergence of technologies to a common goal, such as digital transformation, has marked the beginning of the mission that frames the new century. This mission not only focuses on the creation of new devices, but also tries to find new ways of communication between them. This need for new ways of communication - such as wireless ones - has led different developers to intensify their search for improving communication protocols and benefit the digital age [2].
It is worth noting that the technological change, emerging from approximately three centuries ago with the first industrial revolution, has affected not only the industrial sector, understood as production factories, but also other socio-economic aspects, such as the agricultural sector. Throughout the last century, agricultural work has had a constant migration from traditional agriculture to mechanization, thus being an area transformed as technology evolves. For the agricultural sector, it is evident that technological changes have transformed and improved the productivity of rural labor [3]. Digital transformation is currently found in developments that focus on agricultural applications, including interconnectivity of sensor networks, actuator devices, central information servers, and application of methodologies such as precision agriculture. [4]. Among the different applications that can be found in the agricultural sector, there are smart farms with applications including WSN (Wireless Sensor Network) for monitoring and process automation to improve production, as in the case of [5-7]. Other applications can also be found, such as irrigation control [8-9], greenhouse monitoring [10-13] and crop variability management by precision agriculture [14-17].
Agricultural applications with technologies that manage large volumes of information may not represent a total benefit to the farmer, since their implementation requires an expensive infrastructure or has a monthly service cost, as in the case of traditional communications, fiber optics, network wiring, Wi-Fi, or satellite communications. For this reason, wireless communication technologies have been developed to get lower energy consumption and a greater range of coverage by sending small volumes of information. On the contrary, traditional wireless communications can carry a high volume of data, but have smaller radius of range, higher power consumption and higher associated costs. In this context, SigFox and LoRa (Long Rate) emerge as technologies that operate on ultra-bandwidth and spread spectrum, respectively, with lower energy consumption and the capacity to emit information over a wide radius (some km). These benefits that are in accordance with the needs of the IoT in agricultural applications [18]. Therefore, to establish a study of reliability of any of these technologies, this research begins with the following question: is it possible to establish a communication link between a receiver node and a transmitter node by using one of these technologies in a rural area and with the lowest possible error rate?
Consequently, in the next sections the evaluation results of one of the mentioned protocols (LoRa technology) in a rural area will be presented. First, with the question formulated, the different characteristics of the technology and the tests that are usually carried out to observe their behavior were identified by searching for related works. As a result, the scarce information on the evaluation of the protocol in rural areas was evidenced, which opens the possibility of research for the question formulated in the present article. Additionally, the identification of the LoRa technology was carried out with its main characteristics and needed equations (spreading factor, bandwidth, transmission times, coding rate). Then, the test system was designed to identify relevant parameters in field measurements. For the on-site tests of the protocol, a rural area was chosen between the municipalities of Sibaté and Granada in the department of Cundinamarca, Colombia. A measurement radius of 500 m was established given the extension of the El Porvenir farm and the signal access conditions from other communication technologies. Finally, the data obtained allowed deducing information about the efficiency and reliability of the protocol for its use in agricultural applications. Finally, the discussion of the results is presented and the main reflections of the article are outlined.
2. Related works
The reliability and efficiency of LoRa technology can only be determined through field tests, which can be divided into different aspects. On the one hand, there are possible applications for short distances (LoRa in RF), and on the other, for distances greater than 7 km where the LoRaWAN information gateway (wide area networks) is used. In this way, a series of studies found in different parts of the world is presented below to account for the scope of both the protocol and the evaluations carried out. Within the search, the tests carried out were discriminated, according to the application context, into tests for urban areas and tests for rural areas, in order to get relevant information from tests in rural areas that have already been documented, and thus apply some of their principles to this project.
The first document dates from 2016 and aims to establish the operating conditions of LoRa and LoRaWAN for sensor networks. Wixted, Kinnaird, Hadi and Ali [19] chose the Business Central District (BCD) in the city of Glasgow in Scotland, whose characteristics of the environment include concrete and glass buildings, as well as a suspension bridge of 50 meters high from a river. The implementation of the transmission elements was carried out using a central unit mounted on an Arduino board with receiver, which was located on the campus of the University of Caledonia in Glasgow, and a mobile unit consisting of a Raspberry Pi board, a GPS, a portable spectrum analyzer and the respective transmitter. The tests had 2 measurement distances: 1.9 km and 2.1 km from the University campus. The results obtained allowed concluding that the different obstacles typical of the environment implied loss of information with the protocol, of about 1% of the packages if the shipping times were approximately 10 seconds.
In another research, Ruano [20] carried out the evaluation of the LoRa protocol in the city of Grenoble, France in three possible scenarios: line of sight, interior of structures and urban environment. The evaluation was implemented by configuring different parameters that allow studying the efficiency of the protocol, such as the transmission channel, bandwidth, spreading factor, preamble information, and sending rate coding. In this project, three factors were evaluated: the RSSI (Received Signal Strength Indicator), the SNR (Signal-to-Noise Ratio) and the PER. A Mote LoRa was used that included a transceiver device from the company Semtech, whose purpose was to serve as a gateway for the transmission. The transmitter was located at three different distances from the receiver, as follows: 30 meters inside the same receiver building, 60 meters in line of sight (outside the building), and finally, a radius not greater than 4.08 km in the urban environment for preserving the greatest possible line of sight (minimum number of obstacles). It was concluded that a better performance of the signal-to-noise ratio was obtained with higher spreading factors, but that the implication was much higher package delivery times, which makes in turn energy consumption higher.
Another document that shows the reliability of the LoRa protocol was developed at the Graz University of Technology in Austria, to get the efficiency of the physical layer for wireless communications. Cattani, Boano and Römer [18] aimed to get samples by locating the transmission and reception devices within the university campus in three possible scenarios: indoor with obstacles, outdoors in line of sight and finally underground in a well whose walls are metallic. The tests consisted in sending 5-bytes packages every three seconds to emulate the usual behavior of the devices used in IoT. Every 6 minutes, the transmitting and receiving devices automatically changed their parameters to send packages with other characteristics of the protocol, repeating this process for a period of 24 hours and resulting in 1600 packages sent per configuration before each change. Finally, they found that the loss of packages and corrupt information is due to the decrease in the signal and its associated energy (RSSI), so it is possible that changing some parameters, such as the spreading factor, affects the power of the energy transmitted when the distance between the transmitter and the receiver is greater.
Another research that evaluates this protocol in urban settings is presented by Pérez [21], who studied LoRa for an application in smart cities in his graduate work. Coverage tests of the LoRaWAN gateway were implemented, with a hub located on the campus of the Polytechnic University of Catalonia, Spain, and the receivers in the urban area of the city. Different evaluations were carried out with changes in the transmission power, spreading factor and bandwidth parameters, to optimize the transmission in terms of energy consumption. The hub was implemented using the Raspberry Pi board, and the transceivers from the manufacturer Semtech. Finally, the author concludes that LoRa technology has broad advantages over other competitors in terms of coverage range, amount of information sent per packet, and low energy consumption with respect to coverage distance.
Lastly, two researches were found in Latin America, at the Francisco José de Caldas District University in the city of Bogotá, Colombia and at the Federal University of Parana in Brazil. Firstly, Triana and Rodriguez [22] in Colombia developed a prototype for agriculture to monitor the crops, implementing the LoRa protocol for communication. Secondly, Bonaldi and Peroni [23] in Brazil carried out the design of the communication between field sensors to evaluate the performance for IoT and machine-machine (M2M) connections, to conclude with some results that allow us to infer that the protocol can be used in precision agriculture.
Thus, although these two researches are not explicitly focused on evaluation, it is important to emphasize their importance, since not much concurrence has been found in projects related to LoRa technology and its evaluation in rural areas. For this reason, these authors have realized that it is possible to implement this technology in the agricultural sector, but protocol evaluation information is needed for rural areas where there are no communication protocols, or access to traditional communications is not possible. Both documents allow infering that the use of protocols such as LoRa together with technologies such as IoT allow minimizing the technological gap that currently exists in the rural areas and, specifically, in Latin America.
3. Materials and methods
3.1. Methodology
To carry out the evaluation of LoRa technology in rural areas, an exploratory research was performed, which allowed determining the variables or factors that may influence the viability of using this technology. Since it is a recent topic, it is low studied or not much information is known. This search had the objective of acquiring relevant characteristics of the LoRa technology, which would determine the end of the research [24]. Three repetitions (one per day) were performed with the same set and variation of characteristics. The tests were carried out on October 7, 8 and 9 at 2019 in the time slot from 9 a.m. to 12 p.m., obtaining enough samples to determine their viability in terms of reliability, data transmission and loss of information.
3.2. Parameter computation of LoRa technology
LoRa technology is an alternative application to traditional wireless communications in wide area networks. It stands out for its low power consumption and is part of LPWAN (Low-Power Wide-Area Network) [25]. This communication has two differentiated layers: the physical layer defined by transmission modulation and the MAC layer involving the LoRaWAN protocol [26]. The modulation uses the spread spectrum, whose operating characteristics are based on the Chirp modulation by Spread Spectrum (CSS) technique. Thus, the information found in [14-16] was used for determining the values for the evaluation of the technology and establishing suitable parameters of measurement and transmission. One of the main characteristics is the spreading factor (SF) that defines the number of parts into which each symbol sent is divided, and in turn establishes the possible amount of data transmitted in each packet, besides allowing different values of channel capacity [30].
The number of parts into which each symbol is divided is defined in eq. (1):
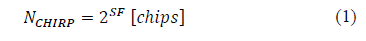
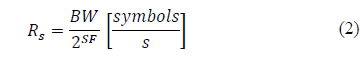
taking SF values from 7 to 12 [27]. Likewise, the rate of sending symbols R S is established in eq. (2),
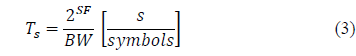
and the symbol time T S in eq. (3)
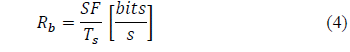
The parameters associated with eq. (2)-(3) allow defining the sending ratio in capacity of packet size R b , as shown in eq. (4) [27].
The LoRa modulation also includes another parameter for possible variations in error correction at the sending of symbols. This parameter provides greater robustness in sending the signal, thus mitigating some adverse effects in the loss of information. This correction factor is called the coding ratio (CR), whose values are defined in eq. (5)
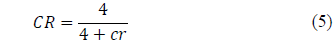
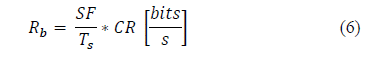
where cr takes values between 1 and 4. This correction factor, when included in the communication protocol, affects the ratio of bits per second, resulting in eq. (6) [27].
About communication channels, LoRa technology uses the ISM free band in three different bands: 437 MHz at Asia, 868 MHz at Europe, and 915MHz at America. The restrictions given by the ISM band legislation that regulates the ways of sending signals through these communication channels must be taken into consideration. According to Loy, Karingattil and Williams [28], it is necessary to perform wait in transmission between data packages, to avoid occupying and saturating the transmission bands. For this reason, it is proposed that these times are not less than 90% of the useful cycle of the signal sent. This implies that the signal cannot last more than a certain time in the air to find the optimal waiting and sending time, so eq. (7) proposes the following expression:
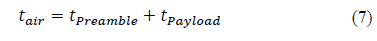
In eq. (7), t Preamble is defined as the time associated with sending the LoRa packet header and configuration, while t Payloadis the time required to transmit the data, where Payload is the data measured in bytes [29]. To determine the t Preamble , eq. (8) is used.
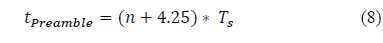
In eq. (8), n is the number of symbols in the preamble, which has the value of 8 by default, and T s is the time it takes for each symbol to be transmitted. The value of t Payload is defined in eq. (9).
In eq. (9), N PL is the number of symbols of the sent payload, and this value is computed by eq. (10).
In eq. (10), the values are:
PL = Size in bytes of the sent data (for LoRaWAN, 13 additional bytes must be added).
SF = Signal spreading factor.
H = Header value. 0 if not included, and 1 if included.
DE = Data optimization ratio. It is 0 by default.
cr = Coding rate.
To determine the waiting time between packages sent, the airtime of this data must be related to the useful cycle of the signal, therefore, eq. (11) calculates the signal downtime.
From this equation the value D.C is the useful cycle of the signal in propagation. With eq. (11), it is possible to get the different times associated with shipping and waiting, to avoid values out of those regulated for ISM free bands, and not allowing waiting times (t off ) that are less than 90% in order to avoid infringing the regulations [ 28].
3.3 Materials and hardware
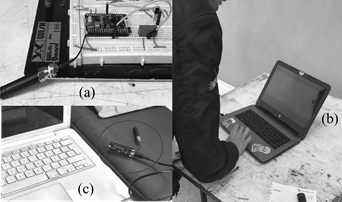
To elaborate the measurement system, the necessary technical information was collected to choose the hardware elements that allowed carrying out the tests in situ in a rural area. Consequently, a research was made of different open-source boards that included the LoRa modulation chip within their peripherals. As a result, the TTGO esp32 development board was chosen that contains a SX1276 module from the manufacturer Semtech, whose benefits are suitable for evaluation. This board has the additional feature that it can be programmed in a simple way through the Arduino Integrated Development Environment (IDE), thus allowing easy code implementation. A LM35 temperature sensor and a potentiometer (voltage measurements) are connected to it to get real-time measurements, whose assembly was carried out on a breadboard, as shown in Fig. 1a.
Source: The authors.
Figure 1 Implementation of the test system: (a) transmitter node with TTGO esp32 board with lm35 temperature sensor and potentiometer on breadboard; (b) Computer that obtains the data from the transmitting node in real time; (c) receiving node, the TTGO esp32 board that receives the data packages is located in the circle, next to the computer that allows the display of the data at reception.
The transmitter node is the one observed in Fig. 1a. Data from the sensor and potentiometer are obtained by the TTGO esp32 board through a computer on the serial monitor that the Arduino IDE provides for its real-time display (Fig. 1b). These data are sent through the LoRa protocol to the receiving node, which was also connected to a computer and allowed to obtain the analysis data of the reception of packages, which was also displayed in the serial monitor of the Arduino IDE (Fig. 1c).
3.4 Data collection and on-site testing
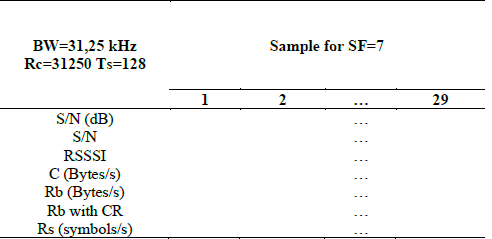
With the selection of hardware elements to be used in the evaluation, the configuration parameters were established in the LoRa protocol programming. A total of 29 combinations were performed between bandwidth and SF in order to fill in the data obtained. The information obtained was discriminated and used for filling Tables 1-3.
Table 1 Capacity data, transmission rates, rejection rates and delivered power ratio.
Source: The authors.
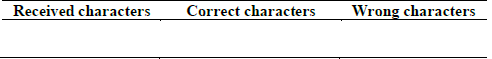
Table 2 Correct and wrong characters in packages received at the receiver. One table for each measurement.
Source: The authors.

The 29 combinations were differentiated by the 5 selected bandwidths (31.25 kHz, 41.7 kHz, 62.5 kHZ, 125 kHZ, 250kHz) and the 6 spreading factors (SF = 7, 8, 9, 10, 11 and 12). These combinations were randomly distributed according to shipping and waiting times between samples, thus obtaining an average of 15 packages per combination. However, some combinations only obtained 6 samples, while others got 50 samples due to the associated times.
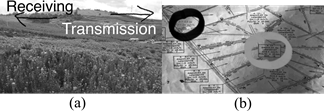
The next step was choosing the location of the tests. So, taking into account the focus of this evaluation, El Porvenir farm (Fig. 2a) was chosen in the rural area between the municipalities of Sibaté and Granada in the department of Cundinamarca, Colombia, whose characteristics allow testing in the open field. This area is characterized by a high production of Proteas crop and by the absence of access to wireless and wired networks. These factors are relevant to the purpose of the tests, since they seek to determine the reliability of the protocol in rural areas, and those places with no easy access to ICT. Data collection was performed at a distance of 500 meters between the receiving and transmitting nodes. The nodes locations are detailed in Fig. 2b, where the clearest circle corresponds to the point of the transmitting node located in the cut-off room of the farm, and the darkest circle corresponds to the receiving node located in the machine room.
To determine the loss of packets and characters in each transmission, the original data string of the transmitting node was validated with the data string obtained in the receiving node to show whether the transmission was successful or not.
Source: The authors.
Figure 2 Farm "El Porvenir", Cundinamarca, Colombia: (a) indication of the reception and transmission nodes in frontal view of the extension of the farm; (b) location of the evaluation nodes at the farm plan, where the clearest circle is the transmitting node and the darkest circle, the receiving node.
4. Results and discussion
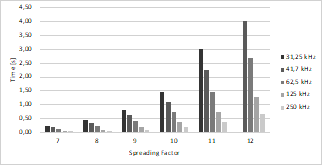
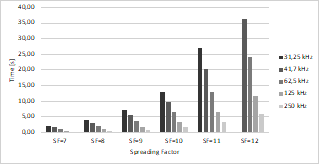
The first relevant element to determine the number of measurements was the time associated with sending and waiting for information packages. In accordance with Eq. (7) and Eq. (11), packet transmission and waiting times were related in Table 3, and their values were included in the programming of the data sending algorithm. These values are detailed in Fig. 3 and 4 with the transmission time (airtime) and the no-send time (off time). In both figures, the information was discriminated per bandwidth, and in each group the associated spreading factor (SF) was identified, resulting in a total of 29 airtimes and 29 off times.
In Fig. 3 and 4, it is evident that the SF, whose magnitude is 12, induces transmission times and waits outside the expected (times too high), thus achieving a t air =4s and t off =36s a in the case of a 250 kHz bandwidth. It is necessary to clarify that in the case of SF = 12, no measurements were made in the lowest bandwidth (31.25 kHz). The optimal relation must be obtained for sending and waiting time in the 250 kHz bandwidth and in the spreading factor SF = 7. An associated maximum time is given by t air +t Off =1s, which is a considerably brief time that would allow to send a large number of packages. However, the regulations established in the regulatory commissions [28] for sending this information must be considered.
Source: The authors.
Figure 4 Waiting time for sending a new packet discriminated per bandwidth and SF.
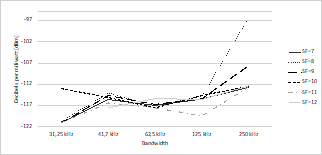
Another relevant factor in the measurements of data transmission through antennas is the value of the signal intensity that is dissipated by it. This factor called RSSI gives the power ratio of the input and output signal (from the antenna) in terms of decibels per milliwatt (dBm), as the signals transmitted and received by the LoRa technology are expressed in milliwatt (for its low power consumption). Fig. 5 shows the results obtained in the weighting of the RSSI, completed using Table 1 and whose values were divided per bandwidth and per SF.
Source: The authors.
Figure 5 Power indicator of the received signal discriminated per bandwidth and SF.
According to Fig. 5, the power received at the receiving node remained more stable during bandwidth changes in two cases, SF = 9 and SF = 10. The bandwidth that provides the highest RSSI in each SF is located at 250 kHz, and the bandwidth where the same proportion is maintained between the different SF is at 62.5 kHz. The measured RSSI values are consistent with other authors in their tests, as in the case of the work by Pérez [21] where an RSSI of -129 dBm was determined for a distance of 500 m. Likewise, Wixted et al. [19] evidenced achieving an RSSI in the range of -100 dBm and -120 dBm in a radius not exceeding 2.2 km.
Another of the measurements obtained using the programming algorithm was the SNR ratio, which was obtained in units of decibels (dB). It is an indicator of the signal ability to send information with the least possible noise. The data were obtained by means of Table 1, whose information was filled out per bandwidth and individually for each SF. As the combinations between bandwidth and SF had several samples, it was necessary to determine the antilogarithm of the obtained values and to average these values, in order to finally find the relationship in dB. Fig. 6 was obtained from these computations.
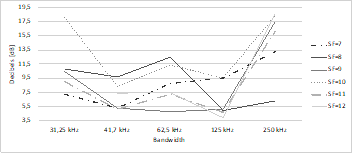
Fig. 6 shows that the SF that generates the least variation in the change in bandwidth is SF = 9, thus maintaining a trend line without abrupt variations between 41.7 kHz and 125 kHz. Likewise, the SNR values that show the greatest variations in the complete bandwidth set are SF = 8 and SF = 10. Finally, it is not possible to display a bandwidth that maintains a small variation between the different SF ratios, but the behavior with the smallest change gap between their SF is the 41.7 kHz bandwidth. In the tests by Triana & Rodríguez [22], SNR values between 6 dB and -92 dB were obtained, while the research carried out by Pérez [21] showed a value of -13 dB of SNR, which is very far from the value observed by Triana & Rodríguez and the results shown in Figure 6. In the case of the tests by Ruano [20], the average SNR values are above 10 dB, which allows establishing that the distance and the place of measurements have a direct implication in the reduction of noise of the transmitted signal. In this case, measurements were obtained in the same building and on different floors, whereas in the other two studies measurements were made in the urban environment, outside a building and with obstacles present. According to Ruano, the measurement had no obstacles, since it is in the open field, thus the SNR values detailed in Fig. 6 are more similar to those presented in [20].
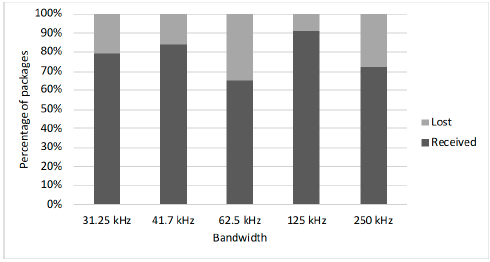
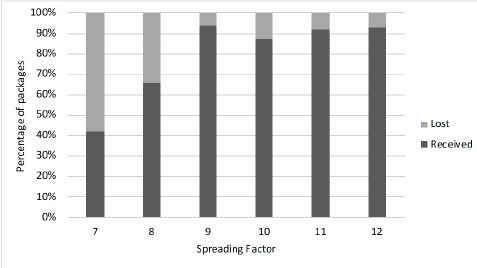
For the information that arrived to the receiving node, the probability was established first for the number of packages sent that were received and those that were lost in the transmission. These values were computed and plotted in Fig. 7, which presents the number of packages received and lost per bandwidth. Likewise, Fig. 8 shows the probabilities discriminated per SF.
Source: The authors.
Figure 7 Probability of received and lost packages discriminated per bandwidth.
Fig. 7 allows determining that the highest amount of received packages was obtained in the 125 kHz bandwidth with a 91% success rate of reception. A successful reception of 84% was obtained in 41.7 kHz, 79% in 31.25 kHz and 72% in 250 kHz. Finally, it was found that the reception success decreased to 62% at 62.5 kHz.
In Fig. 8, more significant differences were found between SF values. The reception success trend can be observed in the values from SF = 9 to SF = 12, with success probabilities of 94% for SF = 9, 87% for SF = 10, 92% for SF = 11 and 93% for SF = 12. The other SF values have a very low reception success capacity, with 42% success for SF = 7 and 66% for SF = 8.
These values allowed establishing that the higher the package delivery time and the waiting time, the greater the probability of success is for receiving the packages at the receiving node. At the same time, this implies that there must be a higher consumption of energy when it takes more time for sending the information (time varies between 1 and 4 seconds, see Fig. 3).
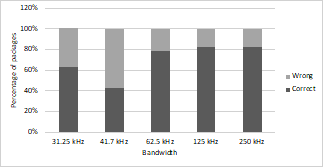
The probabilities determined in Fig. 7 and 8 are not sufficient to determine the transmission capacity of the different bandwidths and the SF. Therefore, the number of packages received had to be counted additionally, but they came with the correct information. For this purpose, Table 2 was filled: the packages received successfully were discriminated between packages with correct and erroneous characters. For probability purposes, it was determined that a received packet arriving with at least one wrong character was considered as a wrong packet, since for any real process it is important that the information arrives with all the correct data for subsequent decision making. With these considerations, Fig. 9 and 10 were obtained.
Fig. 9 evidenced that there is a trend of correctly received packages between the bandwidth of 62.5 kHz and 250 kHz, with a probability of success of 79% for 62.5 kHz, 82% for 125 kHz and 82% for 250 kHz. For the other bandwidths, a low reception of correct packages was found with 63% success for 31.25 kHz and 42% success for 41.7 kHz. Fig. 10 shows the discrimination per SF, noting that on this occasion the trend is no longer so evident. The highest success of packages received was at SF = 9 with 95%, followed by SF = 10 with 83%. The other SF values maintain a probability of success below 80% and very close to 70%, which is considered a low reception rate. For SF = 7, there was a 65% success, for SF = 8 it was 73%, for SF = 11 it was 72% and finally for SF = 12 it was 71%.
Source: The authors.
Figure 9 Probability of correct and wrong packages discriminated per bandwidth.
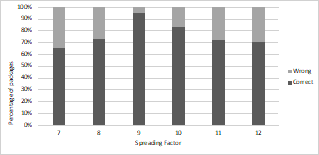
Among the different authors consulted, the work by Pérez [21] carried out coverage tests at 5 different distances with and without obstacles. The author determined that approximately 96% of the packages are delivered in distances of less than 1.3 km, but without distinguishing which SF and bandwidth were used. The research by Cattani et al. [18] indicated that in various tests within the same building with a distance of 100 m between the receiving node and the transmitter, the percentage of correct packages reception is 95% at SF = 9 and 125 kHz bandwidth. This study reflects a similarity to the results presented in Fig. 9 and 10, thus evidencing that with a SF = 9, the percentage of correct reception is 94% and in the 125 kHz bandwidth it is 82%, which are the most suitable values for sending packages.
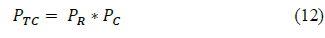
Lastly, to finish the data reception analysis, it was necessary to establish a conditional probability to determine in a real way the parameters with the best performance in the on-site tests. For this purpose, eq. (12) and (13) were used for establishing the joint probability of both correct and wrong packages. The wrong packages include the packages not received.
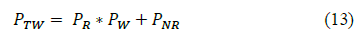
In eq. (12)-(13), the values are:
P TC = Joint probability of total packages received correctly.
P TW = Joint probability of total packages received wrongly plus unreceived packages.
P R = Probability of total packages received.
P C = Probability of correct packages received.
P W = Probability of wrongly packages received.
P NR = Probability of unreceived packages.
Fig. 11 reports the joint probability of packages received correctly and wrong or lost packages differentiated per bandwidth. It was observed that the bandwidth with the best performance was 125 kHz, which is similar to the one used in the aforementioned works. This bandwidth obtained a performance of 74.62% success in sending. Over 250 kHz, only 59.4% of success was achieved, while in 62.5 kHz, only 51.35% was reached. The remaining two bandwidths are below 50%, so they should not be considered as an option for transmission in future applications.
Source: The authors.
Figure 11 Joint probability discriminated per bandwidth of correct and wrong packages or that did not arrive.
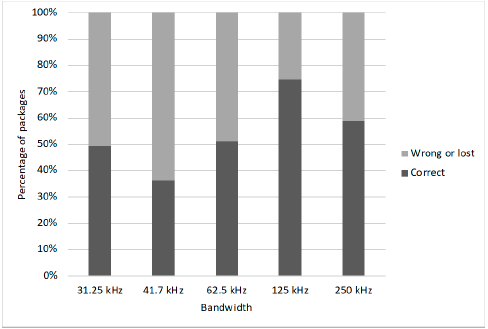
In Figure 12, the discrimination of the probabilities was performed per SF, resulting that the best parameter is SF = 9 with a success of receiving correct packages of 89.3%. The next closest parameters were SF = 10 with 72.21%, SF = 11 with 66.24% and SF = 12 with 66.03%. The values of SF = 8 and SF = 7 are below 50%, thus they are not considered suitable parameters for transmission.
Finally, through the aforementioned analyses, tables and plots obtained, it was possible to determine that the best transmission in terms of correct reception of packages with all their complete information can be achieved in the 125 kHz bandwidth with a SF = 9. The results obtained by these parameters are consistent throughout the analysis and had low delivery times (0.2 seconds in air and 1.85 seconds of waiting), as well as a consistent trend in the plots of signal strength indicators (RSSI) and SNR ratio (signal-to-noise). This last analysis was not found in the referenced documents and constitutes an additional contribution, so that other works that require IoT developments with LoRa technology in agricultural applications can differentiate the most suitable parameters to send data for monitoring in rural areas, as in the case of this research.
5. Conclusions
Through field tests in the rural sector between the municipalities of Sibaté and Granada, Colombia, it was possible to establish the performance of the LoRa technology and its communication protocol within a radius no greater than 500 meters. This allowed finding the possibility of transmission of small packages of information (not exceeding 256 bytes) through direct communication from machine to machine (M2M). The capacity for applications in rural areas, in terms of obtaining information, transmission for analysis and decision-making makes LoRa technology an optimal candidate for implementation in areas with difficult access and without the possibility of connecting to traditional networks or the economic capacity to obtain technologies with higher associated costs.
The easiness of implementation of the LoRa technology (both in terms of programming and hardware) makes the associated costs lower, by implementing open source hardware and software technologies, which include the sensors, development boards and programs used. These results in the opening of the technology to rural areas could allow greater access to ICTs.
Finally, it is important to emphasize the importance of making further developments in technology applied to rural areas in Latin America in order to provide better solutions to the field and open up technology to rural areas and to farmers. It is necessary to bring rural areas closer to technological advances that are affordable and practical. As evidenced in the state of the art, research on this field in Colombia has been limited and superficial. Consequently, rural areas have not been able to make optimal use of wireless network technologies, specifically of those with a low associated cost.

