


 Inglês (pdf)
 Artigo em XML
 Referências do artigo
 Enviar este artigo por email
 Citado por SciELO
  Citado por Google
  Similares em
SciELO
Similares em
SciELO  Similares em Google
 Permalink
1. Introduction
Electrical quantities are quite important in modern life; energy production and distribution, air and terrestrial transport industry, manufacturing processes, the military industry, research and academy, amongst others, require high accuracy electrical measurements. The National Institute of Metrology of Colombia (INM) is in charge of industrial and scientific metrology within the country, and is responsible for the safekeeping and maintenance of measurement standards for physical quantities [1].
Standards for electrical quantities went from electro-chemical devices in the early twenties to quantum experiments in the past decades. In 1988, the CIPM (International Committee for Weights and Measures) set exact values for the Josephson and Von Klitzing constants (used for establishing the Josephson Effect and Quantum Hall Effect as primary standards -quantum standards- for DC voltage and DC resistance, respectively) and recommended laboratories to base their standards on these values with their associated uncertainties from January the 1st, 1990 [2]. These standards are extremely accurate (with relative uncertainties of about 0.001 µV/V [3] for DC voltage and 0.0001 µΩ/Ω for DC resistance [4]), repeatable and internationally available [5]. Electrical quantum standards and the experimental progress in determining the fundamental constants [6] has played an important role in the new SI revision [7].
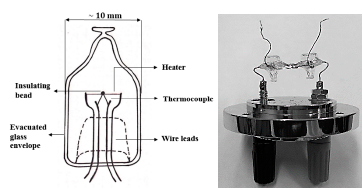
The Ampere is the base unit of electric current and can be derived from the Josephson and Quantum Hall Effects (through the Ohm’s ratio between current, resistance and Voltage) for DC values, but not for AC. Currently, the link between AC electric quantities and the SI units are AC-DC Transfer Standards [8]. These standards are based on thermal converters (TC) that can have either a single junction (SJTC) or multiple junctions (MJTC). A SJTC consist of a heater element with a thermocouple attached to its mid-point by a small electric insulating bead, placed within a vacuum glass as it is shown in Fig. 1.
Source: The Authors
Figure 1 Schematic of a Single Junction Thermal Converter (based on [8]) and picture of two SJTC in series taken from INM AC-DC current transfer standard.
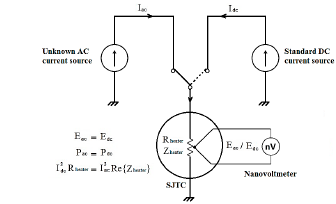
The operational principle of transfer standards is based on thermal effects; when a known (standard) DC current flows through the heater, energy is dissipated in the form of heat and the thermocouple measures the temperature as a DC voltage output. Then, an unknown AC current is applied and the DC voltage response of the thermocouple is also measured as shown in Fig. 2. If the RMS (Root Mean Square) value of the applied signals is the same, the same power is expected to be dissipated on the heater and also the same thermocouple voltage response. However, SJTC are affected by thermoelectric effects such as Peltier and Thomson heating [9], that causes a deviation from the ideal behavior known as the AC-DC transfer difference of the thermal converter.
The combination of a SJTC and a current shunt is known as a Thermal Current Converter (TCC), and it can be used to calibrate high accuracy instruments, such as calibrators and 8.5 digit multimeters.
Currently at INM, AC current is disseminated through high accuracy Calibrators -such as Fluke 5720A and 5730A- for currents up to 2 A and a Transconductance Amplifier -Clarke Hess 8100- for currents between 2 A and 20 A. A transconductance amplifier is a device capable of delivering a current proportional to the input voltage. High accuracy instruments in the range from 5 mA to 20 A [10] require calibration methods that can provide better uncertainties. The AC current calibration of those instruments requires the implementation of calibration procedures based on AC-DC current transfer standards.
This research work describes the calibration procedure developed by INM based on TCC with SJTC donated by PTB (Physikalisch-Technische Bundesanstalt, National Metrology Institute of Germany). These TCC have AC-DC current transfer differences from 2 µA/A to 27 µA/A with uncertainties from 30 µA/A to 120 µA/A, according to measurement results from CENAM. The procedure described in this work allows the AC current calibration of calibrators from 5 mA to 2 A (40 Hz to 5 kHz) with uncertainties from 68 µA/A to 151 µA/A, and the calibration of transconductance amplifiers from 2 A to 20 A (at 40 Hz to 5 kHz) with uncertainties from 0.49 mA/A to 2.6 mA/A. The calibration procedure also applies for other AC current sources that require better uncertainties than the ones obtained from a direct measurement with a standard multimeter.
2. Materials and methods
This study shows the implementation of two calibration setups using SJTC as thermal transfer standards for the calibration of high accuracy calibrators and transconductance amplifiers. The calibration scope is 5 mA - 20 A (from 40 Hz to 5 kHz).
Environmental conditions are controlled in the laboratory to guarantee calibration results. Temperature and relative humidity are controlled to 23°C ± 1°C and 45% ± 15% respectively. Atmospheric pressure is measured with variations within 752 hPa ± 5 hPa. Temperature and relative humidity were measured using the Thermo-Hygrometer Fluke 1620A and atmospheric pressure was measured by the GE Druck DPI 142 Barometric Indicator.
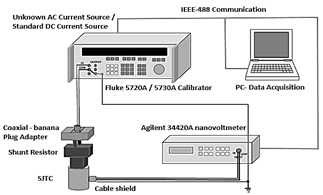
2.1 Calibration setup of high accuracy calibrators
As shown in Fig. 3, this setup is composed of the instrument under calibration (IUC), a standard DC current source (calibrators Fluke 5720A / 5730A), the set SJTC-Shunt as the AC-DC current transfer standard (from 5 mA to 2 A), and a nanovoltmeter (Agilent 34420A) as a standard to measure the SJTC output voltage.
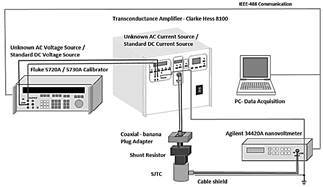
2.2 Calibration setup of Transconductance Amplifiers (TA)
This setup, presented in Fig. 4, is composed of the IUC, a DC current source standard, the transconductance amplifier Clarke Hess 8100, the set of SJTC-Shunt resistor as the AC-DC current transfer standard (from 2 A to 20 A) and a nanovoltmeter (Agilent 34420A) as a standard to measure the SJTC output voltage.
Source: The Authors
Figure 4 Calibration setup for high accuracy alternating current sources between 2 A to 20 A.
It is important to note that for both calibration setups, the instrument under calibration in its AC current function was used as a standard in its DC current function; the DC current standard should have better specifications than the unknown AC current source.
2.3 Measurement process
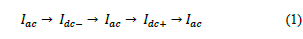
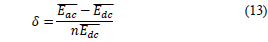
All the equipment was warmed up according to the user’s manual recommendations. Setups shown in Fig. 3 and Fig. 4 were carried out to calculate the AC-DC current transfer difference (δ) of the measurement system δ is calculated from the output voltage of the SJTC according to the sequence current applied as presented in eq. (1); where I ac1 =I ac2 =I ac3 is the unknown AC current and I dc- and I dc+ are the negative and positive reference DC currents applied, equivalent to the RMS value of the unknown AC current. Each current is applied for 60 s and then the SJTC voltage response is registered.
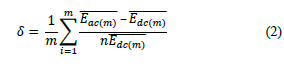
The AC-DC current transfer difference -as a deviation from the ideal response of the SJTC- is shown in eq. (2); where
 are the average SJTC output voltages for the applied AC and DC currents from eq. (1), where n is the thermal transfer index -a parameter from the model of the output voltage of a TC as presented in eq. (14) - and m is the number of measurements.
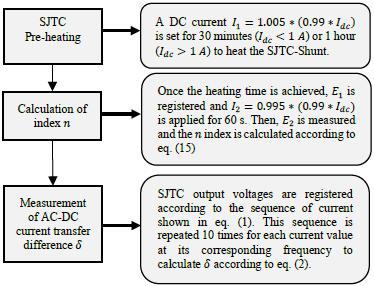
The measurement process is presented in Fig. 5; where I dc is the nominal current applied, E 1 and E 2 are the SJTC output voltages measured to calculate the ηindex. A LabVIEW application was developed to automate this measurement process. This application performs the configuration of the instruments, saves calibration data in a specified folder and displays a real time graph of the SJTC voltage response. A different application was used to register environmental conditions.
2.4 Measurement model
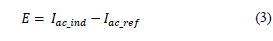
According to the International Vocabulary of Metrology [11], a measurement model is a mathematical relation amongst all quantities known to be involved in a measurement. In this research work, the measurement model is defined in eq. (3); where the error E is the measurand -quantity intended to be measured-,I ac_ind is the value displayed by the high accuracy AC current source and I ac_ref is the reference AC current.
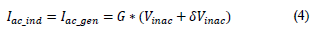
A transconductance amplifier’s output current is defined as the product of an input voltage V inac and the amplifier’s transconductance (G), as shown in eq. (4). The input voltage value should be corrected accordingly to its calibration certificate (δVinac).
Eq. (5) is used to determine Iac_ref by using a standard DC current source and current thermal transfer standards. δ is the measured AC-DC current transfer difference and δcert is the difference reported in the calibration certificate.

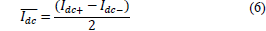
 is the standard DC current calculated as an average between the positive and negative corrected DC currents (Idc+ and Idc-)as shown in eq. (6), these values are derived from the nominal applied DC current Idc with their respective errors E
idc+
and E
idc-
as shown in eq. (7) and eq. (8).
is the standard DC current calculated as an average between the positive and negative corrected DC currents (Idc+ and Idc-)as shown in eq. (6), these values are derived from the nominal applied DC current Idc with their respective errors E
idc+
and E
idc-
as shown in eq. (7) and eq. (8).


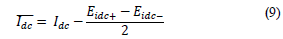
Replacing eq. (7) and eq. (8) in eq. (6) leads to a simplified expression for
 as shown in eq. (9).
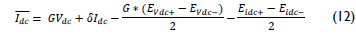
When the standard DC current is set by a transconductance amplifier, Idc+ and Idc- are defined in terms of the amplifier’s transconductance G and the standard DC input voltage V dc as shown in eq. (10) and eq. (11). E Vdc+ and E Vdc- are the reported errors of the standard voltage source for positive and negative values respectively.


Replacing eq. (10) and eq. (11) in eq. (6) leads to a simplified expression as shown in eq. (12); where δIdc represents the uncertainty due to the specifications of the standard DC current source and is included just for the uncertainty analysis.
In eq. (13), δ is defined in terms of
 and
and
 that are the SJTC average output voltages for each current applied from the sequence presented in eq. (1).
 and
and
 are corrected accordingly to the calibration certificate of the nanovoltmeter.
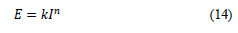
The thermal transfer index n comes from the TC thermocouple output voltage model as shown in eq. (14), k is a constant that depends on each TC and I is the applied current; the theoretical value of n due to Joule heat [12] is 2.
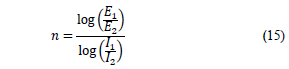
Clearing n from eq. (14) leads to the expression in eq. (15); (18) E1 and E2 are the SJTC voltage response to the input currents I 1 and I 2 (as defined in Fig. 5).
When a transconductance amplifier is the standard DC current source, I 1 and I 2 are defined as shown in eq. (16) and eq. (17). In this case, V 1 and V 2 are the corrected standard voltages applied to the amplifier to generate I 1 and I 2 δI1 and δI2 are the DC current correction for I 1 and I 2


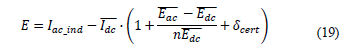
Finally, the measurement model is defined in the general form in eq. (18) and eq. (19).

2.5 Uncertainty estimation
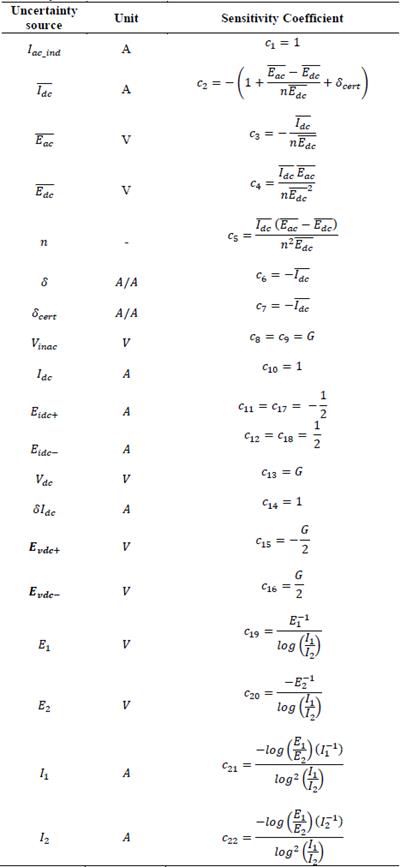
The uncertainty budget is estimated accordingly to the Guide to the Expression of Uncertainty in Measurement - GUM [13]. The combined standard uncertainty of the error in the AC current source is defined in eq. (20) and their corresponding sensitivity coefficients are presented in Table 1.
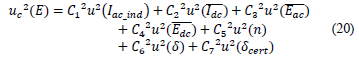
Table 1 Uncertainty sources of the measurement model and their corresponding sensitivity coefficients.
Source: The Authors.
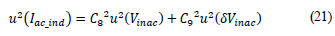
The standard uncertainty due to I ac_ind is in general zero as it corresponds to the setting value of the device under calibration. However, when a transconductance amplifier is used, other variables play an important role as presented in eq. (4) and the uncertainty for the reference voltage source should be considered as presented in eq. (21). u(δ) is the Type A uncertainty and u(δ _cert ) is the uncertainty due to traceability where cert stands for calibration certificate.
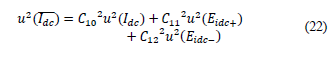
The uncertainty associated with the standard DC current
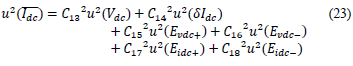
 is presented in eq. (22) for the calibration of high accuracy calibrators, and in eq. (23) for transconductance amplifiers. This uncertainty estimation is based on the models presented in eq. (9) and eq. (12).
 in eq. (23) is the uncertainty due to the amplifier specification in DC current. This variable is used just for the uncertainty estimation but not for the
 calculation.
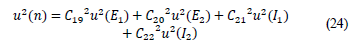
The combined standard uncertainty for the thermal transfer index 𝑛 is presented in eq. (24). Note that uncertainties associated with the amplifier input voltage eq. (16) and eq. (17) should be taken into account for the case of transconductance amplifier.
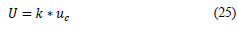
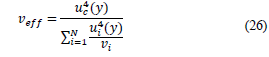
Finally, the expanded uncertainty was estimated accordingly to eq. (25) where k is the coverage factor calculated on the basis of the required level of confidence, which usually is 95% for a t-Student distribution with effective degrees of freedom as presented in eq. (26), the Welch-Satterthwaite formula.
In eq. (26) u i are the standard uncertainty components from the measurement model and v i their associated degrees of freedom.
3. Results and discussion
3.1 Measurement results
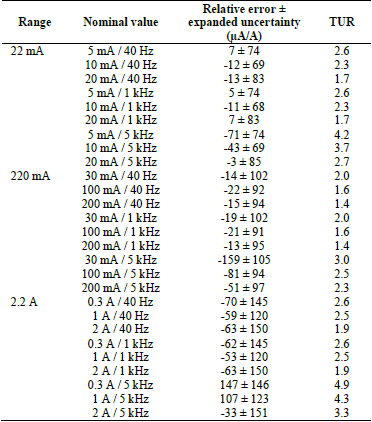
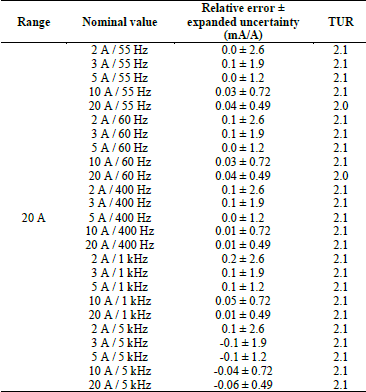
Measurement results for the calibration of the Fluke 5720A Calibrator up to 2 A are shown in Table 2. Each AC current value was calibrated at 5 different frequencies: 40 Hz, 55 Hz, 60 Hz, 1 kHz and 5 kHz; however, not all of them are presented on the table due to the similarities in results obtained at low frequencies. Table 3 shows the measurement results for the calibration of the transconductance amplifier Clarke Hess 8100 from 2 A to 20 A. In the analysis below, TUR stands for Test Uncertainty Ratio.
3.2 Results compatibility
TUR is a relation between the accuracy of the instrument under test and the calibration uncertainty; this parameter is used to evaluate if an uncertainty obtained by a given method is suitable to calibrate some type of equipment. For our measurement results, TUR varied from 1.4 to 4.9, which means that the uncertainty obtained is better than the specification of the device under calibration. The higher TUR was obtained for values at 5 kHz for Fluke 5720A, this is because the calibrator specifications are higher at this frequency compared to frequencies below 5 kHz. For the transconductance amplifier, the calibration uncertainty is, in general, two times better than the instrument accuracy specifications as shown in Table 3.
Table 3 Measurement results for calibration of the Clarke Hess 8100 transconductance amplifier.
Source: The Authors.
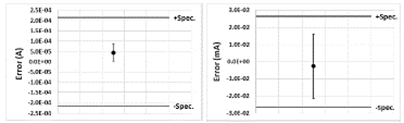
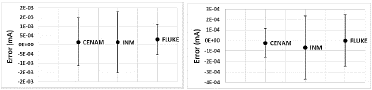
Measurement results were also within specifications for all values. Fig. 6 shows the error and its associated uncertainty compared to the specifications of the Fluke 5720A calibrator.
Source: The Authors.
Figure 6 Error and its associated uncertainty for 0.3 A / 5 kHz (left) and 200 mA / 1 kHz (right) for Fluke 5720A.
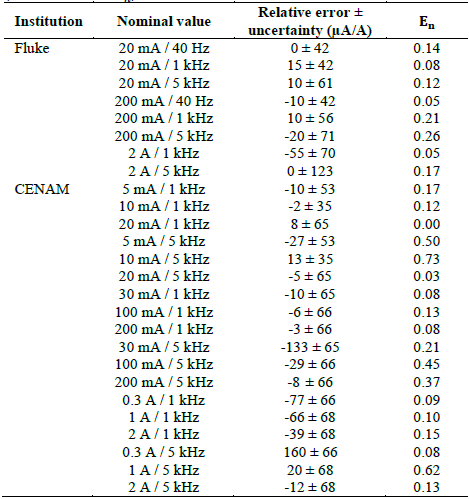
The compatibility of the measurement results was analyzed by means of the normalized error (E n ). Table 4 presents the CENAM and Fluke measurement results and normalized errors between those results and the ones obtained by the INM for the calibrator Fluke 5720A. We obtained E n less than 1 for all the compared values, which means that our results are compatible with the results of CENAM and Fluke as shown in Fig. 7.
Table 4 Calibration results reported by CENAM and Fluke and compatibility (normalized error E n ) with our results.
Source: The Authors.
Source: The Authors.
Figure 7 Comparison of calibration results for 20 mA / 1 kHz (left) and 2 A / 5 kHz (right).
No compatibility analysis was performed for calibration results of the transconductance amplifier as we do not have calibration results from external institutions or National Metrology Institutes for this instrument.
3.3 Temperature effects
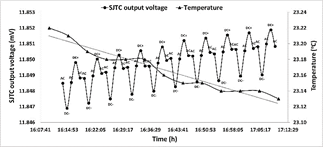
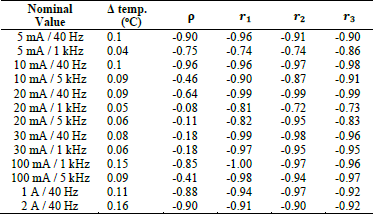
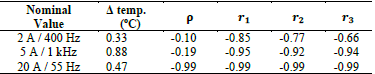
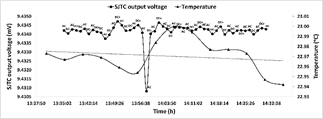
Measurement results show that the SJTC output voltage and temperature measured near the calibration setup are inversely related. Fig. 8 and Fig. 9 show the SJTC output voltage response to the current sequence applied presented in eq. (1), and the temperature variation at calibration setup; a negative linear relationship between voltage and temperature is observed. The voltage pattern in Fig. 8 shows a voltage drift which may be due to the temperature difference between the SJTC internal thermocouple and variations in the external temperature. Table 5 and Table 6 present the maximum temperature delta during calibration for different values, the Pearson correlation coefficient ρ and the sample Pearson correlation coefficients r 1 , r 2 and r 3 between a linear regression of temperature, and the SJTC output voltage. Noisy SJTC output voltage (signal that does not present a periodic response as the signal presented in Fig. 8) and measurements with atypical data as shown in Fig. 11 and Fig. 12 were not included for the correlation analysis.
Source: The Authors.
Figure 8 SJTC output voltage response and temperature during calibration (20 mA / 40 Hz).
Pearson correlation coefficient ρ was calculated between the SJTC output voltage data and the data obtained from a linear regression of the setup temperature measured during calibration. Some values of ρ denoted moderate or even a weak linear relationship between voltage and temperature -for example, results in Fig. 8 have ρ=-0.64 - although it is evident that there is a strong negative linear relationship.
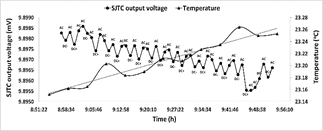
This is because the SJTC output voltage fluctuates due to its AC-DC current transfer difference. For this reason, sample correlation coefficient r 1 evaluates the correlation between temperature and the SJTC output voltage response to I dc+ , r 2 evaluates the correlation between temperature and the SJTC output voltage response to I dc- and r 3 evaluates the correlation between temperature and the SJTC output voltage due to I ac according to eq. (1).
Source: The Authors.
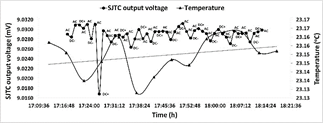
Figure 9 SJTC output voltage response and temperature during calibration (1 A / 40 Hz).
For the value 20 mA / 40 Hz r1=r2=r3=-0.99, which represents a strong negative linear relationship between temperature and voltage. In this case r1, r2 and r3 allow a more reliable correlation analysis.
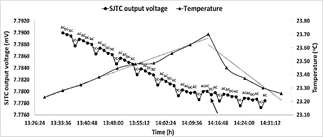
In some measurements, temperature changed abruptly as presented in Fig. 10. In this case, two linear regressions of temperature were made: when temperature rises and when temperature drops. The arrow shows a change in voltage drift when temperature drops.
Source: The Authors.
Figure 10 SJTC output voltage response and temperature during calibration (20 A / 55 Hz).
Results presented in Table 5 and 6 show that temperature variation near the experimental setup led to variations of the SJTC voltage drift. Therefore, it is important to avoid significant changes in temperature that could lead to changes in voltage and the measured AC-DC current transfer difference.
Table 5 Maximum setup temperature variation and Pearson correlation coefficients - Data obtained from calibrator Fluke 5720A calibration.
Source: The Authors.
3.4 Electrostatic effects
Measurements show that SJTC are sensitive to electrostatic effects; when laboratory staff brought closer to the calibration setup, there were changes in the voltage measured by the nanovoltmeter from a few microvolts (as observed in Fig. 11), to tenths of microvolts (as presented in Fig. 12), to even hundreds of microvolts. Electrostatic effects lead to atypical data and therefore to an increase of the measured AC-DC current transfer difference. A safety distance of about 3 m around the calibration setup was identified to avoid atypical data. A better alternative such as a shielded box could be used to protect the experimental setup from electrostatic effects. Measurements within the current intervals from 22 mA to 2.2 A show to be sensitive to electrostatic effects, more specifically at low frequencies (40 Hz, 55 Hz and 60 Hz).
3.5 Uncertainty budget analysis
It is important to clearly identify the uncertainty budget to determine which uncertainty components are dominant and how it is possible to minimize them. The main components from the combined uncertainty of the error (eq. (20)) were weighted using eq. (27): where u i (%) stands for the weight of the corresponding uncertainty component, u i the uncertainty component and c i stands for the sensitivity coefficient accordingly to the measurement model from eq. (19).
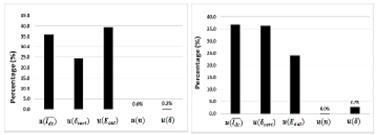
Fig. 13 shows that for low currents (< 200 mA) the most significant uncertainty components were due to the standard DC current
 , the AC-DC current transfer difference from the calibration certificate of the set SJTC-Shunt
 and the standard DC voltage meter

 Getting better uncertainties from the calibration certificate of the set SJTC-Shunt could lead to a global uncertainty reduction. The uncertainty component due to the nano-voltmeter was considerable high and it has a significant impact on the combined uncertainty.
Source: The Authors.
Figure 13 Uncertainty components for values 5 mA / 40 Hz (left) and 200 mA / 1 kHz.
Uncertainty due to the estimation of n was negligible for all values. Type A uncertainty u(δ) has a weight less than 1 %, at all current intervals; atypical data should be discarded as it leads to errors in the measurement (due to an increased in δ), an increase in type A uncertainty and, consequently, the expanded uncertainty.
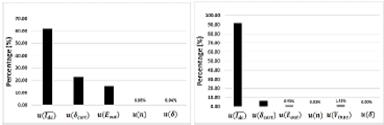
At higher currents (from 1 A to 20 A), as presented in Fig. 14, the dominant uncertainty component was due to the standard DC current accuracy and its calibration certificate uncertainty.
4. Conclusions
Our measurement results were compatible with international results from CENAM and Fluke; this means that our results are valid and that INM is able to provide traceability to SI for alternating electric current by AC-DC current transfer standards. The uncertainties obtained from 5 mA to 20 A are suitable to calibrate high accuracy AC current sources such as calibrators Fluke 5720A and Fluke 5730A, and transconductance amplifiers.
AC-DC current transfer standards are sensitive to ambient conditions (such as temperature) and electrostatic effects; in general, there is a negative correlation between temperature and the SJTC output voltage. Abrupt changes in temperature should be avoided as it could change the SJTC output response leading to measurement errors.
Electrostatic effects caused atypical data, it is recommended to use a shielding box or a shielding chamber to protect the measurement from electrostatic noise. If this is not possible, the calibration setup must be away from electrostatic noise sources; laboratory staff should be at least 3 m away from the measurement setup.
As SJTC are based on thermal effects, it is also recommended to reduce the switching time between the unknown AC current and the standard DC current applied to the SJTC. Currently this switching time is about 2 s because the calibrator Fluke 5720A was both the instrument under calibration and the standard DC current. A switching system could improve the performance of TCs to a more stable thermal operational condition.
The measured AC-DC current transfer difference of the system was considerable high for some values. This could be improved by adjusting the output of the standard DC current source so that the SJTC output voltage is quite similar when I
dc
and I
ac
are applied. This means that
 and
and
 would be so close that the uncertainty from the nanovoltmeter certificate would not be considered, only the short-term stability uncertainty according to the nanovoltmeter specifications will be included. This will lead to a reduction in the expanded uncertainty.
The analysis of the uncertainty weights is a valuable tool to identify the dominant uncertainties accordingly to the measurement model and gives insights in how to reduce some uncertainty components. Fig. 14 shows that uncertainty due to the standard DC current source
 has a significant impact on the uncertainty budget; to reduce this uncertainty component it is necessary to characterize the standard DC current source. By doing this,
 could be estimated from a regression model instead of using the specification from the current source leading to a reduction in the uncertainty.
Getting a better traceable uncertainty will also lead to a reduction in the expanded uncertainty.
Nowadays, TCC are composed of Planar Multi-junction Thermal Converters (PMJTC) with lower AC-DC Current Transfer Differences and uncertainties compared to SJTC, due to improvements in manufacture, leading to an error reduction derived from thermoelectric effects. Although SJTC have shown good results for AC current sources calibrations, the use of PMJTC would lead to better uncertainties.

