


 English (pdf)
 Article in xml format
 Article references
 Send this article by e-mail
 Cited by SciELO
  Cited by Google
  Similars in
SciELO
Similars in
SciELO  Similars in Google
 Permalink
1. Introduction
Nowadays the existing instruments in conventional weather stations (CWS), which are mechanically measured, are being replaced by automatic sensors not only in Brazil [1] but worldwide [2]. This is due to technological advances in the last decades, mainly in meteorological data automation systems. In addition, greater sampling and operating capabilities in hard-to-reach and/or inhospitable locations have contributed to encourage this substitution [3].
Technological advances have also allowed improvements in agricultural planning and decision making through meteorological data automation. Automatic weather stations (AWS) have enabled real-time monitoring of weather elements that directly and/or indirectly influence agricultural production, from planting to harvest [4].
Although AWS have a high technological level, this does not mean that they can better characterize environmental conditions, moreover, the sensors used are subject to physical damage, such as interference in the signal, disconnection and oxidation of cables, among others and, under these conditions, may lead to incorrect data, and inaccurate or even interrupted data generation [5].
[6] reported that a new automatic weather observation system has been installed in Greece on an experimental basis, which aims to overcome the technical problems, staff shortages and high maintenance costs inherent in CWSs. They found that there is a very good correlation for recorded meteorological data between CWSs and AWSs. However, there are significant biases between the corresponding values of new stations and thus more detailed investigation is required.
Without any data acquisition or transmission errors occurring, the main objective of automated weather data collection is to monitor weather conditions more quickly and continuously, thus making this data usable in real time [7]. In agriculture, technicians managing irrigation are among the main users of this data to make it more efficient [8]. In the Sertão and Agreste regions of Pernambuco, there is a significant occurrence of agricultural poles, especially in irrigated agriculture. These poles are characterised by rapid expansion of the cultivated area, high production growth and outstanding development of the fruit export sector, conditioning the region to see a concrete prospect for promoting a major socioeconomic improvement [9].
Faced with the need to obtain meteorological data more efficiently in automatic stations and before the total replacement of conventional stations occurs, since the ‘90s research works have reported the need for comparisons between the data obtained in the two types of stations in order to homogenise and ensure the reliability of the new data series [1, 10].
Souza et al. [11] reported that the replacement of CWSs by AWSs will not cause significant variations in the data values and consequently in historical series. However, there may be significant variation in the maintenance conditions and installation sites of CWSs and AWSs, although it is not a general rule, so comparative studies should be performed in different regions before the deactivation of CWSs.
[12], when conducting studies on the use of unofficial national system weather stations for calculating the water demand of irrigated crops, concluded that the values of only one type of station should be considered. The quality and relationship between the data obtained from CWSs and AWSs of the same region should be known in order to replace them.
With the improvement in the processes for the measurement and storage of meteorological data there has been a growing trend to replace CWSs by AWSs. It is therefore necessary to investigate the possible relationships between the data obtained from the two types of stations, in order to substantiate decisions on replacing CWSs by AWSs without prejudice to the continuity of the database.
Thus, this work aimed to evaluate the relationship between the meteorological elements that most cause changes in the ETo (mm) and its own value, derived from CWSs and AWSs located in the Sertão and Agreste regions of Pernambuco.
2. Materials and methods
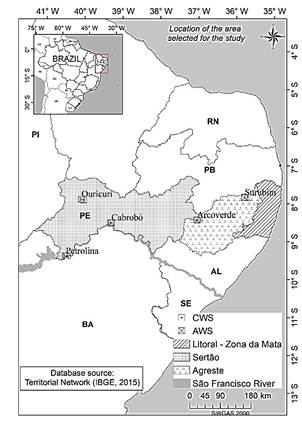
The meteorological stations selected were in municipalities that have both types of stations, belonging to the observation network of the National Institute of Meteorology (INMET) and located in the Sertão (Petrolina, Ouricuri, Cabrobó and Arcoverde) and Agreste (Surubim) regions of the state, totalling five CWSs and five AWSs, representing the majority of the area of coverage of the Lower-middle São Francisco Region (Fig. 1).
The observation period was from 02/12/2015 to 07/27/2016, using data from the INMET database. The meteorological elements analysed were mean air temperature (mean, ºC), relative air humidity (RH, %), wind speed (Vv, m s-1) and global solar radiation (Rs, MJ m-2 day-1).
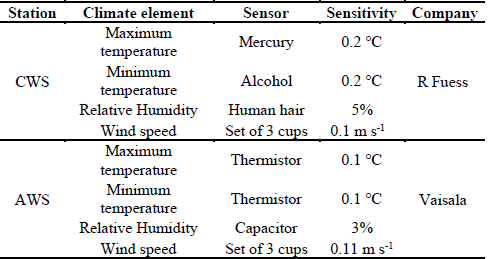
With the cited variables, reference evapotranspiration (ETo, mm) on a daily scale was calculated using the standard method proposed by the Food and Agriculture Organization (FAO), the Penman-Monteith method (FAO-56), through the REF-ET program version 2.01.17 [13]. All equipment and sensors used in the CWSs and AWSs (Table 1) are in accordance with the World Meteorological Organization [7].
Table 1 Technical specifications of the conventional (CWS) and automatic (AWS) meteorological stations sensors installed in the cities located in the Sertão and Agreste of the state of Pernambuco belonging to INMET.
Source: The authors
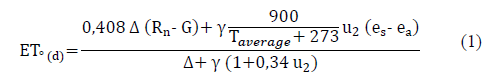
where:
ET0 (d) - daily reference evapotranspiration (mm d-1),
Rn - net radiation (MJ m-2 d-1),
G - soil heat flux density (MJ m-2 d-1),
average - air temperature at 2 m height (°C),
U2 - wind speed at 2 m height (m s-1),
saturation vapor pressure (kPa),
ea - Actual vapour pressure (kPa), calculated from Tmax, Tmin, RHmax and RHmin,
Δ- slope of the vapour saturation pressure curve (kPa °C-1), and
γ - psychrometric constant (kPa °C-1).
The daily data corresponded to the period between 0000 GMT (Greenwich Mean Time, 21 h local time of day n) and 2400 GMT (21 h local time of day n+1), according to the methodology adopted by INMET and the recommendations of WMO [7].
The daily average temperature and relative humidity results of the CWSs were determined from the average compensation according to the INMET standard. The daily mean values of temperature and relative air humidity from the AWSs were obtained with averages calculated by hourly data.
The stations in question did not have liquid solar radiation sensors (Rn, MJ m-2 day-1), and so their calculation was performed as proposed by [14], from global solar radiation (Rs) data:
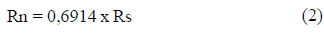
For the AWSs, the global solar radiation (Rs, MJ m-2 day-1) was measured by a pyrometer. In the CWSs, it was estimated from the insolation data, using the Angström- Prescott equation [13]:
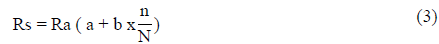
where: n represents the hours of sunshine (h day-1), N is the maximum possible duration of the day (h day-1), Ra is the solar radiation at the top of the atmosphere (MJ m-2 day-1), a is the coefficient that expresses the fraction of the radiation at the top of the atmosphere that reaches the earth on totally cloudy days, corresponding to the diffuse fraction, and b is the complementary coefficient that expresses the total global solar radiation.
To compare the meteorological data obtained in the two types of stations, statistical analyses were performed, such as: mean, median, mode, mean and standard deviation, variance, coefficient of variation, maximum, minimum and amplitude. In the initial evaluation, box plotting techniques (boxplots), which allowed a visual comparison and are essential for proper evaluation of models, were used [15].
The simple linear regression between the meteorological elements was also equated, and the equations were chosen based on the precision indicator and the highest coefficient of determination (R²) using C programming. The results obtained from the regression analysis were evaluated using the linear (a), angular (b) and R² coefficients, which reflect maximum accuracy when a = 0 and b = 1 and maximum precision when R² = 1 [15,16].
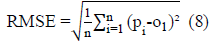
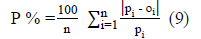
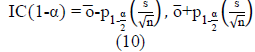
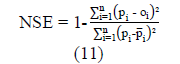
Furthermore, we studied the expected prediction error (EPE), Willmott's index of agreement (d), the mean bias (MV), mean absolute error (MAE), square root of the standardised mean square error (RMSE), relative mean error (P, %), confidence index (CI), Nash-Sutcliffe efficiency (NSE), percentage of bias (PBIAS) and standard deviation of observations (RSR) [17-21] respectively for Equations (4) to (13).
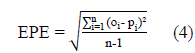
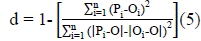

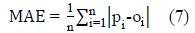
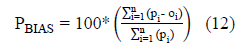
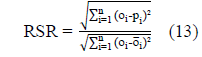
where: n - number of observations, Pi - values of the meteorological variable obtained in AWSs, with its respective physical magnitude. Oi - values of the meteorological variable obtained at CWS's.
RMSE provides the basis for quantifying the under- or overestimation of meteorological elements values obtained at the conventional versus automatic stations [22].
The accuracy related to the deviation from the values observed in the several periods analysed was statistically determined by Willmott's agreement index (d) (Eq. (5)), to evaluate the performance of the different data entry periods in the estimation of the meteorological elements.
3. Results and discussion
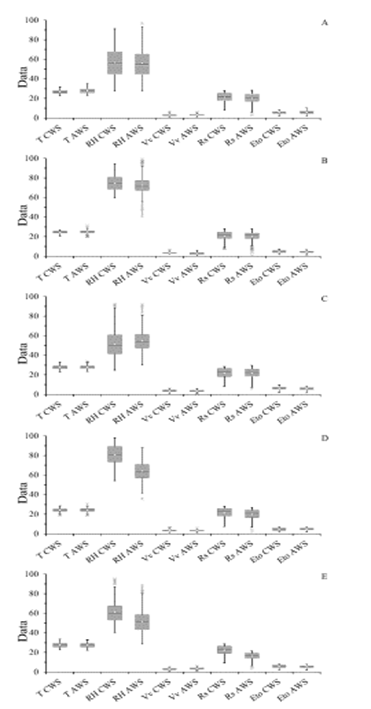
The descriptive statistics indicators, used to verify the similarity of the ETo data estimated by the Penman-Monteith method from meteorological components obtained from CWSs and AWSs, can be observed separately per station in Figs. 2 and 3. In Fig. 2, the box-plots of the meteorological elements for the CWSs and AMSs located in the cities of Ouricuri, Surubim, Cabrobó, Arcoverde and Petrolina can be observed.
It can be seen that the 10 weather stations have similar descriptive statistical parameters, especially when observed between the mesoregions of the Sertão. Despite this finding, the presence of outliers in AWSs and CWSs for some meteorological elements in all stations and the presence of an extreme value for Rs in the Surubim AWS can be seen (Fig. 2B). The study conducted by [22], which studied failure filling in meteorological elements data obtained in INMET, also found the presence of outliers and data with normality deviation.
In general, it can be seen that the few meteorological components outliers did not provide extreme changes in the ETo calculation (Fig. 2), and only the extreme value observed in Surubim may have caused the presence of an outlier in the AWS, although still within acceptable values of observation (Fig. 2B). Thus, as long as both data sources exist, it is important to verify values that deviate from normality and determine the possible cause.
Source: The authors
Figure 2: Box-plot of meteorological elements historical series obtained from CWS's and AWS's for (A) Ouricuri, (B) Surubim, (C) Cabrobó, (D) Arcoverde and (E) Petrolina. Where T- air temperature (ºC), RH-relative air humidity ( %), Vv- wind speed (m s-1), Rs- global solar radiation (MJ m-2 day-1), ETo- reference evapotranspiration (mm).
Since these four meteorological elements contribute most to the change in ETo values, the descriptive result (Table 2) shows that the variations were diluted in the ETo calculation, and thus there was a similarity in the values between the CWSs and AWSs. For the Sertão and Agreste regions of Pernambuco, a smaller variation than of the ETo values in the studies conducted by [10, 5, 9] was observed. Thus, it could be observed that there were similarities in the meteorological elements obtained in both types of station.
Table 2 Statistical values of the analysis of the performance of the meteorological variables and ETo in the period from 02/12/2015 to 27/07/2016 obtained in automatic and conventional weather stations located in the Sertão and Agreste regions of Pernambuco State.
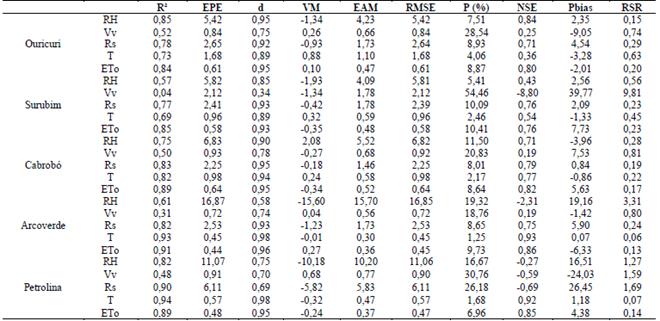
Where, EPE- standard error of estimate, d- Willmott's index of agreement, VM- Mean Bias, AMS- Mean Absolute Error, RMSE- square root of standardized mean square error, P- relative mean error, CI- confidence index (CI), NSE- Nash-Sutcliffee efficiency, PBIAS- Percentage of Bias and RSR- Standard Deviation of Observations.
Source: The authors
With these data, the coherence of the temperature, relative humidity, wind and solar radiation sensors was observed by [23], indicating that the meteorological elements that most explain the variations of ETo for a region of Lower-Middle São Francisco were the maximum temperature, minimum relative humidity, wind speed at 2 metres height and solar radiation, with averages of 7.49%, 8.37%, 32.58% and 46.57%, respectively.
[12] found variations in the reference evapotranspiration results observed between conventional and automatic stations in the Lower-middle São Francisco region, and that these variations were related with the spatial differences between the stations and the characteristics of the sensors and type of observations.
By conducting studies comparing AWSs and CWSs, a larger set of climate data can be obtained (which can be grouped into a single series), as is essential for studying climate change. [24] conducted a study of a 53-year historical series of climatological elements in the states of Bahia and Pernambuco, and concluded that there is a need for studies with larger data series and their responses for data spatialisation, which can be obtained by joining historical series from the two types of weather stations.
In Table 2, it is observed that the measurements of the meteorological variables RH, Rs, T and ETo obtained by the AWSs and CWSs showed a good correlation (d > 0.7), statistically determined by Willmott's agreement index, while the values of R² were higher than the average classification, with the exception of Vv for the meteorological stations of Surubim and Arcoverde, with values of 0.04 and 0.31, respectively. In addition, the correlation between the ETo values calculated based on the data in the CWSs and AWSs was very strong.
These changes in Vv values may be associated with the observations made by [25] in the same region, which, in a study of the hourly ETo calculation, verified the interference of the wind speed during short periods of time. Thus, there are different ways of responding to the different rates of variation of Vv for CWSs when compared to AWSs.
Willmott's correlation strengthens the accuracy check between the meteorological elements of the CWSs and AWSs. In general, the Willmott correlation values obtained were classified between very good and optimal (d > 0.7) [26], with the exception of Vv for Surubim and RH for Arcoverde, which did not present satisfactory results (0.34).
For Willmott's agreement index, a high value was also obtained for Petrolina (d = 0.84). Lower values (0.59) were obtained by [27] in the Lower-middle São Francisco region, in which Petrolina is located.
A high statistical performance was verified for all stations evaluated among the ETo data compared, with values of d > 0.93, which are classified as optimal.
When observing the EPE, it was found, in increasing order, that the smallest errors were for ETo in all 5 evaluated locations, followed by Vv and T, where due to the relatively small data values for Vv, EPE can be small. The largest EPE values were recorded for the RH variable, with a maximum of 16.87%, which was directly related to the daily amplitude of the measured values as well as to the large difference in the measurement form of this element.
The meteorological variables evaluated presented satisfactory mean absolute error (MAE), which was reflected in the low MAE in the estimated ETo values. The highest MAE for ETo was observed at Cabrobó station, with 0.52. An MAE above these values may cause significant errors in the application of irrigation depths when the values are close to or below 3 mm, and may cause water deficits or excesses, since it may cause errors greater than 17% of the total slide [28].
With a quality of result similar to the Willmott index, with the MV and MAE it was possible to observe that the AWS and CWS data have a central tendency, with variations distant from the zero value, and less precisely for RH. As the MV results followed the MAE results in a qualitative way, this indicates that the sets of points with anomalously extreme values did not cause significant changes in the sample, as reported by [29].
From the MV it could be inferred that the central tendency of the comparison between the data was to be overestimated or underestimated, which was visible in the figures of RH dispersion (Fig. 3 - A, B, C, D and E). This can be related to the difference in the measurement systems at the two types of stations, besides the influence of the daily variation, which is almost not observed in the conventional ones due to the measurement instruments and storage form.
Source: The authors.
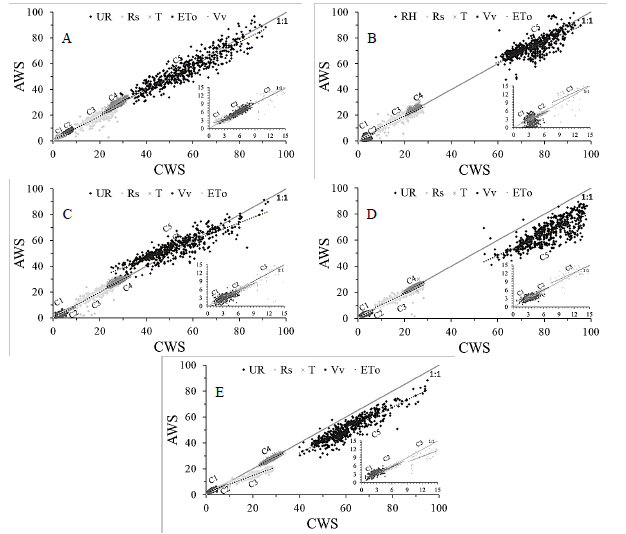
Figure 3: Correlation (C, F, I, L, O) of the meteorological elements of CWSs and AWSs for Ouricuri, Surubim, Cabrobó, Arcoverde and Petrolina, respectively. Correlation of Vv (c1), ETo (c2), Rs (c3), T (c4) and RH (c5). Where T- air temperature (ºC), RH-relative air humidity (%), Vv- wind speed (m s-1), Rs- global solar radiation (MJ m-2 day-1), ETo- reference evapotranspiration (mm)
In order for the comparison between the CWS and AWS data to be unbiased, then the NSE will be in the range of 0 to 1 and the PBIAS closer to zero. Thus, the equivalence of the respective measurements at Surubim for Vv (-8.80, 39.77), Arcoverde for RH (-2.31, 19.16) and Petrolina for Vv (-0.59, -24.03), RH (-0.27, 1651) and Rs (-0.69, 26.45) are not reliable. This confirms the need for verification and calibration of these instruments at the respective stations. If the problem continues, they should be subject to some adjustment.
In a complementary way to the NSE and PBIAS, RSR has incorporated the benefits of the error index and includes a normalisation factor, with ideal values of zero (indicating zero RMSE or residual variation) to high values. It is highlighted that this index summarises all the others and validates, for applications that are necessary, the values of ETo. Thus, there was a high statistical performance, through RSR, between the ETo data compared between the two types of stations for the locations in question, and this can be classified as optimal in the time series of ETo values from CWSs and AWSs (statistically determined by Willmott's agreement index).
Since the four meteorological elements are the ones that most culminate in temporal variations in ETo, the application of these data is verified in a satisfactory way for agricultural activity. However, caution should be exercised in the use of AWS data to perform calculations of irrigation depths, and of historical data series of conventional stations, especially when the values are less than 3 mm.
The similarity of the MAE and ETo values obtained via CWS data in this study was correlated with those reported by [30], in which they obtained high agreement and high correlation rates of the AWS meteorological elements in relation to the CWSs in the municipality of Teresina-PI. They associated the results with the small variation between most of the meteorological elements evaluated.
Thus, the importance of obtaining consistent data to estimate ETo is clear. The ETo information obtained from the MAE can be used to update the station's weather database, since there is a good relationship between the ETo data obtained from the CWSs and the AWSs.
4. Conclusion
1. The reference evapotranspiration (ETo) estimated with the data obtained from conventional and automatic stations shows a small difference between them.
2. The daily mean ETo values of conventional and automatic stations showed a good agreement, by Willmont's methodology.
3. The meteorological stations that presented the best concordances for ETo were Cabrobó and Petrolina, which can be used to fill faults between conventional and automatic stations without causing significant differences.
4. With the aim of creating a single set of historical ETo data in the evaluated municipalities, automatic stations can replace the conventional ones, since their data are found to be reliable and of similar quality.

