


 Inglês (pdf)
 Artigo em XML
 Referências do artigo
 Enviar este artigo por email
 Citado por SciELO
  Citado por Google
  Similares em
SciELO
Similares em
SciELO  Similares em Google
 Permalink
1. Introduction
In any surface mine it is necessary to transport material (ore and waste) from the location where it is being extracted to its destination, such as the processing plant or the waste dump location. The transportation of the material can be done using overland conveyors (typically when haulage distances are greater than 7 km) or using a truck-based system through mining haul roads, the situation of most surface mine operations. In this case, the balance between truck capacities and optimal cycle times are key factors to achieve high productivity at lower costs.
The condition of haul roads plays an important role in reducing cycle time, as it is responsible for providing appropriate conditions for the truck to reach its designed performance at the planned and safe speed. Besides that, underperformance of a haul road impacts immediately on operational safety and cost-efficiency, since up to 50% of the mining operating cost can be ascribed to haulage, and it is dependent on well designed, constructed and maintained haul roads [1]. Reference [2] evaluates the impact of sub-optimal road conditions on costs related to truck fuel and maintenance.
Mining haul roads are often subjected to weather conditions, whether this is a concentrated rainy season or well distributed rainfall. These conditions may cause significant damage to haul roads, bringing the necessity to maintain them. According to [2], maintenance activities can be classified into four groups: Routine maintenance, resurfacing, rehabilitation and betterment. The first consists of spot graveling, drainage and verge maintenance, dragging or retrieval of shallow blading, dust control or watering. Resurfacing consists of deep blading and full regraveling. Rehabilitation consists on ripping, regraveling and recompacting. Finally, betterment consists of rehabilitation and geometric improvement.
According to [3], “the selection of the most appropriate maintenance strategy is the key to accomplish the economic benefits of reduced transport costs”. Reference [2] describes four maintenance strategies: ad-hoc, scheduled, mining maintenance systems (MMS) and real-time mining maintenance systems (RT-MMS). All of these strategies include a method of road diagnosis. To be considered appropriate, a diagnosis method needs to identify problems in a cost-efficient and time-flexible way. It needs to be conducted frequently, due to the damage caused by rainfall.
Traditionally, haul-road diagnostics are made empirically or through field inspections of the road network. The defects analysis can subjective, as can the maintenance priorities have indicated. On the other hand, the RT-MMS proposed by [3] diagnoses the road conditions by measuring low-frequency vibrations in trucks and associating these georeferenced vibration registers with road defects. Reference [4] worked on system optimization to isolate, recognize and dimension road defects. Although it can achieve high accuracy and provide near-real-time information, this approach has been shown to be very sensitive to changes in truck size, tire and suspension system conditions, sensor position, etc.
This paper provides an alternative method of assessing mining haul roads that is capable of detecting road and drainage unconformities in the geometric design, as well as the upcoming or existing puddles and inappropriate erosion caused by water flow throughout the mining area.
2. Methods
UAV technology allows the capture of georeferenced images of an area from different perspectives. Digital photogrammetry uses this set of images and, by identifying similarities between them, creates a 3D elevation model that represents the area. Initially, the 3D model consists of a georeferenced point cloud, where the resolution and density depend on flight altitude and camera parameters.
Nowadays, there is a range of commercial software available that implement Structure from Motion (SfM) algorithms, such as Mic Mac®, Context Capture®, SiteScan®, Pix4D Mapper®, Trimble’s US Master® and Agisoft’s Metashape®. The last was selected here, considering that it provides a simple workflow and reasonable processing performance and processing parallelization using high-performance GPUs (Graphical Processing Units). During processing, a pixel-based map containing the Digital Elevation Model (DEM) was created by interpolating the dense cloud point coordinates; hence, the information could be handled as a raster object on a Geographic Information System (GIS). Reference [5] discusses the use of a DEM generated by UAV-photogrammetry for engineering purposes.
A DEM consists of a georeferenced 2D matrix in which each pixel/cell contains the terrain elevation. By using this information on a hydrology toolbox within the GIS software associated with watersheds or basins, it is possible to determine location, quantify and identify the direction of water flows and estimate the places where water is likely to accumulate throughout the mapped mining area. The idea of introducing the concepts of basins and watersheds using a high-resolution DEM can allow the detection of small catchment areas and the possibility of the water accumulated in those areas causing problems of drainage. Drainage in mining is one of the most relevant aspects that must be closely followed to guarantee the fast return of the operation after heavy precipitation and also to prevent undesirable water flow on slopes and water pounding that might block accesses to mining areas.
2.1 Description of UAV-based image acquisition
Different UAVs can be used to acquire data. However, some technical specifications of the equipment can make the flight mission more or less efficient and accurate. The missions performed to acquire data in this case study used a commercially available UAV: DJI’s Phantom 3 Pro®. Specifications: weight 1280 g, diagonal size 350 mm (propellers excluded), tilt angle 35º, a maximum flight time about 23 min (depending on wind conditions and flight plan), GPS∕GLONASS telemetry, 1.5-m horizontal accuracy and 0.5-m vertical accuracy, according to the equipment’s supplier.
2.2 Field tests and reference data
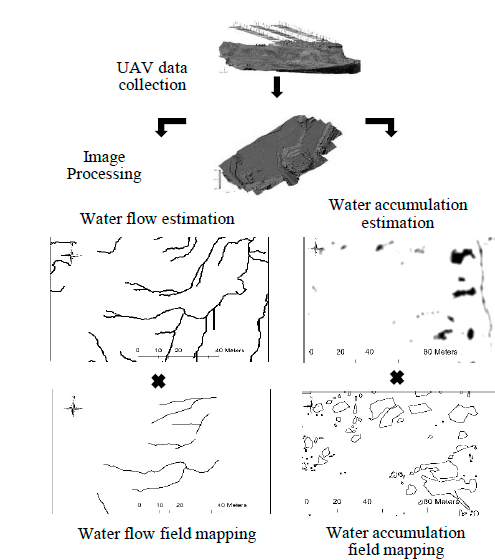
The workflow started by collecting data using a commercial UAV built-in camera. Also, a number of ground control points (GCPs) were used to guarantee accuracy during the georeferencing process. After collecting the data, it was necessary to process the imagery and the GCPs, which consisted of implementing photogrammetry algorithms through the selected SfM software; in this case Agisoft Metashape was used. The output from this step was a georeferenced DEM used as input to a GIS to create estimates of water flow and puddle location, determining the severity and extension of those irregularities throughout the mining surface. For validation purposes, the estimates of pothole occurrence were compared with reality, observed and registered through field mapping using high-precision GNSS (Global Navigation Satellite System) equipment. This workflow is represented in Fig 1:
2.3 Image acquisition
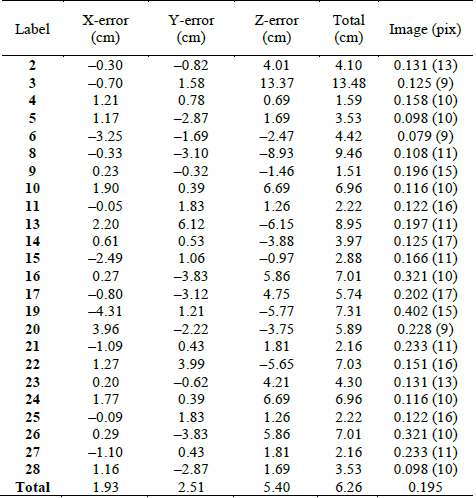
Two flight missions were executed in a quarry mine, using a DJI Phantom 3 Pro® UAV, which has 12-Mp resolution RGB camera, focal length (FR) 9.2 mm, aperture f/2.8, sensor size 4.6 × 6.2 mm, three-axis gimbal and built-in telemetry. The flight parameters used were: flight height 60 m, frontal overlap 80%, lateral overlap 60% maximum flight speed 6 m/s, and flight time about 11 min. The number of GCPs were 24 on the first mission and 12 on the second, distributed throughout the mapped area. In order to demonstrate the DEM accuracy, Table 1 presents the GCP errors from the first mission calculated using the root mean square error (RMSE), as given by the processing software after camera optimization.
The flight plan was defined using Pix4D Capture® app, a free mobile application available on Google Play/Apple Store depending the operational system running on the mobile device (Android/IOS) to plan and execute the flight mission. The app allows the user to set a previously planned flight route based on chosen parameters, such as flight height, frontal overlap, lateral overlap, maximum flight speed and flight direction. This last parameter is typically chosen according to the wind direction, takeoff point, and mission starting and ending points, in order to minimize battery consumption and increase flight autonomy. The camera’s trigger frequency is based on the set overlap between images, which in this case was approximately 2 s between consecutive shots.
The first flight mission was performed just after a 24-h raining period (19.6 mm precipitation). Therefore, it was considered as a “wet” scenario. This scenario contained evidence of the effects of rainfall over the entire mine site including the haul roads. The second flight mission was performed three days after the same 24-h raining period. Considering that no more precipitation had occurred since the first flight, it was considered as a “dry” scenario, although the site had not completely dried out. This scenario represented the mine-site surface without most immediate effects caused by therainfall, such as puddles and water flow.
Besides the UAV-photogrammetry modeling, field mapping was performed, in which many visible puddles and water flow were identified and delimited using high-accuracy GNSS equipment with Real-Time Kinematic (RTK) technology. This survey mapping was executed on the same day as the first flight mission (wet scenario).
2.4 Photogrammetric processing
Data obtained in the field (pictures and GCP coordinates) were used as input on Agisoft’s Metashape® to process the model. The number and distribution of GCPs were defined according to [6]. The dense cloud created had around 63 million points. Exterior Orientation (EO) accuracy was corrected by the gimbal and the use of GCPs and high overlap and sidelap. Since the gimbal was used to correct the camera orientation, parameters such as yaw, pitch and roll were not part of the image proprieties. Each scenario generated a 5-cm resolution DEM and an orthomosaic of the area. These data were then inputted to a GIS for further processing and analysis. Based on the DEMs, and using Spatial Analyst Tools (SAT) from ArcGIS® by ESRI, the presence of water puddles and the water flow network was simulated for both scenarios.
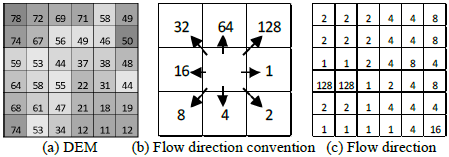
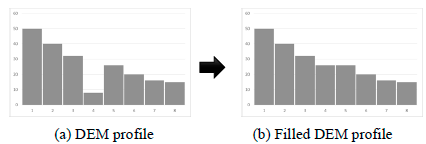
The calculations implemented on SAT were all based on the DEM, exemplified in Fig 2(a). The first process is called “Flow Direction”, which consists of looking at each cell and determining the direction to the lowest-elevation cell around it. The eight possible directions were described according to the convention represented in Fig 2(b). This process outputs a new matrix that represents the flow direction of each cell on a DEM - Fig 2(c):
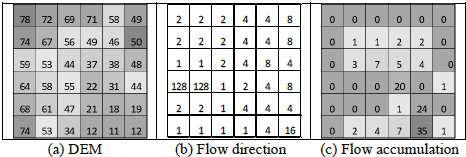
The second process is called “Flow Accumulation”, which takes the flow direction matrix as an input and analyses how many cells flow into each cell in the output matrix. A representation of a flow accumulation analysis can be found in Fig 3:
The third process is called “Fill Sinks”, which consists of analyzing the DEM and detecting an area (represented by a cell or a group of cells) surrounded by cells with higher values. Mathematically, these cells are a local minimum at the DEM matrix. After detecting local minimums at the DEM, the Fill Sinks process increases these cells’ value to the lower value on its border, as shown in Fig 4.
Using these algorithms, four estimations were made: water accumulation and water flow for each one of the two scenarios (wet and dry). Each of these estimations was compared with rain aftereffects. These aftereffects consist of puddles and water flow paths mapped in the field using the GNSS surveying, which are represented in Fig 5 and Fig 7.
Water accumulation simulation is made through a raster calculation and measures the algebraic difference between DEM and the “Fill Sinks” output. To improve its visual aspect, this result was re-interpolated to create the heatmap shown in Fig 5. Water flow estimation is made by capping and vectorizing the “Flow Accumulation” output.
3. Results and Discussion
3.1 Water accumulation
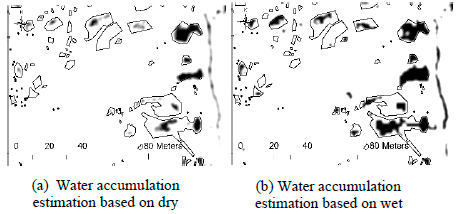
Fig 5 refers to water accumulation and demonstrates a superposition of estimation (heatmap) and reality (field mapping features). Fig 5(a) shows the estimation made on the dry scenario while Fig 5(b) shows the estimation made on the wet scenario. Visually, it is possible to verify that most estimations of water accumulation match the rain aftereffects mapped in the field, which indicates the efficacy of the methodology.
Water accumulation estimation is based on elevation differences of a high-definition model. Consequently, this methodology produces not only accurate estimations of significant water accumulation, but also inaccurate estimation of small water accumulation. These inaccurate estimations are due to data noise, a consequence of dealing with a 5-cm DEM. As described by [7], a higher resolution DEM does not always represent the terrain better than a lower resolution DEM.
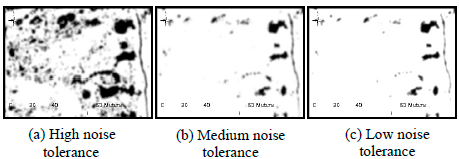
Some procedures to handle data noise can be employed. Using these procedures, the user has the option of defining a noise tolerance. Low noise tolerance, in this case, results in predicting/detecting only the deepest puddles, neglecting the shallower ones. On the other hand, high noise tolerance results in predicting/detecting even some of the small puddles. However, in this case, the results also contain false puddles generated by data noise. Fig 6 demonstrates the differences in water accumulation estimation results caused exclusively by changes in noise tolerance.
Source: the author.
Figure 6 Impact of noise tolerance changes on water accumulation estimation results.
Using low noise tolerance, all the hot spots were seen in areas where there was water accumulation after rainfall. However, some of the areas with water accumulation were not predicted using this approach.
3.2 Water flow
Water flow estimations were created for wet and dry scenarios and are represented by a gray line. In Fig 7, they are compared with water flow paths observed in the field (black lines). For both scenarios, most of the paths observed in the field match the estimated water flow lines, which indicated the efficiency of the methodology.
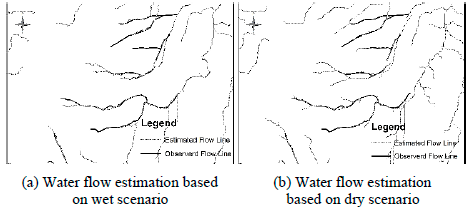
The determination of water flow lines by DEM using a GIS is widely popular and can be observed in [8]. Recent works, such as [9], use UAV to obtain a high-resolution DEM to monitor stream restoration. Using these advances to predict or detect streams on mining haul roads has been shown to be feasible. The most important aspect resulting in limitations of this method is the presence of vegetation on the area, which reduces estimation accuracy and generates local errors in stream course estimation.
4. Conclusion
Diagnosing water issues in mining areas before rainfall events, especially on roads, is an important task that allows mine maintenance equipment and staff to undertake preventive measures before they become too severe or accumulate in number, which may create a large problem that would be untreatable during rainy seasons. Besides, diagnosing these issues just after rainfall events allows evaluation of the impact of the runoff water and undesirable water flows over the roads and throughout the mining area and triggering immediate corrective actions to prevent greater damage created by the water.
Two flight missions were performed in the same area, in different situations. Data acquired in these missions were used to predict and/or detect water flow and ponding accumulation. Due to data noise, the effectiveness of water accumulation prediction or detection depends on the definition of a noise tolerance. The use of a GNSS for field mapping helped to calibrate the model sensitivity and set up an adequate level of depression detection. It must be considered that the methodology was focused on a small area to present the results in a controlled zone in order to develop and validate the model. As mentioned, the presence of high vegetation density imposes difficulties that cannot be solved simply when using UAV-photogrammetry techniques, although when dealing with mining areas, the vegetation has typically already been suppressed.
Considering that a mining operation normally exposes large areas, the impact of earthmoving equipment, it is likely to be left behind with damaged areas where unexpected water accumulation and unplanned water flow paths could be generated. These impacts become more severe with high precipitation levels. However, these impacts (damage to the roads, operating benches and drainage infrastructure) can be prevented if this method is implemented on a routine basis at the mine site.
One of the main contributions is that the UAV-based data collection and processing has been demonstrated to be an effective tool to quickly diagnose current imperfections in mining haul roads and surfaces and consequently runoff water. The productivity of a low-cost multirotor UAV is around 40 ha per 15 min flight at 120 m altitude, providing a ground sampling distance (GSD) resolution of around 5-10 cm pixel map, which is not feasible using conventional topographic techniques and equipment. This resolution is considered to be satisfactory to detect drainage imperfections at a local level, and it also satisfies the model error given by the GCPs, which did not exceed a few centimeters in magnitude, which is enough for detecting problematic areas with reasonable accuracy and determining corrective and/or preventive actions.

