


 Inglés (pdf)
 Articulo en XML
 Referencias del artículo
 Enviar articulo por email
 Citado por SciELO
  Citado por Google
  Similares en
SciELO
Similares en
SciELO  Similares en Google
 Permalink
1. Introduction
The Urama River basin, and its main streams, Canoabo, Temerla and Alpargatón, constitute a socioeconomic area of the central-western coastal region of Venezuela, and an important water supply source not only for Juan José Mora (69,236 inhabitants) and Puerto Cabello (182,493 inhabitants) municipalities [1], as well as for the oil (refinery and petrochemical) and power generation industries in the Carabobo state. In the middle part of the Urama basin, a reservoir built in 1980 reduces the downstream flood risk; the lower section of the basin is the alluvial plain that forms the natural Urama Wetland which discharges in to the Caribbean Sea. Reservoir and wetland improve the water quality and recreational activities and others that benefit society.
Water yield is conditioned by hydrological variables; additionally, it is essential for ecological evaluations and the development of management plans [2], which contributes to the delimitation of the natural wetland and definition of the use and management of planning units that are in projection.
Hydrological modifications, urbanization of hydrographic basins and changes in the ecosystem uses have been identified as the main causes of the transformation of wetlands [3-4]. These factors varied for the Urama River basin in the period 1986-2017 after the construction of the reservoir, the average change in land use and land cover (LULC) is 46.43% (vegetation 11.54%, agricultural between 5% and 14%, bare soil 5.83%, rural 4.02% and water bodies 0.15%) [5]. The agricultural activity has been carried out in areas with drainage restrictions, planted grasslands, areas near the water source and the Urama wetland [5-6].
Evapotranspiration and precipitation (rainfall) are used to monitor the dynamic of wetlands [7-8]. Due to their specificity and diversity of environmental conditions, wetland areas are often subjected to different forms of nature conservation. The measures to preserve the original features of such areas require a deeper knowledge of the principles of wetland environment functions, with particular emphasis on water balance [9].
A useful research area in Venezuela has been developed for the estimation of the water balance in different regions with different approaches. These include the validation of the water balance of the CERES-Maíz model in the zone of Maracay, Aragua state, [10] likewise the climatic characterization of the basins of the Yacambú and Tocuyo Rivers in the Andean mountainous zone located in the south of the Lara state, by using conventional mapping techniques in the study area, [11]. Studies to characterize the Tirgua River’s dynamics, Cojedes State, were carried out using the mathematical model of exponential decline, [12].
In other studies, the climatic conditions and water availability in the state of Apure are evaluated by drawing up the climatological water balance, applying the Thornthwaite and Mather’s methodology, [13]. In order to maximize the efficiency of water use in crops in the semi-arid zone of Lara State, a methodology was used to determine crop evapotranspiration and the daily balance of humidity in the soil, [14]; spatially analysed the water index in Carabobo, Venezuela, which allowed the climate to be grouped according to the degree of humidity, [15].
Geospatial data-based monitoring can contribute to management plans to reduce deforestation and the implementation of climate change mitigation policies, [16]. The effective use of remote sensing observations in conjunction with process models provides operational forecasts to improve water resource management, [17]. Using observations from satellite sensors and output from global land surface models, it is possible to study these little-observed river basins, [18].
The need to resort to statistical tools for data analysis makes new methodologies appear, such as geostatistical methods [19]. The term geospatial is used to describe the combination of spatial analysis methods and software with geographic data sets and geographic information systems (GIS), integrating hardware, software and data, linked to the fusion of statistical analysis and database technology, [20]. This combination of geospatial and forecasting tools can be useful for environmental management to collect, process, and derive forecasts of future scenario information to help improve decision-making in river basins and sensitive areas such as wetlands.
In this research area, a geoprocessing model was developed to estimate the agricultural land use capacity of the state of Aragua, Venezuela, by fitting a multi-nominal logistic regression model, [21]. The analysis of the space-time variability of precipitation from 1971 to 2000 in the state of Guárico and its surroundings was carried out by means of geostatistics and interpolation with the Kriging Method Ordinary, generating distribution maps precipitation space, [22]. For the state of Anzoátegui, groups of climatic stations with homogeneous precipitation were characterized through the hierarchical grouping analysis and the Principal Component Analysis (PCA) for the period 1970-2000, [23].
In the Centre for Hydrological and Environmental Research of the University of Carabobo (Venezuela), (CIHAM-UC) research has been carried out using geostatistical and space-time prediction methods: a geostatistical model is established to predict the magnitude and location of the hydrometeorological variables involved in the water balance, [24].
A hybrid method was proposed to generate a spatial-temporal forecast model of the water balance variables using the San Diego (Venezuela) aquifer, as a unit of study, [25]. Another variable influenced by the occurrence of extreme hydrological events is land use and land cover change. A hybrid model for forecasting changes in land use and land cover using satellite techniques helps to reproduce the spatial-temporal variation picked up by the reception of the reflectance variable, [26-27].
In this research, the available quantitative and spatial variables of the water balance (precipitation and evaporation) in the Urama River basin are characterized with the aim to develop a forecast methodology that combines geostatistical and spatial-temporal prediction methods of the water balance. In this process maps are generated for the statistical prediction of the annual water balance based on the observed time series from 1986 to 2000 and 2015 to 2016. The result contributes subsequently to the definition of the environmental management plan to delimit the protection area and the management units of the wetland area of the Urama River basin.
2. Study area
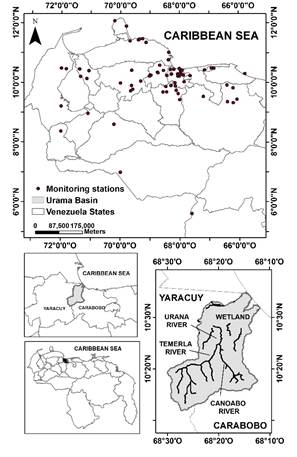
The study area is located the North Central Coast Region, Urama, between Carabobo and Yaracuy states, Venezuela (Fig. 1).
Source: The Authors
Figure 1 Location map of the study area: Urama River basin, Carabobo, Venezuela.
The Urama River basin arise from the contribution of Temerla River, Canoabo River and Alpargaton River, in the alluvial plain the Urama wetland takes place to discharge into the Caribbean Sea. The area of the basin is 31,715 ha [5]. (Fig. 1.). The geographic coordinates correspond to 10 ° 11 '30 "and 10 ° 33 '30 "north latitude and 68 ° 10' 00" and 68 ° 32 '00 "west longitude.
Most of the basin relief is mountainous corresponding to the La Costa mountain range, longitudinally dissected by a narrow valley and a floodplain to the Caribbean Sea. The altitude varies between 3 m.a.s.l. on the north coast, 50 to 135 m.a.s.l. on the slopes and 1,730 masl, in the southern mountain ranges.
The climate is variable and highly dependent on altitude, with rainfall ranging from 1,000 to 1,200 mm. In the low areas the life zone is of the tropical dry forest type, in the middle premontane dry forest and in the premontane humid forest in the high areas. The vegetation associated with these areas is generally deciduous, semi-deciduous and cloudy forest, respectively. Most of the basin has been affected by the introduction of citrus agricultural production systems and extensive livestock farming, [2].
3. Methods
The procedure is based on those carried out for studies made by the Center of Hydrological and Environmental Research of the University of Carabobo, Venezuela, in the basins of the San Diego and Pao Rivers, Carabobo state, Venezuela, [24-27]. It consists of two stages: 1) Compilation of information: a) Meteorology, b) Landsat satellite images and c) Digital elevation model. 2) Processing information, including: a) Modeling the spatial statistical prediction, (calibration); b) Forecast model, (calibration and validation); c) Forecasting time series of water balance variables, maps of the water balance variables were obtained showing the spatial-temporal distribution of future time series.
3.1 Stage 1: compilation of information
The collected data sets were represented by meteorological information and satellite images. The precipitation was acquired from a hydrometeorological network located in five states (Apure, Aragua, Carabobo, Cojedes, and Capital District) encompassing separate two periods, which were selected for the calibration and validation stages of water balance forecast model (Table 1, Fig. 1). During period 1986-2000, the database was collected by the Ministry of the Environment through a hydrometeorological network that consisted of 73 automatic stations, where weighing gages observed and recorded the precipitation automatically, using a strip-chart data logger.
Table 1 Telemetric network of climate monitoring stations in the Urama River basin, Carabobo State, Venezuela
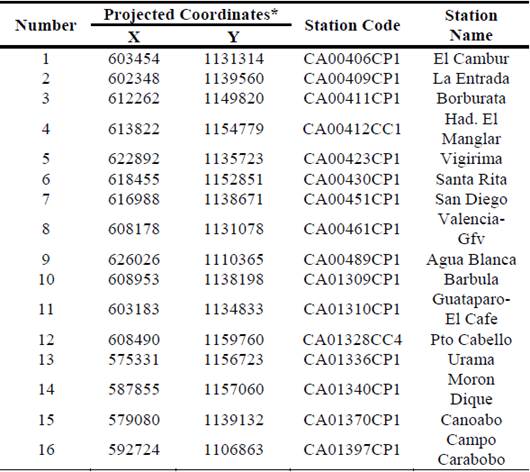
*System of projected coordinates: Universal Transverse Mercator (UTM), World Geodetic System 1984 (WGS84), UTM Zone: 19 N, available at: http://estaciones.inameh.gob.ve/estaciones/estaciones_home.php.
Source: The Authors
The gages observed and recorded the precipitation automatically. Evaporation was measured, applying the evaporimetric tub method, type A, [28]. For the period 2015-2016, the National Institute of Meteorology and Hydrology produced information through a network of 49 telemetering automatic hydrometeorological observation stations, using tipping bucket, raingages with UHF (Ultra High Frequency) radio transmitters [29]. The criterion for the selection of the two study periods was to employ the available hydrometeorological data measured by a specific method for the calibration (1986-2000) and validation (2015-2016) stages.
The information of the ASTER digital elevation model was obtained from the website identified as Earth Explorer of the United States Geological Survey (USGS) at the following link: https://earthexplorer.usgs.gov/, and was used to produce the water network of the Urama river basin shown in Figure 1.
3.2 Stage 2: processing information
3.2.1 Modeling the spatial statistical prediction
Statistical parameters of precipitation and evaporation for the water balance were estimated based on statistical spatial prediction model (SSPM). The type of SSPM used was the Kriging statistical model, [30]. Kriging is an Anglo-Saxon expression that comes from the name of the South African Geologist D. G. Krige, [30-31]. Kriging contains a set of spatial prediction methods based on the minimization of the mean square error of prediction [31-32]. In this research, the Ordinary Kriging method was applied, the predictions were based on the model (Eq.1):
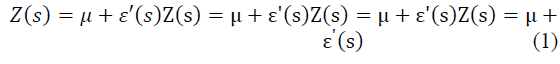
Where μ is the constant stationary function (global mean) and ε'(s) is the spatially correlated stochastic part of the variation, [31]. The analysis of point data were carried out based on the derivation and layout of the so-called semivariances obtained by [31-33] for the differences between the neighboring values (Eq.2):
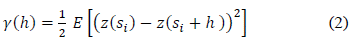
Where z (si) is the value of the target variable at some sampled location and z (si + h) is the value of the neighbor at the distance si + h. For n observations of points, n (n - 1) / 2 pairs are produced for which a semivariance can be calculated. An experimental variogram is adjusted using linear, spherical, exponential, circular, Gaussian, Bessel, power and similar models [25, 27].
3.2.2 Forecast model
The methods were developed based on the assumption that time series 𝑧𝑡 follow a stochastic model in a known way, [25]. According to [33], a seasonal ARIMA (AutoRegressive, Integrated, Moving Average”), model is formed by including seasonal terms in the ARIMA (p, d, q) autoregressive integrated moving average model, defined as (Eq.3):

3.2.3 Parameterization of models
The computational tool used for the spatial prediction models of annual precipitation was the geostatistical analysis module of ArcGIS V.10.0®. With regard the forecasting models, it was used the module of time series regression models of MATLAB®.
3.2.4 Forecasting time series of water balance variables
With the results of validation of the hybrid method for spatio-temporal forecast of variables of water balance in the Urama wetland, a forecast of the SSPM coefficients of the semivariances of precipitation (P) and evaporation (E) were made for future years 2020 and 2030. The forecasted coefficients of the semivariances of precipitation (P) and evaporation (E) were evaluated in the SSPM of semivariances for each variable to produce the stochastic component. The deterministic and stochastic components were superimposed applying Eq. 1 to produce the predicted spatial distribution in each variable, both P and E. The spatially distributed predicted variables were related through the algebraic expression to obtain the relationship maps (P-E) for the water balance.
3.2.5 Validation of method for forecasting variables of water balance
The raster maps of the forecasted variables are compared with the raster maps of estimated variables from field measurements corresponding for the years 2015 and 2016 to evaluate the estimated and forecasted relationship, which should be close to unity.
4. Results
4.1 Modeling the spatial statistical prediction
4.1.1 Precipitation
Annual precipitation (rainfall) for the period 1986-2000 was spatially distributed at a high intensity in the southern region, where the sources of the Rivers such as Temerla, Canoabo and Alpargaton are located, which contribute to the River basin Urama. In the northern region of the basin, the flood plain is located forming the Urama River wetland. For period 1986-2000: In the southern region of the high intensity basin, the annual precipitation varies between 1095.51 and 1636.99 mm / year; in middle basin annual precipitation (rainfall) varies between 940,52 and 1276,55 mm/year, and in northern region of low intensity, precipitation varies between 579.3 and 1075.6 mm / year.
The equation according to the statistical spatial prediction model (SSPM) of the Ordinary Kriging of function J-Bessel includes the following coefficients, (Eq.4).

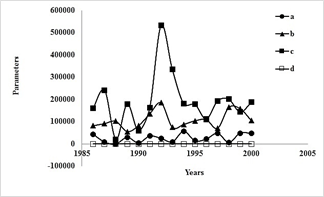
The coefficient "a" was associated with the non-spatial correlation, value of the curve of the semivariogram for the distance zero. The coefficient "b" was associated with the term C0 + C1, which is the variation of the threshold, value where the semivariance is stabilized called sill. The coefficient "c" represented to the maximum distance between the precipitation gages, the distance between the beginnings of the semivariogram to the beginning of the sill, called the range. The coefficient "d" represented to the parameter of the J-Bessel function. As a sample, the result of the calibration for the values of the coefficients a, b, c and d varied as follows: a between 0 and 56874, b between 55526 and 184610, c between 20726 and 532230, d between 0.01 and 10, (Fig. 2).
Source: The Authors
Figure 2 Time series of the parameters of semivariance models of the annual precipitation in the period 1986-2000 in the Urama River basin, Carabobo State represented by the J-Bessel function (Eq. 4).
4.1.2 Evaporation
Annual evaporation was spatially distributed by applying Eq. 1 and Eq. 4 on the field measurements, in a high intensity in the southern region with respect to the northern region of the Urama River basin, during the period 1986-2000. In the southern region, the annual evaporation varies between 1230.04 and 2651.2 mm / year. In middle basin annual evaporation varies between 1031.70 and 2396.20 mm/year and in northern region, evaporation varied between 899.47 and 2280.27 mm / year. The values of the coefficients varied as follows: α between 0 and 273700, b between 275510 and 487280, c between 64988 and 270180, d between 0.01 and 10.
4.1.3 Relationship of water balance variables
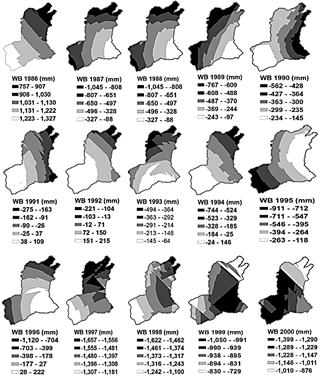
From the results of SSPM of the Ordinary Kriging by means of the J-Bessel function, for the water balance variables precipitation (P) and evaporation (E), based on time series 1986-2000, maps of the relation (P-E) were obtained for the water balance. As a sample, for the year 1991, a maximum value equal to 108.8 mm / year and a minimum of -274.6 mm / year was obtained, corresponding to the south and north region of the Urama River basin, respectively (Fig. 3).
4.2 Forecast model
4.2.1 Precipitation forecast
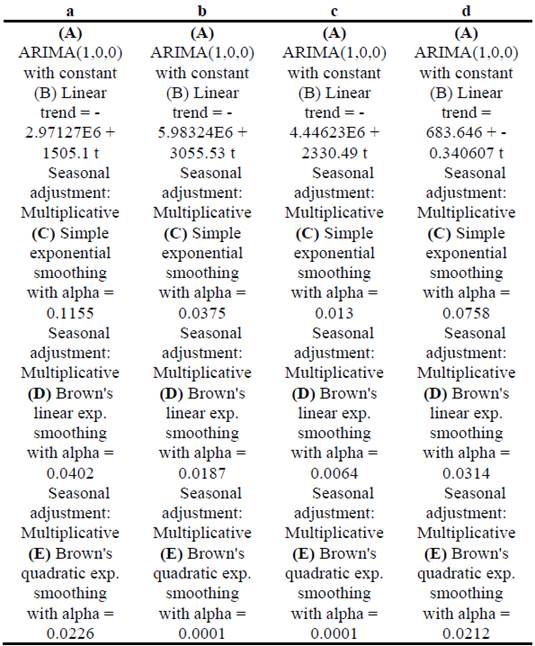
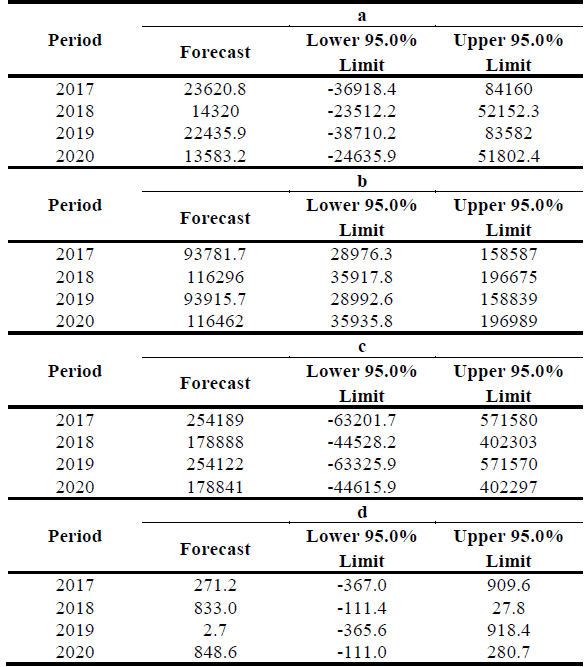
For the forecast of the SSPM coefficients of the annual precipitation semivariances based on the time series between 1986 and 2000, the tested models are indicated in Table 3: A) ARIMA (autoregressive integrated moving average), B) Linear trend, C) Exponential simple smoothing with constant alpha, D) Linear exponential of Brown smoothed with constant alpha, E) Exponential quadratic of Brown smoothed with constant alpha.
As a sample, the results found for the coefficient 𝑎 are shown in Table 2: A) ARIMA (1,0,0) with constant, B) Linear trend = -2.97127E6 + 1505.1 t, C) Simple exponential smoothing with alpha = 0.1155, D) Linear Exponential of Brown smoothed with alpha = 0.0402 and E) Exponential quadratic of Brown smoothed with alpha = 0.0226.
Table 2 Forecast of SSPM coefficients (a, b, c, d) of annual precipitation based on time series between 1986 and 2000.
Source: The Authors
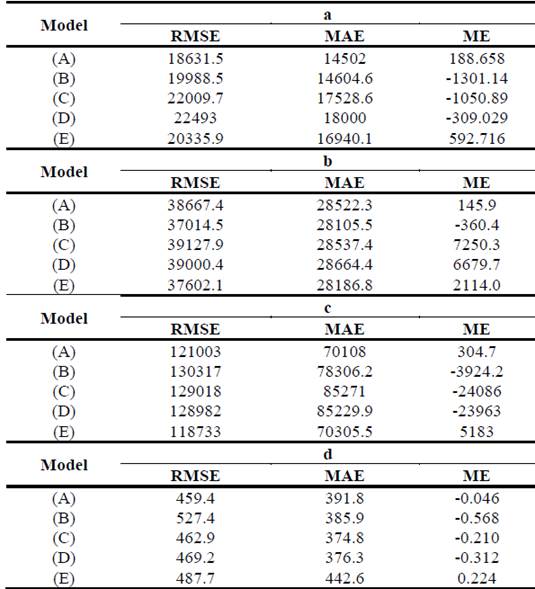
As a sample, the results for the coefficient 𝑎 of each model are (Table 3): Model A: 1) RMSE: 18631.5; 2) MAE: 14502 and 3) ME: 189. The model selected for the forecast of the SSPM semivariances coefficients of annual precipitation, was model D corresponding to Brown's linear exp. smoothing with alpha (Table 4). The model D shows 95.0% of prediction limits for forecasts, where it is likely the true value of the data at a selected future time is 95.0 % confidence, which indicates that the adjusted model was appropriate for the data.
Table 3 Error statistics by fitting the forecasting models to the SSPM coefficients of the annual precipitation based on the series 1986 and 2000.
Source: The Authors.
Table 4 Forecasting of SSPM coefficients of the annual precipitation based on the time series between 1986 and 2000 using Brown's linear exp. smoothing with alpha = 0.0402 (a), 0.0187(b), 0.0064(c) and 0.0314(d).
Source: The Authors
The SSPM calibration of the annual precipitation semivariances with the predicted coefficients for the years 2015 and 2016 according to the time series between 1986 and 2000; which was used in the validation stage, are shown in Table 5, obtaining the correlation statistics between the spatial prediction of annual precipitation and the measured values of the precipitation map for 1991 and 1995, respectively.
Table 5 Calibration of SSPM of the annual precipitation semivariances with forecasted coefficients for 2015 based on the time series between 1986 and 2000; which will be used in the validation stage.
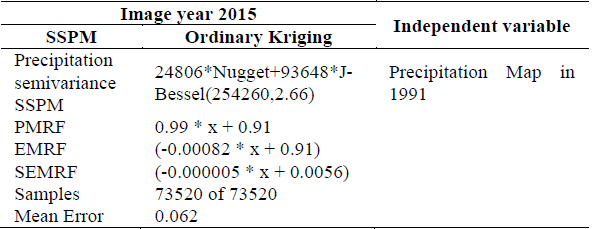
SSPM: Statistical Spatial Prediction Model, PMRF: Predicted versus Measured Regression Function, EMRF: Error versus Measured Regression Function, SEMRF: Standardized Error and Measured Regression Function
Source: The Authors
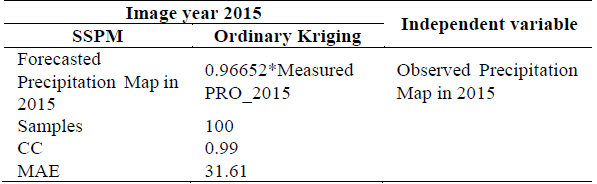
The validation of the forecasts of the SSPM corresponding to the annual precipitation observed for 2015 and 2016 and the estimated annual precipitation with the predicted coefficients of the annual precipitation based on the time series between 1986 and 2000, was developed by applying the linear exponential model D of Brown smoothed with alpha, as it is indicated in Table 6. It is observed that the extracted values from the predicted precipitation map for the years 2015 correlate with the values extracted from the observed precipitation map for the years 2015, respectively.
Table 6 Validation of the forecasting of SSPM corresponding to the observed precipitation for 2015 and the precipitation estimated with forecasted coefficients of the annual precipitation based on the time series 1986 - 2000 using Brown's linear exp. smoothing with constant alpha.
Source: The Authors
4.2.2 Evaporation forecast
The map resulting from the forecast of annual evaporation for 2015 and 2016, shows that the maximum annual evaporation varies between (1596.02 and 1806.7) mm / year, the lowest values of evaporation are between (1180.47 and 1186.1) mm / year.
4.2.3 Forecast of water balance variables
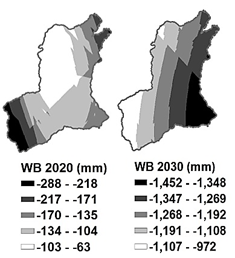
With the results of validation of the hybrid model for spatio-temporal forecast of variables of water balance in a wetland, a forecast of the SSPM coefficients of the semivariances of precipitation (P) and evaporation (E) was made, based on the time series between 1986 and 2000, for future years 2020 and 2030, in order to obtain the maps of the relationship (P-E) for the water balance. As a sample, the maps of the relationship (P-E) of water balance for the years 2020 and 2030 present a spatial distribution pattern for the southern region with a negative maximum balance; while the northern region, (where the Urama wetland is located), results in a negative minimum balance, which indicated for the forecast values of annual evaporation that exceeded the rainfall in both years (Fig. 4).
5. Discussion
The study area is located between humid equatorial climate to the south and dry climate of high subtropical pressures to the north. In the border of these two climatic structures, the conditions allow the presence of the tropical climates of the Carabobo state and the rest of the country, with a few months influenced by the Intertropical Convergence Zone and its influence on the genesis of precipitation (rainy season); and others dominated by the absence of these (dry season) within the field of the North Atlantic High Subtropics [34]. Hence, the presence of life zones classified in the Urama River basin from north to south in: tropical dry forest (low basin), premontane dry forest (middle basin) and cloud wet forest (high basin), [2]. These zones allow the Urama wetland to be differentiated both by their spatiality variability and the physiography, likewise the influence that it exerts on climatic variables such as precipitation and evaporation.
5.1 Precipitation prediction
The results of the SSPM - Ordinary Kriging analysis based on the time series 1986-2000, indicated that the spatial distribution of precipitation shows maximum values in the southern region corresponding to the nascent of the Urama River basin, where the Canoabo and Temerla Rivers are located.
The maximum precipitation was 1636.99 mm / year; therefore, the pattern of greater spatial coverage corresponded to the cloud forest areas, (above 700 m altitude). In them, the precipitation varied between 1109.18 and 1636.99 mm annually, with an average of 1290.79 mm. In middle basin annual precipitation (rainfall) varies between 940,52 and 1276,55 mm/year, the life zone corresponds to the premontane dry forest, where the drinking water reservoir is located.
In the northern region, minimum precipitation occurred, with a lower value equal to 579.31 mm / year, which corresponded to the alluvial plain of the Urama River and its wetland. These were areas in a smaller proportion, zone of tropical dry forest located from the foothills to the lower basin until their exit to the Caribbean Sea, with precipitation between 579.31 and 1039.54 mm per year, with an average of 871.15 mm.
In the Canoabo River basin, which is a tributary of the Urama River to the middle basin, for the period 1968 - 2003, the precipitation reached an approximate variation between 1,000 and 1,200 mm annual average [2]. The pattern of greater spatial coverage corresponded to the areas to the south of cloud forest and the least proportion has drier deciduous forest, located in the center of the basin, with an average rainfall of 987 mm. With respect to these values, the precipitation results obtained from the research were within the average for the precipitation distribution pattern, with the maximum obtained equal to 1636.99 being greater; which means that the precipitation increased in the period 1986-2000.
For the forecast of precipitation for the period 2015-2016 with estimated data for the 1986-2000 series, the result for 2015 was within the spatial pattern of the basin; 1182.41 mm / year in the southern zone (cloud forest) and 917.67 mm / year in the northern zone (tropical dry forest), regarding the average value equal to 1050.03 mm / year, this was below the series (1986-2000). For the year 2016, the pattern of spatial variation was inverted, obtaining the maximum value in the northern region (1349.67 mm / year) and the minimum value in the southern region (1052.68 mm / year). These values corresponded with the observed average values and with the spatial variation of the period 2015-2016.
This distribution was similar to studies of climatic characterization of Venezuela, for the Yacambu and Tocuyo River basins in the central western region, with a maximum precipitation of 2387 mm / year in the southern region, located within the mountainous area with high values of altitude, (1200 masl), where the pluviometric regime was transitional; while, on the northern slope, semi-arid depressed area, a minimum of 483 mm / year [11]. This behavior for each area was related to the orographic factor and the exposure of the slopes to the different air masses in the north and south areas, being similar to the studied area. The 1971-2000 series, (Guárico, Venezuela), showed precipitation values between (800 -1400) mm, towards the southern zone, where the trend showed a spatial distribution pattern with a gradation that goes from lowest to highest in the northeast to southeast direction, [35].
5.2 Prediction of evaporation
The results of the statistical spatial prediction model (SSPM) of the Ordinary Kriging for the period 1986-2000, presented maximum values in the southern region with an annual maximum of 2651.2 mm / year, corresponding to the humid forest zone; in middle basin annual maximum evaporation 2396.20 mm/year, corresponds to premontane dry forest, and low values in the region north, with a minimum equal to 899.4 mm / year, corresponding to the humid forest zone.
The maximum values of evaporation turn out to be higher than the maximum values of annual precipitation, in the same way, the lowest values of annual evaporation turn out to be higher than the minimum values of precipitation. For the forecast period 2015-2016, the trend continues. In comparison with studies by [35] during 1971-1983, for the Apure state located in the southern zone of Venezuela, evaporation reached an annual total of 2616 mm, where the highest values of evaporation are found during the period of least precipitation, indicating water deficit in the soil.
5.3 Relationship of water balance variables
With the series of data 1986-2000, the relation (P-E) of water balance variables was positive only in the years 1991, 1992, 1994 and 1996, in the rest of the period the relation was a negative value, (Fig. 5).
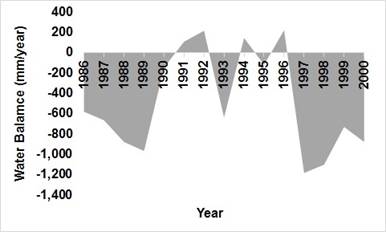
Source: The Authors
Figure 5: Relationship (P-E) of water balance variables according to time series 1986-2000, in the Urama River basin, Venezuela.
The water balance showed a varied distribution pattern that was characterized during three periods. The first period (1986-1990) presented a negative balance (P-E) relation. The water balance was increased in the following 5 years to positive values (1991-1996) where the maximum values of precipitation occurred when comparing with the rest of periods. For the third period (1997-2000), the water balance gave negative values. The water balance tends to result in negative values due to the evaporation phenomenon from water reservoirs, which offer an expanded water surface that favors the occurrence of evaporation rates higher than the precipitation rates that occur in both dry and rainy seasons. In comparison with [29], the same distribution of (P-E) was presented for the period 1971-1983, where with the water deficit and excess occurred influenced by the physiographic units, and it was possible to combine production areas to specific crops, which contributed to delimit wetland protection areas in the basin.
5.4 Precipitation and evaporation forecasts
The statistical models of spatial prediction of semivariances for the variables of the water balance with the predicted coefficients (a, b, c and d) for the years 2015 and 2016 and for the future years 2020 and 2030 corresponding to the function J -Bessel; indicated the adjustment to the semivariances, these were small for the values located in a shorter distance, presenting a tendency to stabilize with the increase in distance. The predicted maps 2020-2030 showed acceptable values within the ranges reported by the 1986-2000 series, confirming that the forecasted stochastic component (semivariance coeffcients) was able to reproduce the spatio-temporal pattern corresponding to the time series in period 1986-2000. Similar results have been obtained in the studies of the San Diego River basin, Venezuela, [25,27], and the state of Anzoátegui, Venezuela, [37]; as well, as the studies of Cortez 2016, in the Guárico state. The annual variability of precipitation in Venezuela is highly influenced by prevailing geographic conditions such as the presence of the La Costa mountain range and its interaction with the Caribbean Sea [36]. This climatic characteristic of the region is due to the alternating action of the intertropical convergence zone.
6. Conclusions
The study showed the inter-annual variability of water balance variable during the time series 1986-2000 with forecasts for future years 2020 and 2030. A pattern was presented in the SPPM of the southern, and northern regions, associated with the maximum and minimum values of each year, where precipitation and evaporation was high in the southern region, (cloud wet forest), while in the northern region, (tropical dry forest) the wetland area, low values were presented. For the period 1986-2000, the semivariances were smaller at a shorter distance and increase at a greater distance to stabilize. The results showed that the pattern follows the behavior of the annual variability of the precipitation and evaporation of regions of Venezuela, in comparison with studies developed in other areas, influenced by the Intertropical Convergence Zone on the genesis of precipitation (rainy season); and others dominated by the absence of these (dry season)
The results of adjusting a linear model to describe the relationship between predicted and observed water balance variables for the years 2015 and 2016, were obtained with a gradient that varied between 0.96 and 0.99 for precipitation and between 1.01 and 1.20 for evaporation. These values indicated the performance of the hybrid spatio-temporal model, which presented values of the correlation coefficient (CC) and coefficient of determination (R2 squared) greater than 0.99. The correlation coefficient indicated a relatively strong relationship between the variables, the R2 squared statistic indicated that the model was adjusted, given the percentage of the variability in the prediction with the observed values.
In this study, the application of the method proposed, implies the spatio-temporal prediction combining geostatistical models from geographic information systems with models of time series, for the knowledge of the spatial distribution of the future values of the precipitation and evaporation variables that contribute to the ecological evaluation of wetlands, based on a series of existing data.
The knowledge about these climatic variables of water balance, allows to obtain a much more assertive approach when making strategic decisions in wetland areas, where the service of production of potable water in high areas of the basin and the agricultural service in the lowlands, makes that are very vulnerable to the influence of persistent dry periods. This leads to the analysis of land management, determining its performance in periods of low rainfall and high evaporation, so that actions can be directed at controlling land use and activities such as deforestation and the agricultural sector in the region.

