


 Inglês (pdf)
 Artigo em XML
 Referências do artigo
 Enviar este artigo por email
 Citado por SciELO
  Citado por Google
  Similares em
SciELO
Similares em
SciELO  Similares em Google
 Permalink
1. Introduction
Growth in the demand for energy resources and the need to reduce polluting emissions to the environment from energy generation and consumption are essential aspects for developing technologies to improve the use of renewable energy sources [1]. Currently in Mexico the generation of energy using SFV is incipient, it is reduced to small autonomous systems to solve problems of rural electrification and some small interconnected power plants to reduce their consumption [2], being the case of the solar plant installed in the Zacatecan Council of Science and Tecnología, CoZCyT that has a capacity of 180 kWp that will supply some state agencies [3]. The global installed capacity of renewable energy technologies are growing rapidly, a major boom is having photovoltaic solar energy [4].
Electric power generation companies commonly manage hourly rates based on peak hours of electricity demand [5]. On the other hand, conventional grid-connected SFVs only inject power during the day and in proportion to the available irradiance. Given the above, a niche of opportunity is created to investigate the impact on the reduction of the rate due to the inherent effect of the injected energy and additionally due to the effect of controlled hourly injection. So, an energy storage system is necessarily required to perform this mismatch.
Pb-a batteries are the most common option for mass storage of electrical energy, and although they have associated efficiency and cost, they can compensate for these disadvantages when it comes to balancing the electricity bill [6]. In effect there will be a decrease in the energy injected to the net, but it must be remembered that this lag injects energy at a more critical time and that is why energy is more valuable. Hence the interest in developing a grid-connected SFV that allows monitoring and controlling the injection of electrical energy.
The development of a SFV with a control of energy injection to the electrical network is presented, where there will also be a methodology for monitoring and controlling the generation and consumption variables, which will provide opportunities for improvement. Among the benefits, it can be mentioned that it will be possible to reduce the consumption of electrical energy from the network at times when there is a higher rate (peak energy), it will also be possible to reduce the cost of demand. In this way, the charge on the invoice for the consumption of electric energy is reduced considerably, it is estimated that the reduction in the monthly cost of consumption in a GDMTH rate of 30%.
2. Materials and methods
2.1 GDMTH Electric Rate
Electric power in Mexico is commercialized through a tariff structure grouped into five sectors depending on the use: residential, commercial, services, industry and agriculture [7]. The cost of energy depends on: the energy demanded, voltage, temperature, type of tariff and in some hours the time of consumption according to the Federal Electricity Commission (CFE) [8].
Users with high energy consumption, tariffs were established where the cost of energy depends on the time of day and thus propose economic schemes to users that promote rational use of electricity (mainly the industrial sector). That is, because the user sees reflected the cost of energy production for the CFE in peak hours, these hourly rates were established on November 10, 1991 [9]. However, they have undergone modifications, in the industrial sector the modification of the tariff scheme occurred in December 1998 [10], energy consumption was considered according to the time of day and demand contracted in medium voltage. In the current legislation these tariffs have been restructured and it is established that the Energy Regulatory Commission (CRE) is the one in charge of determinate the methodology calculation for the electricity supply tariffs [5] and as of December 1, 2017 there is in our country a new structure of tariffs at the national level. The structure of the Final Basic Supply Tariffs (TFSB) is made up of the costs of the services to generate, transport, distribute electrical energy to end users and are classified according to the characteristics of consumption, voltage level, type of measurement and tariff regions [8].
The calculation formula in this rate scheme the TFSB that is applied to users is as follows:
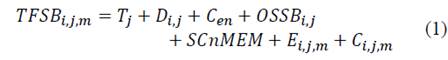
Where:
TFSB i,j,m : Is the Final Basic Supply Rate of division i, rate category j, for month m. This is the cost of energy supply that a user must cover for the monthly electricity bill.
Tj: Category j transmission fee. These fees are applied according to the consumed energy (kWh) and correspond to the use of transmission lines
D i,j : Distribution charge for division i, category j. It is applied only to low voltage users; These includes a fee over the energy (kWh) for users who, for their meter, is not possible to differentiate between energy demanded and energy consumed.
C en : Current charge for the operation of the National Energy Center (CENACE). This fee depends on the level of consumption (kWh).
OSSB i,j : Charge for the Operation of the Basic Services Provider of division i, category j. This is a monthly fee lonely and independent from demand of consumption of energy
SCnMEM: Charge for Related Services not Included in the MEM. They are the services linked to the operation of the national electricity system
E i,j,m : Energy charge of division i, tariff category j, for month m. It consists of the charge for energy consumption (kWh).
C i,j,m : Capacity charge of division i, tariff category j, for month m. It is applied according to the rate, in the case of GDMTH the charge is made depending on the maximum demand (kW) of the billing period.
In the GDMTH rate, charges are made for peak, intermediate and base energy according to the local schedules that were officially established [11]. There are energy charges for maximum demand and this intervenes in the Distribution and Capacity aspects where the maximum monthly demand and the maximum demand at peak hours respectively are taken into account.
2.2 Description of charges on the invoice
Fig. 1 shows the charges for each of the concepts involved in the calculation formula in the TFSB according to Eq. (1). It can be seen that the highest percentage is energy consumption (44.1%) followed by capacity (22.9%), in addition to the charges for power factor (FP), which in this case there is a compensation for having an FP = 0.99 that represents a 2% discount, VAT charges represent 13% and the Public Lighting Right (DAP) represents 8% of the invoice. It is clear that energy consumption and capacity are those that have the greatest impact on the electricity bill.
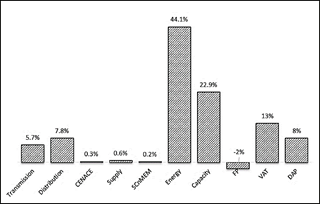
Source: Elaboration based on information from the electric bill.
Figure 1 Breakdown of the monthly electricity bill in percentage.
When characterizing energy consumption, it is necessary to obtain the consumption profile during a normal work cycle within the Institution. In order to have a better description, information was recorded and analyzed by billing month of energy consumption, taking into account consumption in base, intermediate and peak hours. A historical record of the consumption of the last three years of energy was made, obtaining a monthly average that considering the hours shown in the Table 1, observing that the greatest demand for energy occurs in the intermediate hours, which is where the greatest amount of energy is to develop activities in the workplace, the average percentage of monthly energy consumption per hour is as follows: in base hours 28%, intermediate 63% and peak 9%; being very notable that in peak hours it is a third of consumption in base hours and a seventh of consumption in intermediate hours.
Table 1 Average monthly annual percentage of energy consumption and cost.
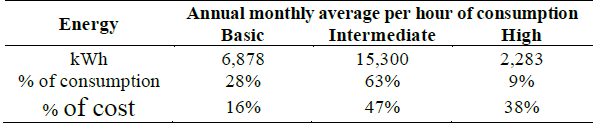
Source: Elaboration based on information from the electric bill.
Analyzing the information in Table 1 which also presents the cost of energy and demand for each of the schedules and it can be seen that even when peak hour consumption has a value of 9%, it represents 38% of the total of the cost of energy only 9% below the cost of energy in intermediate hours and 22% above the cost of energy in base hours. Fig. 2 shows the average percentage of energy consumption per hour accompanied by its monthly cost.
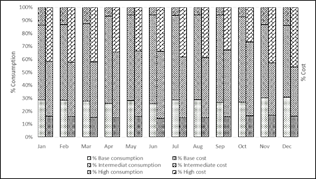
Source: Elaboration based on information from the electric bill.
Figure 2 Contribution of consumption by annual period.
An alternative to avoid excessive charges for energy in peak periods is for the company to avoid consuming energy during this period. However, this implies that individuals install their own power generation plants for self-sufficiency. An alternative is the installation of an SFV connected to the electricity grid but also having a storage system that allows it to store energy during daylight hours and to inject it in a controlled manner into the electricity grid in the peak period.
Source: Elaboration based on information from the electric bill.
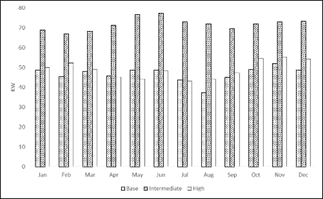
Figure 3 Maximum demand per period during a year.
Another aspect that must be analyzed in the GDMTH rate is the maximum demand [12], since it also depends on the user's consumption characteristics and this parameter directly influences the distribution and capacity charge. Fig. 3 shows the values of the maximum demand measured in each of the periods and for all the months that correspond to the analyzed work cycle, it can be seen that the greatest demand occurs in the intermediate hours followed by the demand in peak hours.
It is necessary to identify the behavior of demand since, as shown in Fig. 1, demand influences 31% of the electricity bill, influencing the distribution and capacity charge. The distribution charge for users in the GDMTH rate is defined by the minimum value obtained from the maximum demand and the energy consumption registered in the billing period according to what is defined in Eq. (2) which is defined in [13]:
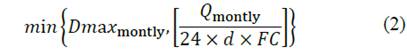
Where:
Dmax montly: is the maximum demand registered in the month to which the invoicing corresponds in kW.
Qmontly: is the monthly consumption recorded in the billing month in kWh.
d: the number of days in the billing period.
FC: load factor corresponding to section 3.3.1 of agreement A / 038/2019 [13].
Table 2 Monthly solar irradiance
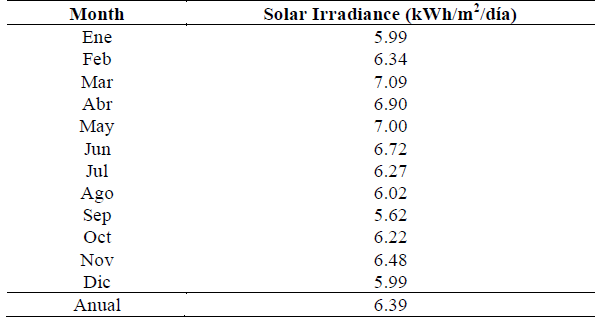
Source: Elaboration based on electricity bill information and data from LaRC [15].
As can be seen in Eq. (1), by reducing monthly energy consumption (kWh), the distribution charge is also reduced, directly impacting the electric bill.
For the collection of Capacity, the maximum Demand is also taken into account, but in this case the demand at peak times is considered according to Eq. (3):
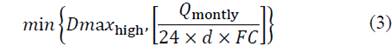
Where:
Dmax high : It is the maximum demand registered in the month during peak hours to which the invoicing in kW corresponds.
According to Eq. (3), it can be determined that by reducing energy consumption and demand during peak hours, it directly impacts the reduction of the electric bill and that it can be significant, since according to Fig. 1 the capacity charge represents 22.9% of the monthly billing. Based on the analysis of these variables of the invoice and the consumption of the user, a PV system can be dimensioned with the capacity to produce and store energy to reduce consumption in the period during these hours.
2.3 Solar resource
The level of solar radiation in the central part of the state of Zacatecas in different during the year; This variation must be considered to size the photovoltaic system to satisfy the need for energy consumption. Table 2 shows the monthly average of the available solar resource that is determined using the public database Langley Research Center (LaRC) [11], identifying that the global solar resource available is 6.39 kWh/m2/day.
3. Proposal
3.1 SFV dimensioning to reduce energy in peak period
To reduce energy consumption at peak times, it is necessary to size the generator for the energy demand for the load at this time, Table 3 shows the annual monthly average of energy consumption at this time as well as the solar radiation parameters of the place where the SFV will be installed [14].
Table 3 Data for sizing a PV system (Energy during peak hours).
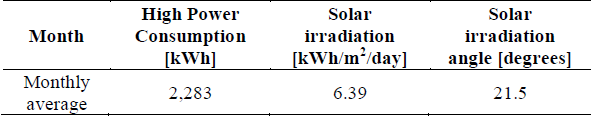
Source: Elaboration based on electricity bill information and data from LaRC [15].
In addition, a source of storage of this energy must be considered because according to peak hour consumption, it will be necessary to inject it into the grid and/or the load when there is no longer any solar radiation. In the dimensioning proposal, a battery bank was considered for storage and a battery inverter / charger was selected.
Next, the procedure for sizing the photovoltaic system to cover the energy required is described in a general way:
Determination of the consumed energy: It is obtained from the total load installed within the company from the historical annual consumption of the consumed energy.
Calculation of PV modules (generator): With the average of the energy consumed, the solar irradiation and the efficiency, the peak power to be installed is obtained. With this power, the number of photovoltaic modules to be installed is selected.
Calculation and inverters choice: When choosing the inverter, it must be considered that it must provide the power that may be connected to the system and the characteristics of the installation.
Electrical configuration of the system: The arrangement of the PV modules, the orientation and inclination, the panel distribution diagram, the connection diagram and the anchoring system must be considered here.
Calculation and choice of conductors: The recommendations of the electric current conduction capacity, as well as the protection system, must be considered.
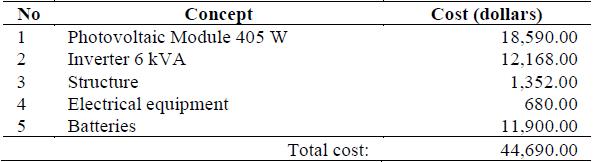
Table 4 presents the simplified economic proposal with the list of system components to reduce energy consumption during peak hours, with this system the demand will be reduced by 75 kWh per day; but they have to be injected during this time to reduce the demand that will directly influence the capacity charge, as can be seen in Eq. (3).
3.2 Proposed prototype
To verify the impact when injecting energy during peak hours, a 3.48 kWp power system is implemented and installed and is being monitored to analyze the impact on the institution's electricity rate with injection control schedules per hour, which is the proposal of the research; the generator is installed in the teaching building of the study center, since it has the available area and is free of buildings that can affect shading. Fig. 4 shows the finished installation of the 24 photovoltaic modules that will generate 3.48 kWp that will provide 16 Kwh of energy per day.

The integrated system is shown in Fig. 5, it is possible to appreciate the energy storage system [16], the inverters/charger [17], the regulators [18], the set of the system protections and the monitoring and control system.
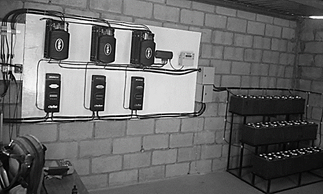
This system is interconnected to substation 2 of the institution to carry out the injection and energy monitoring.
4. Results
The proposal for the implementation of a SFV with grid connection to reduce energy consumption during peak hours is presented in Fig. 6, it can be seen that a decrease in the charge on the electric bill is achieved by 37% of the total bill.
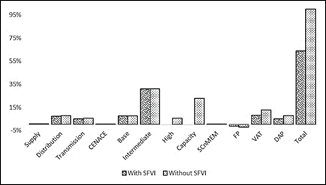
Analyzing the concepts involved in the bill that are affected by the injection of energy during peak hours, it can be seen that there is a reduction of the energy charge in peak hours and in Capacity, not to mention a slight reduction of 0.5% in Distribution and Transmission.
Capacity: A reduction of 100% is obtained, since this is determined according to Eq. (3) where the peak demand and the energy consumption in the period intervene, as this equation takes the minimum value between the demand in point that was reduced to zero then the concept of demand disappears from the monthly charge that impacts 23%. There is also a reduction in taxes as they depend on consumption charges and by reducing energy automatically this charge is reduced impacting the total cost.
In the first scenery, the cost of energy to calculate amortization does not change since the time of the installation. In other words, the cost is considered to be constant.
The second scenery considers the average increase in cost of the energy for the last 5 years of 8% which gives as a result the recovery time of four years.
The analysis of the economic feasibility of the proposal is carried out mainly analyzing the degradation of the materials, the annual increase in energy and in this case the annual increase in demand. In Fig. 7 it can be seen that the investment is recovering in the first 4 years and this recovery time may be reduced if energy prices and demand increase.
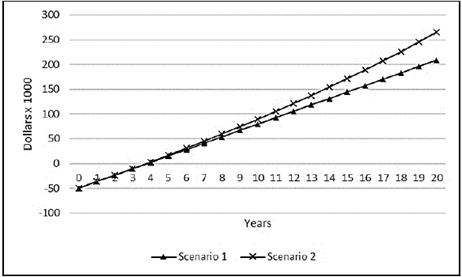
The proposal to reduce energy and demand at peak times for users in the GDMTH rate achieves a 37% reduction with investment that can be recovered in 4 years as can be distinguished in Fig. 7, noting that in the two scenarios proposed there is no difference in recovery time.
To verify the functionality of the proposed energy injection methodology, a prototype was implemented that is described in the previous ones to generate, store and manage the energy injection. The results of the reduction of energy and demand at peak times are presented below.
Fig. 8 shows the behavior curves in peak hour energy consumption, the curves are compared annually since consumption habits are similar in each period of the year. The characteristics of each of the cases are described below:
“Previous” case: The historical consumption prior to the year of prototype implementation is considered.
“Transition” case: It is the annual consumption of the year that the project was implemented and started with the injection of energy. The prototype started the injection of stored energy in June.
“Later” case: It is the consumption of the year following the implementation of the prototype.
In Fig. 8, it can be seen that the Previous and Transition curve in the months of January to June shows a similar behavior with very little difference, in registered kWh. As of July, these two curves begin to have a difference in their behavior, reducing demand on the transition curve by an average of 12 kWh per day.
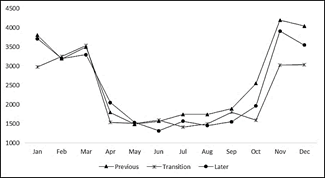
Now comparing the generation curve in the Transition period with the Later period, it can be determined that there is less consumption than in previous years where the implementation of the proposed prototype did not exist. It can be shown that the prototype correctly injects the energy during peak hours as it is reduced in proportion to the generation and storage estimate of the proposal.
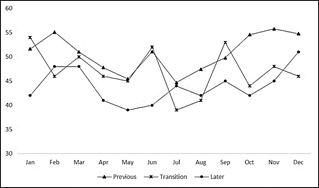
The maximum demand at peak times is the other item of the billing that is intended to be reduced by implementing an injection system at these times and to demonstrate that if there is a reduction in Chart 7, the behavior of demand at this time is shown for the cases before (Previous), during (Transition) and after (Later) of the prototype implementation.
From Fig. 9 we can conclude that from the operation of the prototype (July), there is a reduction in demand if we compare the previous curve with the transition curve, it can be found that the maximum demand at this time has an average reduction of 8 kW. We can also observe that the later curve maintains a decrease with respect to the previous curve and a similar behavior throughout the period to the section of the transition curve.
Then the functionality of the energy generation and storage of the prototype is demonstrated, as well as the energy injection methodology in a controlled manner with respect to the time during the day; it is also economically profitable to implement this type of system to reduce the totality of energy and demand in
5. Conclusions
In this research, the Great Demand in Medium Hourly Voltage (GDMTH) tariff scheme is analyzed, the option to have the installation of SFV with connection to the electricity grid and the results of the simulation are verified with the implementation of a prototype for energy management at peak times.
After analyzing the results of the implementation of PV systems connected to the network for users with TGDMH tariff and verifying the achievement of the reduction of the electric bill and with the return on investment in the 4 consequent years. The main objective of the work was accomplished by generating, storing and managing the injection of energy into the grid produced by a photovoltaic system. Where it is concluded that it is feasible since immediately a reduction in energy consumption and demand is achieved, impacting the cost of the monthly electric bill in users with hourly rates.
Regarding the implementation of a PV system connected to the network with a monitoring and control system for the injection of energy, which in this case depends on the time of day; when it is implemented and operating effectively, its functionality is verified with the reduction of energy consumption and maximum demand during peak hours
Regarding the reduction of energy costs, it can be affirmed that the reduction in demand and energy during peak hours can be achieved up to a 37% reduction in the monthly electric bill.

