


 Inglês (pdf)
 Artigo em XML
 Referências do artigo
 Enviar este artigo por email
 Citado por SciELO
  Citado por Google
  Similares em
SciELO
Similares em
SciELO  Similares em Google
 Permalink
1. Introduction
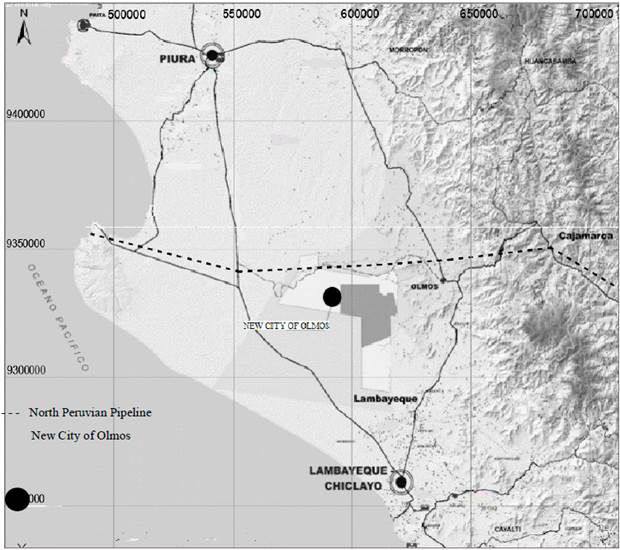
The North Peruvian Pipeline is one of the most important works in the last years. This pipeline has three branches which are the following: Branch I, branch II and ORN. In branch II, the pipeline passes through areas in the Lambayeque's region. Geological and geotechnical similar conditions were found in an area close to the structure. This area is located in the New City of Olmos, the district of Olmos (Fig.1). This city is a project that proposes a planned and self-sustaining city with modern urban criteria, located in the north of the Peruvian coast where eolian deposits lie in its entirety.
In the geotechnical exploration campaign of the project, a series of in situ tests were carried out, from which standard penetration tests (SPT) and Multichannel Surface Wave Analysis measurement (MASW) were selected in order to compare their respective records and determine an empirical correlation equation for eolian sand deposits.
In geotechnical practice, it is known that the SPT is widely accepted in different countries and has a large amount of database and correlations due to its wide use in geotechnics. On the other hand, the MASW test is a geophysical method with which a profile of shear wave velocities (Vs) is obtained, from the dispersive nature of the surface waves of soil [1-3] and whose typical field application were originally proposed by [3]. The profile of shear wave velocities is fundamental for the characterization of a site and the evaluation of its dynamic response [4].
The N versus Vs database is correlated and fitted to a potential function of the form VS = ANB, where A and B are obtained from a statistical technique of linear regression analysis to model the relationship between variables [5]. The correlations presented in this publication are: N60 - VS (N corrected to 60% energy) and N60 - VS introducing the influence of the effective overload in the model.
Consequently, the proposed correlation may be used in eolian areas, which generally occur in large areas of the Peruvian coast. Although it is preferable to determine N of SPT directly from in situ tests, there are often difficulties with respect to the execution time and cost of the test by its very nature, therefore it is a considerable advantage to propose a correlation methodology that allows a preliminary estimate of the value of N of SPT or vice versa, since they area very important data for the mechanical characterization of the site.
2. Study area and geological aspects
2.1 Study area
The study area is located in the district of Olmos, province and department of Lambayeque, Peru. The “La Nueva Ciudad de Olmos” project was developed in a program created by the Ministry of Housing, Construction and Sanitation, with the aim of creating a planned and self-sustaining city with modern urban planning criteria, to be replicated in new processes of urbanization in Peru.
2.2 Geology of the study area
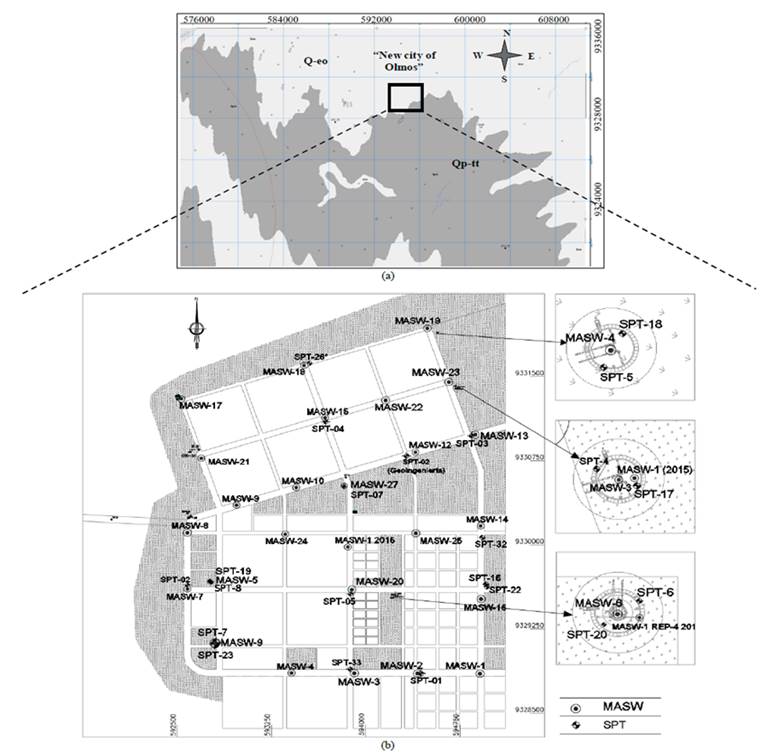
From the geological point of view, the study area is located on the eolian deposit recent of quaternary (Qr-e), as observed in the Geological Map of the Quadrangle of Las Salinas 13-c, elaborated by [6] at the Geological, Mining and Metallurgical Institute (INGEMMET), as shown in Fig. 3.
Source: The authors.
Figure 3 (a) Geological map of the Las Salinas 13c. (b) Location map of the SPT y MASW test.
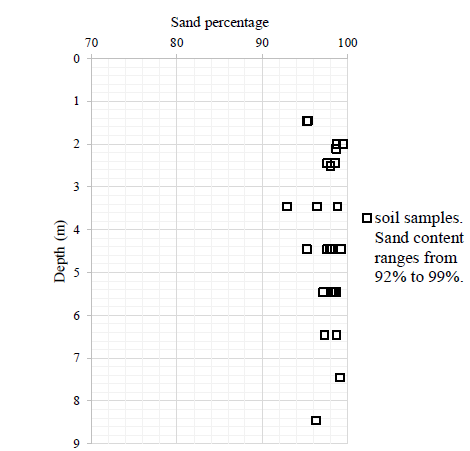
The Qr-2 deposit is composed by poorly graded sands of fine grain (Fig. 2), from loose to moderately dense compactness, in a dry state, reaching depths of 4.0 to 9.0 m according to SPT records. The Vs velocities in this deposit are generally less than 280 m/s. No phreatic level is recorded.
The Pleistocene eolian deposit (Qp-e) is underlying the Qr-e deposit, and is made up of poorly graded sand of medium grain and silty sand, of dense compactness, and the Vs velocities are generally greater than 280 m/s.
In the Seismic Zoning Map of Peru, the study area is located in the zone of greatest seismic activity, with a maximum horizontal acceleration of 0.45g in rigid soil with a probability of 10% of being exceeded in 50 years [7]. In the study area, the Vs30 is in the range of 180 to 360 m/s corresponding to Type D soil "Rigid Soil", according to the classification based on the National Earthquake Reduction Program (NEHRP).
3. Empirical correlation between N of SPT and Vs
In the literature there is a record of numerous correlations between N of SPT and the VS speeds for different types of soil, finding that these vary significantly even for the same type of soil.
Most correlations incorporate N and Vs obtained directly from the field, and some correct the value of N at 60% of energy, such as [8-12]; On the other hand, few correlations introduce the correction for effective overload to N and Vs, as the works of [11-13], among others, who introduce this correction, through a multiple linear regression analysis. [14] recently established a unified empirical correlation between Vs and N that depend on effective confining stress, fines content, and plasticity index through the conditional prediction approach, for a wide range of soil types.
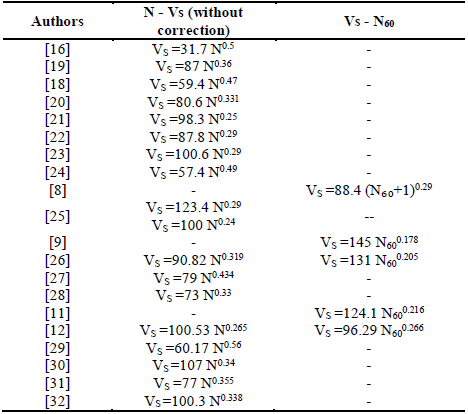
Table 1 shows the compilation of some correlations in sands, based on Vs-N (N and Vs without correction) and Vs-N₆₀. The first studies are attributed to japanese researchers between the 60s and 70s: [15-18], among others.
3.1 Data collection
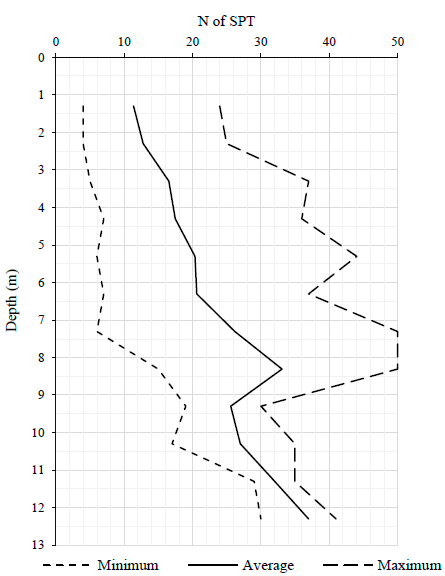
SPT remains the most current test for geotechnical site characterization. The test is simple and provides a sample of disturbed soil while measuring resistance to penetration [33]. Fig. 4 presents the compilation of the SPT tests, these present a record up to a depth of 7.00 to 12.0 m, generally the number of SPT blows is less than 30, corresponding to poorly graded sands of loose compactness to moderately dense. Some SPT tests reach a number of blows greater than 30, corresponding to the dense compact sand layer and associated with the ancient Pleistocene eolian deposit.
To standardize the number of SPT blows at 60% of hammer energy and other correction factors, the SPT test equipment and procedure was considered. Eq. (1) incorporates these corrections:
N: Number of blows of SPT
Er: Energy relation of the hammer.
CB: Correction factor for well diameter.
CR: Correction factor for rod length.
CS: Correction factor for use of standard sampler or sampler without liners.
In this study, it was considered to use an energy ratio (Er) of 70%, to estimate this value the mechanism of execution of the tests was considered; the use of a 63.5 kg Donut hammer, 76 cm fall height and 2 turns of rope on the cathead, under the same mechanism [34] propose an Er of 75%, on the other hand, [35] experimentally measured the hammer fall speed for 2 and 3 turns of rope to the cathead obtaining an Er of 69% and 42% respectively, in a test well of poorly graded sand. [36] obtained an average energy ratio of 70.5%.
The drilling diameter is 2.5” [37] proposes a correction CB=1.
No liners in the sample were used in the split cane, therefore, the correction factor is considered Cs = 1.2, according to the proposal by [37, 38].
The correction factor for rod length is followed as suggested in Table 2.

The acquisition of data from the MASW tests was carried out using a Geometrics brand 24-channel Geode Seismograph. The test scheme consists of a linear arrangement of 24 vertical geophones of 4.5 Hz frequency. The source of seismic waves is the impact of a 25-pound (11.3 kg) hammer on a metal plate.
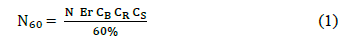
The generation of a dispersion curve is one of the most critical steps to finally generate a profile of shear wave velocities [3]. Given the in-situ conditions, the generation of the scattering image has good quality as shown in Fig. 5, where the scattering curve in the fundamental mode can be identified quite clearly.
The quality of the scattering image is due to the favorable conditions that the study area presents for data acquisition, for example; The little or almost no external noise during data acquisition made it possible to efficiently obtain records even with a single hammer blow, on the other hand, the study area presents a slight topographic variation of less than 10º. [40] point out that the dispersion characteristic can be estimated with less than 4% of error when the topographic slope along the line is less than 10º.
Constructing the scattering image and extracting the signal scattering curve is carried out through the phase shift method (also known as the wavefield transformation method), which was first described by [41].
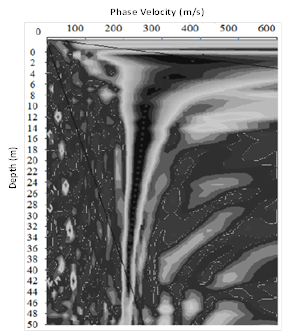
MASW tests generally reached depths of up to 30 m. Fig. 6 shows Vs velocity records down to depths from 7.0 to 12.0 for comparative purposes with the SPT tests.
3.2 The correlation equation
The potential equation (Vs = A.NB) expressed in natural logarithms results in a linear equation Eq. (2) of the form:
The natural logarithm of A y el parameter B are obtained with a simple linear regression analysis. The correlation equations obtained are Eq. (3, 4):

N and Vs obtained from field

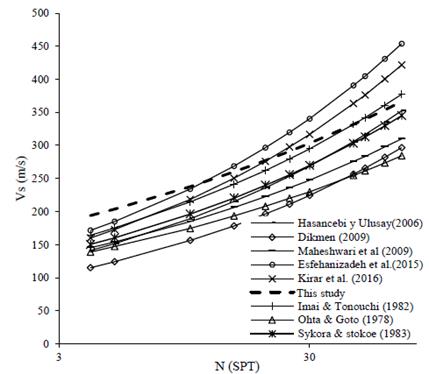
The N of SPT and Vs obtained directly from the field and the correlations in sands (without correction of N and Vs) of some authors are presented in Fig. 7 and it is observed that the curves vary among themselves, probably because N does not present correction and is dependent on the variability of the equipment and SPT test procedure. The correlation in this study is VS = 142.59 N0.222, and it generously approximates the curves of [30,32].
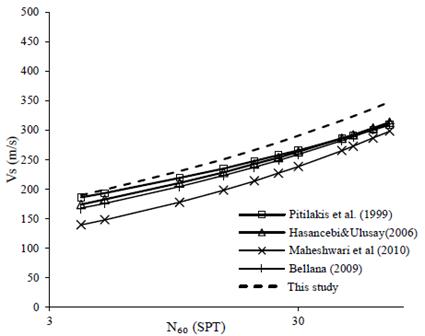
The N60 and Vs are plotted together with the correlations of other authors in Fig. 8, where it is observed that the curves present almost the same trend and are close to each other, possibly because N is corrected at 60% of energy in all cases, regardless of the SPT procedure and equipment. The correlation curve proposed in this publication (VS = 141.14 N60 0.212) is close to that of [9], who used an energy ratio of 75%, close to the one used in this publication (Er = 70%).
3.3 Correlation equation considering the effective overload correction
It is known that Vs and N are corrected differently to the effective stress Eq. (5, 6) and it is expected that these differences introduce a fit trend in the model.
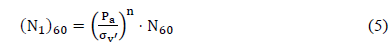

Where: σv' is the effective overload stress, Pa is the admospheric pressure and values of n and m are the differences in the way that Vs and N60 are corrected for effective overload. Replacing (N₁)60 and VS1 in the potential equation Eq. (7), Then expressing in terms of natural logarithms and ordering, the linear equation Eq. (9) in two variables is obtained (ln N60 and ln
 ):
):
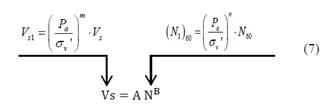
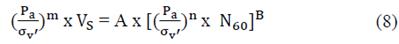
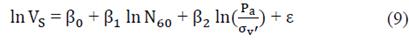
Where: β0 = lnA; β1 = B; β2 = n*β1 -m, and ε is the random error term that is normally distributed with zero mean. Table 3 shows the values of ( that were determined by the multiple linear regression analysis method and then Eq. (10) is obtained.


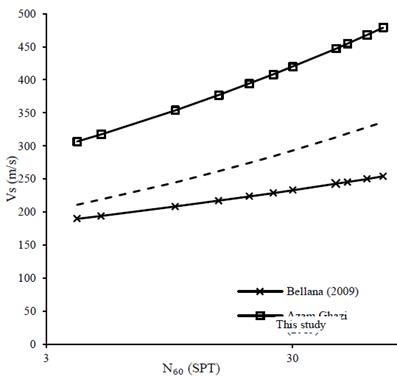
[11,13] worked the correlation of N60 -Vs, incorporating the influence of the effective overload and applying a multiple linear regression analysis to obtain the correlation. In Fig. 9, the proposed curve in this publication (VS=168.35N60 0.163) is slightly close to that of [11] and diverges from [13]. The differences would be associated with the geological nature of the soil. For example, the work in this presentation is on sand from an eolian deposit, and [13] on sands of an alluvial deposit in Mashhad, Iran.
3.4 Model Validation
Geotechnical engineering by its nature requires tools to deal with large uncertainties and variations in material properties [42]. To validate the multiple linear regression model, it is important to evaluate the data spread and the residual analysis.
3.4.1 Data dispersion
The dependent variable ln(Vs) and any of the regressor variables ln(N60) and ln(Pa/σv') are expected to have an almost linear relationship. Fig. 10 shows the dispersion of data with a linear trend between the variable ln(Vs) and the regressor variables ln(N60) and ln(Pa/σ'v), therefore, the adjustment to a multiple linear regression model is valid.
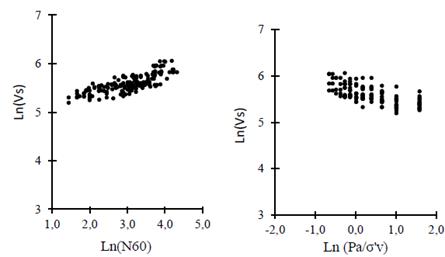
According to the data dispersion, Vs would be more related to N than to (Pa/(v') in the range of engineering interest for sands. Vs has a relative influence of (Pa/(v') and carelessness would introduce a trend in the results. This finding is significant since the effect of overload has not been directly quantified in most previous studies.
One of the hypotheses of the multiple linear regression model is that the regressor variables (ln(N60) and ln(Pa/σ'V) must not have a linearity relationship (in other words, it establishes that there must not be perfect multicollinearity on the model). If the regressive variables show a trend of linear relationship, then there are multicollinearity problems [5]. In Fig. 11 it is observed that the regressor variables do not present a linear relationship.
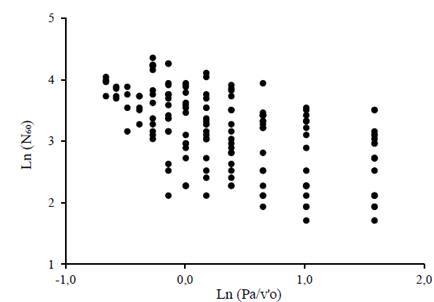
The variance influence factor (VIF) also checks for multicollinearity problems in a regression model. According to the VIF, it was verified that there are no multicollinearity problems in the regressor variables since the VIF=1/(1- R2 ajusted) is 2.96, less than 10 (R2 ajusted is 0.666).
3.4.2 Residual Analysis
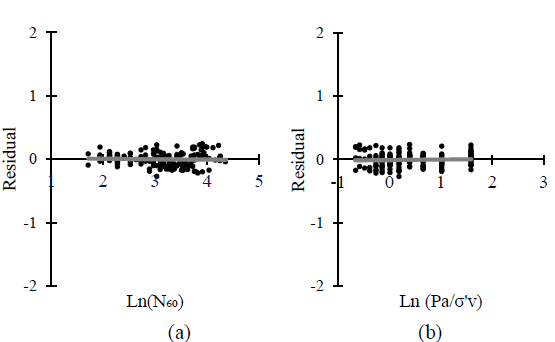
The fundamental hypothesis of the multiple linear regression model is that the residuals have a zero mean and have a normal distribution. The model residuals, defined as ln(VS) - [β0 + β1 ln(N60) + β2 ln(Pa/σ′V)] are plotted against the variables ln(N60 ) and ln(Pa /σ′V ) inFig. 12, and it is observed in both graphs that the mean value of the residuals is zero and they do not present a trend or bias with respect to ln(N60 ) and ln(Pa /σ′V ), which indicates that the regression has eliminated the trend with respect those input variables (explanatory variables of the regression model).
Source: The authors.
Figure 12 Residuals of the multiple linear regression model for sands. (a) residual versus ln(N60). (b) Residual versus ln(Pa/σ'V).
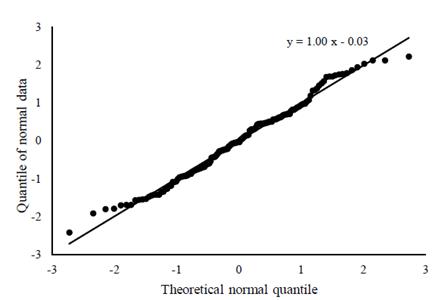
The residues present a normal distribution with a diagonal straight-line trend in the quantile - quantile (Q - Q) graph. Fig. 13 shows some deviations in the extremes that could be associated with the sampling variability since the data in the tails are often not well sampled and are generally called atypical points.
4. Conclusions
Eq. (11) is the correlation N60 - Vs. Eq. (12) is the correlation of N60-Vs, including the effective overload correction to Vs and N60, the latter was determined with a multiple linear regression model. The hypothesis of the model was verified in Item 3.4:
In the data dispersion, the dependent variable presents a linear or almost linear relationship with each of the regressor variables and the regressor variables do not present a linear relationship.
In the residual analysis, these have a zero mean and present a normal distribution in the quantile-quantile (Q-Q) graph.


The correlations proposed in this publication are intended to be used to obtain a preliminary estimate of N or Vs where they are not available, and will not be used as a substitute for field measurements, as they may contain considerable uncertainties. The geological conditions of the study area make the correlation proposed in this publication applicable in eolian sand deposits.

