


 Inglês (pdf)
 Artigo em XML
 Referências do artigo
 Enviar este artigo por email
 Citado por SciELO
  Citado por Google
  Similares em
SciELO
Similares em
SciELO  Similares em Google
 Permalink
1. Introduction
Heavy oil is an important energy source accounting for 70% of reserves worldwide [1]. Heavy oils are characterized by having high viscosity, impacting its mobility at reservoir and surface conditions. In order to increase oil mobility, thermal-based methods, such as steam injection and in-situ combustion, have been deployed in heavy oil reservoirs [2]. Heat injection in heavy oil reservoirs has many advantages, such as viscosity reduction, volatilization of light components (steam distillation), (liquid) gravity drainage due to condensation of steam, and thermal expansion that increases the reservoir energy [3]. Steam injection began around the 1930s with pilot tests in the United States, Russia, and the Netherlands. The success of pilot tests made possible a higher scale implementation [4,5]. In Colombia, the Teca field, located in the Middle Magdalena basin, is one of the most important projects having a cyclic steam injection at the field scale. Up to date, the overall recovery factor of the field is 15% [6]. To increase recovery, oil companies usually switch from cyclic to continuous steam injection. The problem arises when energy is not available to continuously generate the steam during the lifetime of the project. This is the situation faced by heavy oil fields located in the Magdalena Medio valley.
In recent years, a new technological approach has become an option to enhance oil recovery: the co-injection of light gases (such as carbon dioxide, nitrogen, methane, ethane, propane, or flue gas) with steam. Light gases injection experiments have shown an increase in available energy to produce reservoir fluids. Also, gases like flue gas and propane have worked as solvents to decrease the interfacial tension, reducing the immobile oil fraction [7]. Experiments in micro-models [8] showed how gases bubbles can be trapped in the pore space, diverging the injection fluid towards non-contacted areas. The oil swelling effect might occur when light gases contact the oil [9], facilitating the mobility towards the production wells. The light gases also increase the thermal efficiency by reducing the energy losses through the top seal cap [10-12]. When light gases are injected into the reservoir, they tend to migrate upwards by gravity overdrive. Therefore, the co-injection technique can be extended to low-thickness reservoir zones having a near water-oil contact, making the thermal efficiency higher than that of the conventional steam injection.
Full-field implementation of the co-injection technology requires a full understanding of the interaction between oil and reservoir characteristics with the injected gas composition. Thus, deployment strategies can be designed to maximize the economics of the project. To that end, rigorous reservoir simulation studies can be employed. A recent implementation [13], used numerical modeling to design a pilot test in a heavy-oil field located in Magdalena Medio basin, Colombia. The pilot study evaluated the viability of using nitrogen during cyclic steam injection operations. Keeping gas and steam rates fixed, injection times and stages were assessed using a reservoir simulator. Field results showed that, once co-injection started from the sixth cycle, oil production increased, achieving production rates similar to those obtained during the third cycle. The incremental cumulative oil production was 6877 barrels, being very close to the one predicted by the simulations (5642 bbl). One drawback of this approach for a full-field deployment is that nitrogen separation is expensive, requiring vast amounts of energy for cryogenic separation from air.
An alternative option is the use of flue gas as a co-injection gas. Flue gas can be collected from steam boilers and other equipment of the field and further cleaned and dehydrated to be injected in the wells. Flue gas has 80% approximately of nitrogen and 20% of carbon dioxide. Flue gas is a promissory gas to be co-injected with steam in heavy oil reservoirs due to its physical properties and its low cost. Experimental studies [12, 14] show that flue gas can improve the oil recovery factor. Authors had found that flue gas raises the oil production rate and recovery factor depending on the stage it is injected. In addition, observations show the formation of a foamy oil, which can lead to higher recovery and higher flow rates because of its enhanced mobility. Since nitrogen and carbon dioxide can interact with reservoir fluids, the co-injection of steam and flue gas must be done following a compositional approach. Therefore, thermal-dependent-compositional effects must be accounted for in a thermal reservoir simulation for studying flue gas - steam coinjection.
The objective of this paper is to analyze the impact of flue gas and nitrogen co-injection in a cyclic steam stimulation process using a rigorous thermal - compositional approach. Here, the impact of the gas/water ratios, gas composition, and operational parameters on the process efficiency for a Colombian well is presented. A constant flue-gas composition is employed in the study.
First, the properties of a heavy oil model were matched with experimental data using experimental PVT tests and a cubic equation of state (EoS). Critical properties of the heaviest fraction and binary interaction coefficients were adjusted to give a final characterization of 8 pseudo-components. Then, a cyclic steam stimulation was emulated during three cycles, and the same conditions were replied for different gas/water ratios, maintaining the cumulative equivalent water volume. By changing the composition of the injected gas, the best case was selected and optimized using different injection conditions. Finally, the long-term performance of the best case was evaluated by changing different injection schemes during the life-time of the well.
2. Mathematical model
Flow equations have been extensively applied in reservoir simulation to include several flow mechanisms and complex component interactions (reactions, adsorption, degradation, etc.). In this section, only a short explanation of the mathematical model is presented. All simulations were done in a commercial reservoir simulator [15]. Given that CO2 interacts with oil, and the process changes the internal energy because of the steam injection, the reservoir simulation must be compositional and coupled to an energy balance equation. The description of a non-reactive material balance of species over a representative elementary volume (REV) is presented in eq. (1). Diffusion and dispersion are discarded, and advection is taken as the main transport mechanism.
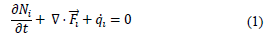
Subindex represents the i th component out of a total of n i components. The first term describes the accumulation of moles per bulk volume unit, the second one represents the divergence of the flux across the surface of that bulk volume, and the third one is associated with the source/sink terms. Because steam transports internal energy during the injection, an energy balance must be done to quantify the temperature distribution along the reservoir. Considering convection and conduction as the main energy transport mechanisms, the balance is expressed in eq. (2).
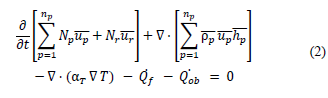
where subscript p denotes liquid phase, T is temperature, u is the internal energy, and h the enthalpy. ( T is the total conductivity and Q˙ represents sinks/source terms, such as the heat injected or produced through fluids and the heat losses through the adjacent rocks. This equation assumes a local equilibrium between rock and phases [16]. The modeling of hydrocarbon phase behavior can be done in two ways. The first one is by using a cubic EoS, if the range of pressure, temperature, and composition lies within a confidence interval where the equation is stable. The second approximation, that gains in computational velocity and numerical stability, but reduces accuracy, is the use of tabulated or correlated equilibrium ratios (K i ). These rations can be obtained from a stable EoS or experimentally, but in general, can only be a function of pressure, temperature, and a reference component molar fraction. In this study, the second approach is used. Water enthalpy is taken from tabulated values, while gas enthalpy is described by mixing rules, using a polynomial form to calculate each pseudo-component enthalpy. For the oil phase, a vaporization enthalpy must be subtracted from gas enthalpy, computed from actual temperature and single component critical properties.
3. Methodology
A heavy oil fluid from a Colombian reservoir is characterized. The objective is to find out how different gas compositions at variable gas/water ratios impact the oil recovery during a cyclic steam stimulation (CSS). Thus, nitrogen and flue gas (approximated as a mixture of 80% diatomic nitrogen (N2) and 20% carbon dioxide (CO2) in weight) were co-injected with steam (one gas at a time) during three stimulation cycles. For all scenarios, the total injected water remained constant at a steam quality of 70%. Based on the analysis of the results, the best case was optimized to achieve the maximum oil recovery, maintaining the total injected water volume. The injected gas volume is optimized to maintain the final oil recovery.
3.1 Compositional characterization
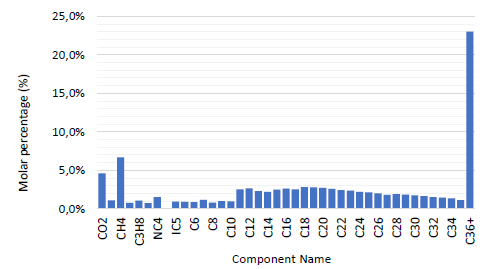
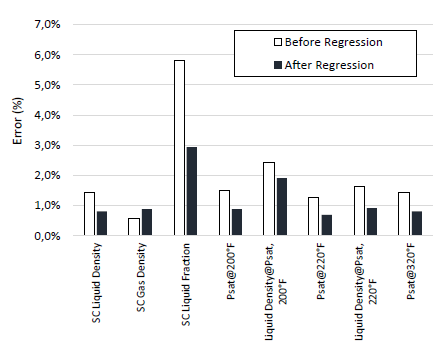
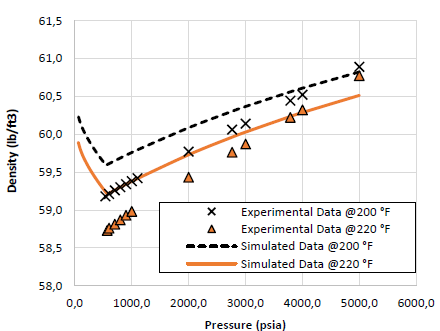
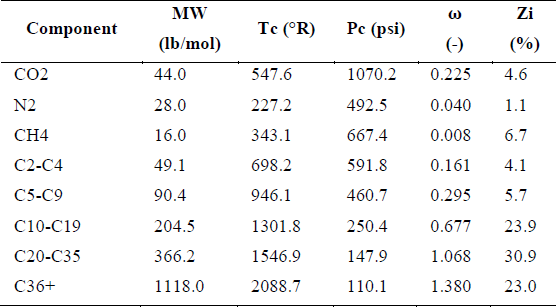
Live and dead oil compositions, as well as density and viscosity at different pressures are available to calibrate the EoS. The live oil composition contained traces of N2 and CO2, which facilitates the characterization of interaction coefficients between these components and heavy oil fractions. Detailed composition up to the C36+ fraction, from high-resolution capillary gas chromatography, is depicted in Fig. 1. To match experimental data, the following parameters are adjusted: critical volume of heavy fractions, temperature-dependent volume shift, binary interaction coefficients, and viscosity parameters of the corresponding state's model. Constant composition expansion, flash at standard conditions tests, density, as well as saturation pressures, were matched with high accuracy (see Fig. 2). Errors are lower than 1% for saturation pressures, and approx. 2% for densities, in a pressure range between 200 psi and 5000 psi.
Source: own elaboration.
Figure 1 Molar fraction distribution of oil components, which includes constituents from C 1 up to C 36+ fractions.
Source: own elaboration.
Figure 2 Error percentage of adjusted thermodynamic properties. Regression allowed a reduction in deviation values, especially in densities and saturation pressures.
Additionally, the measured and calculated live oil densities are presented in Fig. 3.
Source: own elaboration.
Figure 3 Density values from experimental and simulation live oil density at 200°F and 220°F.
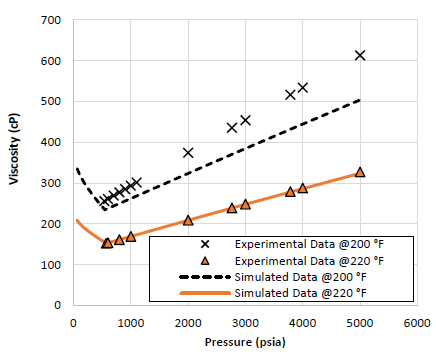
To calculate the heavy oil viscosity, Pedersen [2] suggests the use of the corresponding state's model. Measured and estimated viscosity for 200F and 220 F is presented in Fig. 4. A good agreement between EoS results and measurements is observed in Fig. 4. At 220°F errors are lower than 1%. However, at 200°F, deviations are higher, having an average error of 11%. These results indicate that further work must be done during the numerical description of heavy oil viscosities.
The final component properties are listed in Table 1. Eight components were selected because this lumping produces envelope errors lower than 5%, and to allow CO2 and N2 to be injected separately.
3.2 Reservoir conditions and rock type
Static model: The reservoir consists of a cylindrical drainage area at a depth of 1000 ft, with an external radius of 500 ft. Net sand thickness was settled to 200 ft, discretized vertically to account for gravity segregation. Horizontal and vertical permeabilities were 2000 mD and 200 mD, respectively.
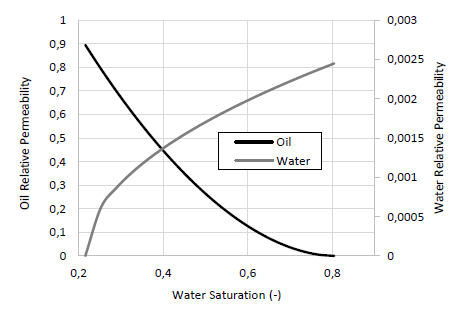
Rock type: Oil and water relative permeabilities are presented in Fig. 5. These curves were adjusted to represent an actual heavy oil displacement experiment with brine at 176°F.
Source: own elaboration.
Figure 5 Relative permeability curves for heavy oil and brine in a high permeability rock.
It is common to find that aqueous phases hardly sweep the oil, reducing the water conductivity when displacing heavy oils [17]. The actual cross point in a one-axis graph is located near 78% water saturation, allowing the oil to flow easier than water in a wide saturation window. Although high temperatures might decrease S values [3, 18], in this study residual oil saturations were kept constant to observe the main compositional effects of gases on heat transport and oil properties.
Initial conditions: A water-oil contact (WOC) is located at 1200 ft, where the initial reference pressure was 1000 psi. The bottom aquifer is not active and does not transfer water to the reservoir. The initial temperature is 176°F.
3.3 Dynamic model: operational restrictions and injection composition
CSS consists of a series of stages, where steam is injected into the reservoir and then is left soaking for several days. Thus, production is started with an enhanced oil rate due to several physical interactions (viscosity reduction, residual saturation modifications, heavy oil mixing with intermediate components, among others) [3, 19]. In all simulation cases, the first year corresponds to a cold production period at a well bottom hole pressure of 700 psi. Once this stage is finished, the CSS operation starts. Three injection/soaking/production stages were simulated, at the end of which the cumulative oil was compared, as well as other operative variables such as injection pressure and flow rates. All cases share the cold-water injection rate of 3000 bbl/day. Sensibility to the amount of gas was evaluated by changing the gas to water ratio (GWR), expressed as a volume ratio of gas to water rate.
3.3.1 Base case
CSS starts by injecting steam with a quality of 70%. The equivalent (cold) water rate was fixed to 3000 bbl/day, which resulted in bottom hole injection pressures below 2000 psi. Temperature ranges from 500°F to 600°F due to well pressurization. Steam is injected during four days in the first period and during ten days in the last two cycles. This represents a total amount of 72000 bbl of injected water. Each cycle had a soaking time of six days. Thus, a total of 1460 days were simulated. In the base case, no gas is co-injected with water.
3.3.2 Light gases co-injection with steam
The gas injection requires the specification of the composition and the GWR at which the stream will be injected. To delimit the search of an optimal GWR, a prior sensibility to GWR showed that below 200, no production enhancement was evinced, while no extra recovery was obtained for GWR values beyond 600. This allows specifying three GWR values to evaluate: 200, 400, and 600 gas/water ratio. Steam quality and injection temperature are kept constant, while gas compositions were fixed as follows:
N 2 : Nitrogen was co-injected at GWR values of 200, 400, and 600. These ratios represent nitrogen gas rates of 3.4 MMscf/day, 6.7 MMscf/day, and 10.1 MMscf/day, respectively. The volumetric fraction of water varies from 0.2% up to 5%. Cases are denoted by N200, N400 and N600.
Flue gas: A mixture of 80% nitrogen and 20% carbon dioxide (w/w) was chosen to represent the flue gas composition. The flue gas rates are the same as the ones employed for nitrogen cases. Cases are denoted by FG200, FG400 and FG600. CO2 injection rates were calculated as 0.46 MMscf/day, 0.92 MMscf/day, and 1.4 MMscf/day in the 200, 400, and 600 GWR cases, respectively.
4. Results and discussion
The first results section contains the analysis of numerical results, changing gas compositions (flue gas and nitrogen) and GWR. The second section employs the best case to optimize the well operational restrictions.
4.1 Optimization of injected fluid composition
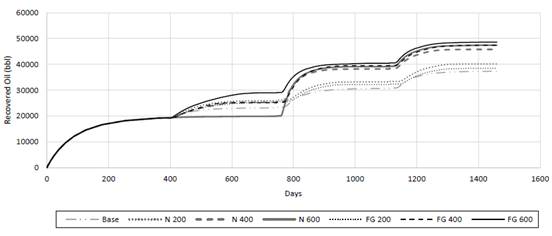
Oil recovery factors for steam and its co-injection with nitrogen and flue gas are shown in Fig. 6 and summarized in Table 2. The final recovery in the base case reached approximately 37000 bbl of oil. Both, N2 and flue gas, caused an increment in the recovered oil, with an increasing behavior for higher GWR. Co-injecting gases and steam, the recovered volume can be as high as 48600 bbl (FG600). Moreover, maximum recovery is very similar for the N600 and FG400. Also, Fig. 6 shows that nitrogen injection at 600 GWR does not give an additional recovery during the first cycle, and even gives less oil production than the base case. This effect is due to the high injection pressures required to inject the nitrogen, exceeding the 3500 psi limit and preventing the well to inject the desired mixture. Although well constraints can be adjusted to overcome this numerical event, it was desired to use this result as a warning for field operation design, due to high injection pressures requiring more powerful pumps and representing higher energy consumptions and costs at field scale implementation.
Source: own elaboration.
Figure 6 Oil recovery volumes for 7 simulation runs. FG stands for flue gas, while N for nitrogen. Gray curves are assigned to N 2 results, while black curves describe flue gas results.
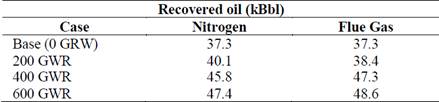
Results indicate that the highest recovery is reached using flue gas at 600 GWR. Below this limit, it is noted in Table 2 that oil recoveries from N400 and N600 are very close to the recovery with flue gas at 400 GWR (FG400). As stated previously, both, FG200 and N200 do not impact significatively the produced oil in relation to the base case. However, during the first cycle, the N200 and FG200 recoveries for both gases are similar to these from N400 and FG400 respectively, as observed in Fig. 6. The latter suggests that a cost-effective deployment can be optimized by switching the injected gas ratio for subsequent cycles. Another phenomenon seen in simulations with 400 and 600 GWR for both gases, is that the additional recoveries obtained during the first cycle are not as high as the ones from the second cycle. This confirms previous experimental results [7], where it was concluded that nitrogen injection should be performed after a certain number of steam cycles have been completed. Nitrogen provides a thermal isolation effect that can be used in subsequent injection cycles to increase the CSS performance.
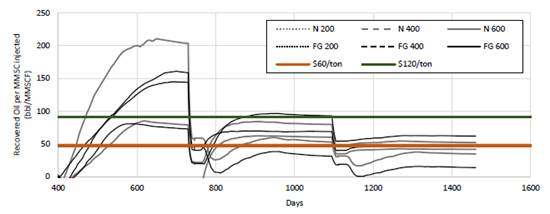
To visualize the economic performance, a new variable is analysed for all scenarios: incremental oil recovery per million standard cubic feet of injected gas (bbl/MMscf). This variable accounts for the enhancement of oil volume production relative to the total injected volume of gas. Different studies have reported the cost of gas injection for EOR between $60/MMscf and $120/MMscf [13,20,21]. The costs are expressed as oil barrels per MMscf (with a price of $67 per barrel). Results, presented in Fig. 7, show that none of the scenarios evaluated here provides an optimal performance along the cycles. During the first cycle, the best injection gas seems to be the nitrogen at 200 GWR, producing 200 bbl per injected MMSCF. This performance is reduced over the years, falling below the economic limit during the second cycle, and is completely uneconomic at the beginning of the third cycle. The obtained recoveries from the N400 and FG400 cases were higher than the economic limit, as noted in Fig. 7.
Source: own elaboration.
Figure 7 Additional recovered oil per million standard cubic feet of gas injected. The thick blue line represents an economic limit for an injection cost of $120/MMscf, while thick dark orange represents an injection cost of $60/MMscf.
It is worthwhile to mention that the additional recovery estimated here does not consider any residual oil saturation reduction from flue gas injection. Studies reported in [9,10,22 and 23] indicate that flue gas reduces the residual oil saturation. This feature makes flue gas a desirable injection gas because it also combines the isolation capability of the nitrogen and the swelling & solvent properties of carbon dioxide. Another important observation is that nitrogen could be co-injected at stages where there exists a water column encircling the well after steam has been condensed from previous cycles. In these cases, nitrogen is able to connect the well with undrained oil zones and reduce the heat losses between steam and previous condensed water. Thus, the flue gas was selected as the injection gas to be co-injected with steam at a gas water ratio of 400. However, pure nitrogen at 200 GWR will be simulated as a supplement during previous cycles, due to its additional recovery at the end of the first cycle (see Fig. 7). The next section develops a sensibility analysis of operational parameters when using the selected gas composition.
4.2 Optimization of operational parameters
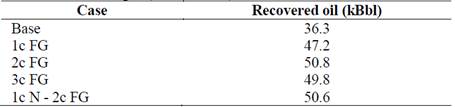
The scope of this stage is to find an optimal proposal for field implementation based on the previous results. Here, five cases were analyzed, each case varying the cycle where the gas starts to be co-injected. It is worth saying that the first stage for all simulations corresponds to a cold production, before injecting steam or steam-gas. The first case is the same base case from section 4.1 (denoted by “Base”); the second case corresponds to the flue gas injection at 400 of GWR during all three steam cycles (denoted by 1c FG); the third case employs the flue gas injection only for the second and third cycles (denoted by 2c FG); the fourth case is the same than the base case, except that flue gas is injected in the third cycle at the optimal GWR (denoted by 3c FG); final case uses nitrogen in the first cycle, and then injects flue gas in the second and third cycles (denoted by 1c N - 2c FG). The latter scheme is proposed because nitrogen showed the best oil recovery per gas injected at 200 GWR during the first cycle. The equivalent cold-water rate was reduced in all cases to 1500 bbl/day, and injection time was increased by a factor of 2. This reduction is intended to control the bottom hole pressure during steam-gas co-injection.
Due to a high injection volume, the injection pressure is increased, forcing an increase in the injection temperature. Operatively, the heater and surface pumps would need a higher capacity, and thus both the OPEX and CAPEX would increase. At 3000 bbl/day of equivalent water, and for almost all GWR evaluated, well bottom hole pressures were estimated between 2000 psi and 3000 psi. At 1500 bbl/day and 400 GWR, well injection pressures remain below 2000 psi. This change causes a reduction of only 2.67% in baseline recovery. Cumulative oil behavior is presented in Fig. 8 and the final recovery is summarized in Table 3.
Table 3 Recovery volumes for optimization runs. Flue gas was injected in the first cycle (1c), during the first two cycles (2c), during all three cycles (3c), and combined with nitrogen (1c N - 2c FG).
Source: own elaboration.
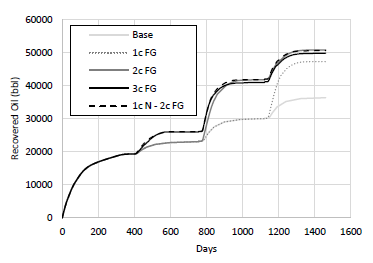
It is observed in Fig. 8 an incremental oil production of approximately 11000 bbl respect to the baseline can be achieved in the case 1c FG. The injections during two or more cycles can give an extra cumulative volume between 1500 bbl and 3600 bbl of oil.
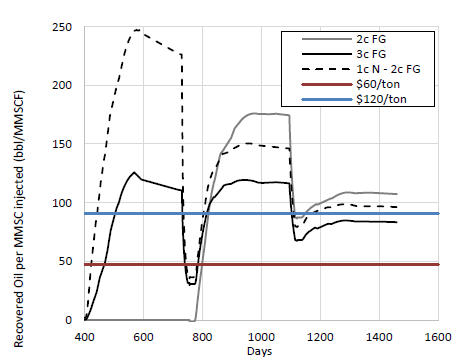
The operational restrictions injecting gas during two or more cycles cause recovery oil to vary in a narrow interval. All these cases increase the recovery in about 14000 bbl of oil, in relation to the base case. To discriminate the performance of each case, Fig. 9 illustrates the additional recovered oil per MMscf of gas injected. An optimized scheme places the extra oil production over the limit line of $120/ton cost for gas injection (blue line). It can be reached by using just 2 cycles of flue gas (2c FG) or using 1 cycle of nitrogen and then 2 cycles of flue gas (1c N - 2c FG).
Source: own elaboration.
Figure 9 Additional recovered oil per million standard cubic feet of gas injected with optimized parameters.
According to [22], gas prevents the heat exchange between steam and condensed water, attributable to their lower heat capacity and low thermal conductivity. However, the drop in temperature over the reservoir was approximately the same in all simulation cases, indicating that this fluid model cannot capture the explained phenomenon.
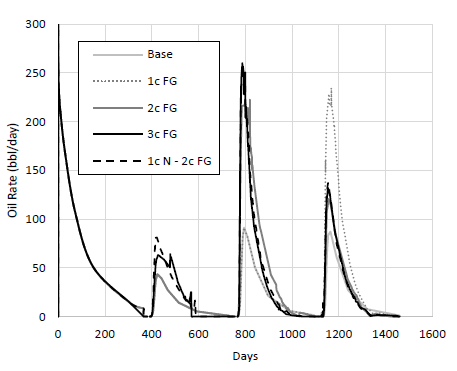
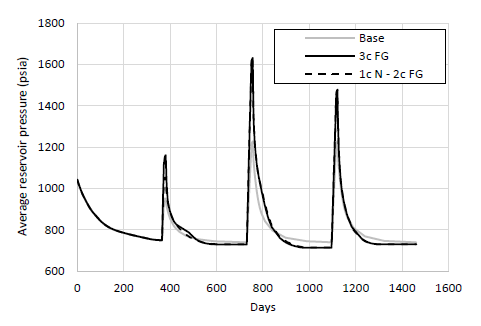
Fig. 10 depicts the oil production for the evaluated conditions, while Fig. 11 compares the average reservoir pressure for the base case and optimized cases. In Fig. 10, an improvement in oil production is observed when using gas co-injection. The first cycle in all cases shows a lower production enhancement compared with the second and third cycles. This can be due to the zone not being heated enough to decrease the oil viscosity. As the stimulated drainage area is higher, the oil production in subsequent cycles increases, reaching peaks of about two times the rate of the baseline. During the production stage, the gas expands due to its compressibility, driving more oil towards the well, along with a swelling effect and viscosity reduction. The “1c FG” case in Fig. 10 shows that gas co-injection can enhance the oil peak for the first time despite the number of previous cycles, indicating that energy addition is maximized during the first co-injection cycle. Also, as can be seen in Fig. 11, the synergy of these effects can keep the average reservoir pressure around 20% to 30% above the average pressure for pure steam injection.
Source: own elaboration.
Figure 10 Oil production for optimization runs. The number beside the gas type indicates the number of cycles where gas is being co-injected.
Source: own elaboration.
Figure 11 Average reservoir pressure comparison for the base case and steam-gas co-injection with optimized parameters.
The case having the highest performance is the one co-injecting gas after the first steam injection cycle with a volumetric gas-water ratio of 400. This case gave the best total oil recovery with the best economic cost per extra produced oil barrel. In the following section, a long-term evaluation of this case is presented.
4.3 Long-term light gases co-injection
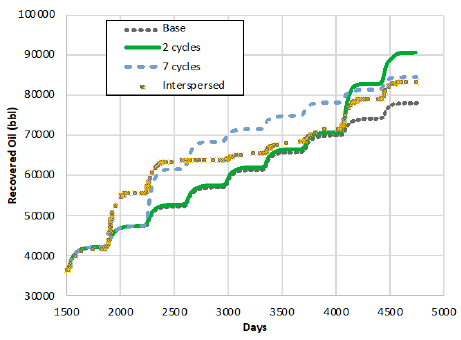
In previous sections, the flue gas significantly increased the oil production when injected in 2 of the 3 stimulation cycles. However, it was not clear how the flue gas could behave during a long-term injection. To better answer this question, we have employed the previous results to simulate the steam and gas co-injection during 12 injection cycles. Although different injection schemes were simulated, only the best four cases are analyzed: a base case with no gas injection (denoted by “Base”); ten steam cycles followed by two cycles of co-injection (denoted by “2 cycles”); five steam cycles followed by seven steam cycles (denoted by “7 cycles”); and finally, an interleaved injection, when each steam cycle is followed by a co-injected cycle (denoted by “Interspersed”). The cumulative oil production for all cases is presented in Fig 12. As all the cases share the same behavior up to the fourth cycle, only production after day 1500 is depicted.
Source: own elaboration.
Figure 12 Long term oil recovery for several co-injection initiation times. The best case reaches more than 90,000 bbl of oil.
The “Base” case reaches about 78000 bbl. Comparing this result with the “2 cycles” case, we can observe a significant improvement in production, reaching a recovery of 90300 bbl. For the “7 cycles” simulation, production reaches 84270 bbl, about 4000 bbl less than the “2 cycles” and requiring 3.5 times the volume of flue gas. This finding allows us to remark that the gas co-injection should be performed during the last cycles of the productive life of a steam-stimulated well, as the gas presence at early stages may reduce the further contact of steam and the heavy oil. The “Interspersed” case also shows an interesting fact about co-injection. Although flue gas accelerates the oil recovery during two first co-injected cycles (increments about 13700 bbl and 8100 bbl), the following cycles with pure steam produce increments of 139 bbl, 1830 bbl, 2940 bbl, and 3246 bbl. All these values are under the average oil recovery per cycle of the “Base” case (4900 bbl). Results show that gas may mask the effect of subsequent steam injections, reducing the expected incremental recovery per cycle. This reduction is evinced as well by the “7 cycles” simulation after day 3000. Thus, “Interspersed” and “7 cycles” cases reach about the same recovery (they use about the same co-injection cycles, 6 and 7, respectively).
Results point out that gases and steam co-injection, attempting to increase energy and solubility, can trigger a negative effect if the gas phase starts to saturate the media and creates a column that prevents the steam-oil contact. This is a phenomenon that numerical simulation is able to capture to quantify this shielding phenomenon to prevent poor pilot test outcomes.
5. Conclusions
Steam-gas co-injection during CSS is a technique able to increase oil production in heavy oil reservoirs. In the case studied here, incremental oil recovery can be enhanced by up to 40% considering the gas drive, oil swelling, and steam isolation as the main extra recovery mechanisms. Other enhancing effects, such as residual oil mobilization, might increase this value when applying optimized operational parameters in cyclic steam stimulation processes.
A thermal shielding effect takes place when gas co-injection is performed at the early cycles of the CSS, reducing oil production during the next cycles. Once the performance of the CSS is significantly reduced, it is recommended to co-inject steam and flue gas. The case presented here showed that co-injection at 400 GWR at temperatures between 500°F and 600°F, has the best cost-effective impact over the recovery factor. Other systems must be studied by using field data and numerical simulation.
The compositional simulation requires about 6 or 8 pseudo-components to obtain representative results for this type of process. Numerical models based on equilibrium ratios tabulations cannot capture all compositional phenomena taking place during the heat and matter transport in porous media. Interfacial tension changes, predicted with a tuned EoS, may represent the miscible displacement occurring when CO2 is injected in oil reservoirs.

