


 Inglês (pdf)
 Artigo em XML
 Referências do artigo
 Enviar este artigo por email
 Citado por SciELO
  Citado por Google
  Similares em
SciELO
Similares em
SciELO  Similares em Google
 Permalink
1. Introduction
Modern cultivation techniques with high land use rates and intense mechanization cause changes in soil attributes, influencing production, natural resource balance, and soil water dynamics [8,14,32]. Inadequate cultivation causes soil degradation due to compaction, degradation of organic matter, and modification of the structure, negatively altering the physical, hydraulic, chemical, and biological properties of the soil, causing damage to crop yield [2,27].
The evaluation of hydrodynamic properties in the soils of an area assists in the study of soil behavior in areas under agricultural management, degraded and recovering [19], highlighting the texture, pore size distribution, compaction, surface sealing, runoff, soil infiltration and soil hydraulic conductivity [24]. Soil physical quality can be designated by the interaction of factors that directly affect crop development through soil water infiltration [16]. Thus, knowledge of soil hydrodynamic characteristics, such as saturated hydraulic conductivity, is essential for the management of watersheds [2,26].
The characterization of the hydrodynamic properties of the soil by the Beerkan methodology has been widely used because it has field application, low cost, and simple execution, just the soil water infiltration curve and soil texture [3,27,31,32]. Currently, in the literature, there are studies with the Beerkan methodology to evaluate the spatial variability of soil hydraulic conductivity [2,10,23,25,29,32]. However, few studies are carried out in alluvial soils, which are very fertile; due to this characteristic, intensive and highly heterogeneous agriculture is practiced.
The spatial distribution of physical, chemical and biological soil properties is directly related to intrinsic variations in soil characteristics, vegetation and climate. But they can also be affected by exogenous anthropogenic factors associated with agricultural production, such as soil preparation and fertilization [5,10,17,29].
Traditional statistical methods are often used to describe the variability of soil properties in the field and find that the variation occurs at random in the samples. The application of geostatistics, based on the theory of regionalized variables, is more efficient in characterizing the spatial variability of the variables, allowing the identification of spatial dependence and the creation of maps, estimating values in unsampled locations, based on semivariogram models [4], being particularly relevant for highly heterogeneous fields.
The spatial distribution of soil attributes can be evaluated by the use of geostatistics, which is applied mainly in geological and hydrological fields and may represent regions of different permeability in soils [11,21]. Thus, the objective was to evaluate the spatial dependence of soil particle size (sand, silt, and clay) and saturated hydraulic conductivity in compacted alluvial soil, applying the Beerkan methodology.
2. Material and methods
2.1 Study area characterization and Sampling
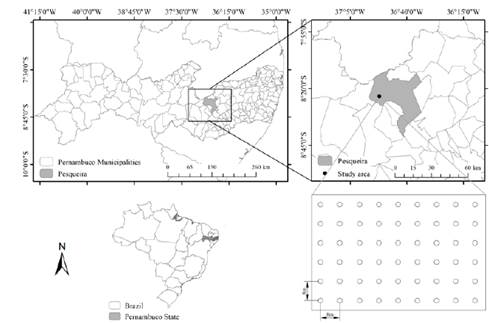
The study was carried out in an alluvial area of Vale do Mimoso, located in the Upper Ipanema River basin, where small-scale irrigated agriculture is conducted, located in the municipality of Pesqueira, State of Pernambuco, Brazil (Fig. 1). The location is found at the following geographic coordinates: longitude −36º87', latitude -8º39' and altitude of 645 m.
Source: The Authors.
Figure 1 Geographic location of the study area in the municipality of Pesqueira-PE, Brazil, and sampling points in the experimental area.
Upper Ipanema River Basin, next to the Hydrology Network of the Semi-Arid Region (REHISA), is a sub-basin of the Ipanema River system in its westernmost portion. This basin covers part of the municipalities of Arcoverde and Pesqueira, in the state of Pernambuco, with an area of 194.82 km2. The basin has an average yearly rainfall of 672 mm, an average annual air temperature of 27.4 ºC, and average potential evapotranspiration of 1600 mm year−1 [20]. According to the Brazilian Soil Classification System (SBCS), the basin soils are distinguished in Yellow Argisol, Red-Yellow Argisol, Fluvic Neosol, Regolithic Neosol, and Litholic Neosol. However, in the present study, the soil type of the area is Fluvic Neosol. The climate of the region is BSsh type (i.e., extremely hot, semi-arid), according to Köppen’s classification.
The experiment was conducted in an area with a regular grid spaced by 8.0 x 8.0 m, forming an 80 x 50 grid, totaling 40 sampling points.
2.2 Physical and hydraulic properties
Infiltration tests and soil sampling were performed in the sampled grid to obtain physical and hydraulic properties using the Beerkan method [18]. The infiltration tests were performed with a single-ring infiltrometer, providing three-dimensional infiltration. The tests were performed according to the following operating procedures:
a) A PVC (Polyvinyl chloride) cylinder with a diameter of 200 mm was positioned on the ground surface and inserted to a depth of approximately 1.0 cm. The method takes into account only the hydrodynamic characteristics of the topsoil, and the deepening of the cylinder is only to prevent lateral water loss during the infiltration process.
b) Fifteen volumes with 200 mL of water were prepared and poured into the cylinder. The first volume is poured into the cylinder, and immediately after the cylinder is emptied, then another volume of water is poured into it, always taking note of the time each volume takes to infiltrate the soil. This procedure is repeated successively for the 15 volumes until the last volume of water is poured into the cylinder, and the test is terminated if the infiltration rate is constant.
For soil texture (sand, silt, and clay) and organic carbon analyses, soil collections were performed at each point studied in the 0 to 0.20 m layer. The samples were placed in plastic bags and taken to the Water and Soil Laboratory of the Federal Rural University of Pernambuco.
The soil organic carbon (SOC) of the soil was determined by the oxidation of organic matter, using 0.0067 M potassium dichromate, in sulfuric medium, and titration by 0.1 mol L−1 ammoniacal ferrous sulfate [34].
The texture analyses were performed from samples that were air-dried for 72 hours, pounded to break up clods and sieved through a 2.0-mm-mesh sieve. The sand, silt, and clay granulometric fractions were determined by the Bouyoucos hydrometer method using a mechanical stirrer as a physical dispersant for 15 minutes for clayey soils and 5.0 minutes for sandy soils. 25 mL of sodium hexametaphosphate (Calgon) was used as a chemical dispersant [34].
From the infiltration data and physical properties of the soil, the Beerkan method was applied to determine the hydrodynamic parameters at the local scale in the field and, therefore, estimate the hydraulic conductivity of the soil (Ks) [10].
This method was devised by [15] and it has an advantage over other experimental methods due to its application, which is simpler, faster and requires a smaller number of people and equipment, making it more economical.
The method is used to mathematically represent the infiltration phenomenon by fitting the infiltration curves to determine the parameters of soil saturated hydraulic conductivity (Kfs) according to Eq. 1 [3].
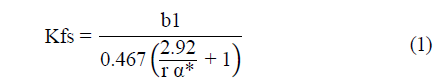
Where, b1 is a parameter of the linearized equation of the line; r is the radius of the perforated disk (m). Regarding the values of α*, four are suggested* (0.036; 0.012; 0.004 and 0.001 mm) for the practical use of application of the Guelph permeameters and disc infiltrometers in soils ranging from coarse sands to compacted clays. An α* value of 0.012 mm was considered to be the first approximation for most field soils [22].
2.3 Data analysis
Descriptive statistics was used to determine the mean, median, standard deviation, maximum and minimum values, skewness and kurtosis coefficients and the coefficient of variation. For information on dispersion and distribution of variables, data normality was tested by the Kolmogorov-Smirnov test at the 5% probability level. Additionally, linear correlations were performed between the physical attributes of the soil by Pearson's correlation test.
The variability of physical properties was classified based on the coefficient of variation (CV) values, according to [36], as low (CV < 12%), medium (12 < CV < 62%) and high (CV > 62%).
To evaluate the presence of trend in the data, two trend surfaces were fitted, which had the following determination coefficients (R2): first-degree trend surface - 18.70%, second-degree trend surface - 25.45% [35].
2.4 Geostatistical analysis
Spatial dependence analysis was performed using geostatistics and semivariogram fitting. Based on the stationary assumption of the intrinsic hypothesis, the spatial autocorrelation between neighboring sites is calculated through the semivariance, which is estimated by Eq. 2a and 2b.
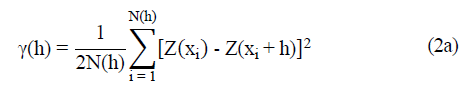
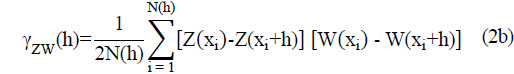
where, γ(h) is the semivariance; γZW(h) is the cross semivariance, h is the separation distance (m); N(h) is the number of data pairs separated by distance h; Z(xi), W(xi) are measured values of the variables at location xi, and Z(xi + h), W(xi + h) are measured values of the variables at a distance h from the location xi.
For construction and fitting of semivariograms, the GS+ program version 10.0 was used (Gamma Design Software, LLC, Plainwell, Michigan, USA) [27]. The criteria used and procedures performed for fitting the semivariogram model were those described in [36].
After obtaining the experimental semivariograms using the GEO-EAS software (Geostatistical Environmental Assessment Software), the Gaussian, spherical, and exponential models were tested. By fitting a mathematical model to the calculated values, the coefficients of the theoretical model for the semivariogram are estimated (i.e., the nugget effect, C0, sill, C0 + C1, and range, A).
The model that showed an adequate fit to experimental values and standardized errors with a mean close to zero and standard deviation close to one was chosen, according to the Jack-Knifing cross-validation technique [35].
To determine the degree of spatial dependence (DSD) of the variables under study (Eq. 3), the classification by [6] was performed, which is based on the analysis of the relationship between the nugget effect and the sill of its fitted semivariogram. Values below 25% characterize strong spatial dependence, between 25% and 75% moderate dependence, and above 75% weak dependence.
Where, C0 is the nugget variance and C1 is the structural variance. Effective range is the distance at which the sill (C0 + C1) is within 5% of the asymptote.
The isoline maps were constructed using the kriging algorithm, in the computer program Surfer 9.0 [12].
3. Results and discussion
The results of the descriptive statistical analysis for saturated hydraulic conductivity and texture are shown in Table 1. The Kolmogorov-Smirnov test indicated that the hydraulic conductivity and clay data did not show normality at 5% probability level.
Table 1 Descriptive statistics for data of log-normal saturated hydraulic conductivity (Kfs) and sand, silt and log-normal clay content.
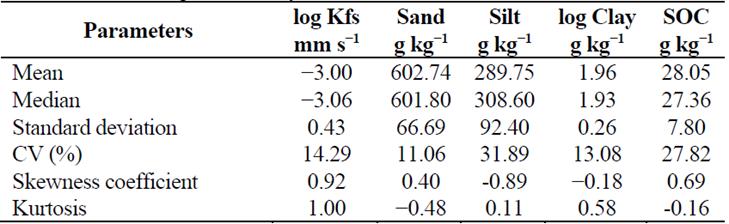
CV: coefficient of variation
Source: The Authors.
Through analysis of the coefficient of variation (Table 1), it is observed that the log of hydraulic conductivity, the log of clay and silt had coefficients of variation (CV) classified as medium (12 < and < 62%), while the sand obtained low CV (< 12%), according to the criteria of [37]. [25], analyzing the spatial variability of hydrodynamic properties of a Regolithic Neosol under pasture and Caatinga, observed the same behavior. The coefficient of variation can be an essential tool for assessing and comparing variables, as low CV variables indicate a small variation of data from the mean, showing a homogeneous distribution [19].
From the Pearson correlation matrix, it is possible to observe that there was no significant correlation for most of the physical indicators of the soil in the present study, highlighting the low correlation of clay with saturated hydraulic conductivity and organic carbon in the soil (Fig. 2). Behavior similar to that was found by [2], in a small basin in Sicily, where the saturated hydraulic conductivity data showed no significant relationship with the textural indicators of the soil. However, controversial results were reported by [6], who found significant correlations for most of the physical attributes of the soil in the Atlantic Forest biome, northeastern Brazil.
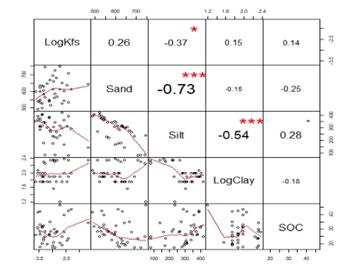
Source: The Authors.
Figure 2 Pearson's general correlation matrix for soil physical attributes. logKfs - log-normal saturated hydraulic conductivity; Sand; Silt, log-normal Clay; SOC - soil organic carbon. The largest values represent an increase in the significance of Pearson's correlation coefficient (p-value < 0.05).
All variables evaluated showed a high degree of spatial dependence (Table 2), directly influenced by intrinsic properties of the soil such as density, porosity, soil moisture and soil texture. Attributes with low spatial dependence are more influenced by extrinsic factors, such as relief of the site, soil management, trampling of animals and compaction due to agricultural machinery traffic [7]. Thus, a moderate degree of spatial dependence (as found in the present study) shows that the soil suffers much more from the influences caused by the lack of management and traffic of agricultural machines than from those caused by the other soil characteristics (e.g. density, porosity, and texture of soil).
The mathematical model that best fitted the distribution for the organic carbon results of the soil was the Gaussian one, whereas the other physical variables of the soil were better described by the spherical model (Table 2). The spherical model has already been found in other works as expressing the best fit for some soil attributes [13,16].
Table 2 Parameters of semivariogram models and degree of spatial dependence (DSD) for data of log-normal saturated hydraulic conductivity (Kfs) and sand, silt and log-normal clay content.
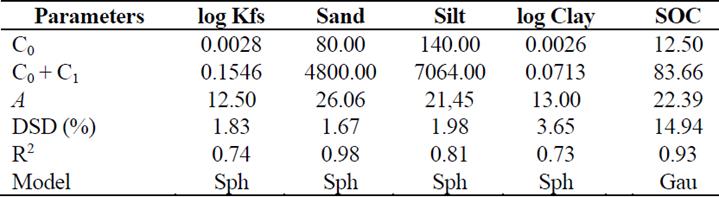
C0: Nugget Effect; C0+C1: Sill; A: Range; DSD: Degree of spatial dependence; R²: Coefficient of determination; SOC: Soil organic carbon; Sph: Spherical model; and Gau: Gaussian model.
Source: The Authors.
The experimental semivariance of the logarithms of saturated hydraulic conductivity was estimated (Table 2). The semivariogram model that best fitted the hydraulic conductivity semivariances was the Spherical, with a nugget effect of 0.0028 and a range of 12.5 m. For the particle-size fractions, the best fitted mathematical model was also the Spherical, with ranges of 26.06 m, 21.45 m and 13.00 m for sand, silt and clay, respectively (Table 2). For soil organic carbon, the mathematical model that best fitted was the Gaussian, with a nugget effect equivalent to 12.50 and a range of 22.39 m.
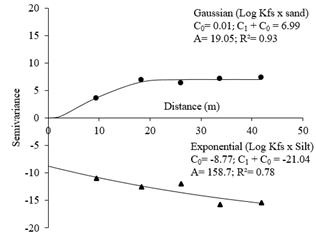
Although classical correlation was not observed, spatial cross-correlation occurs between log (Kfs) and texture, as verified based on cross-semivariograms. Fig. 3 shows cross-semivariograms between log Kfs and sand content and between log Kfs and silt.
Source: The Authors.
Figure 3 Cross-semivariograms between log Kfs and sand content and between log Kfs and silt.
[25], working with data using the log of saturated hydraulic conductivity, obtained the best results of the semivariance fits with the Spherical mathematical model, whose nugget effect was 0.004 and range was 35.38 m, in a 20 x 20 m grid. Higher range values were found by [21], evaluating the spatial variability of hydraulic conductivity of plain alluvial soils, with a range of 320 m with an average spacing of 30 m between collection points.
From the soil texture and the analysis of saturated hydraulic conductivity (Ks), by the Beerkan method, [1,29] also observed the main correlation between Ks and the sand content, even with low results. However, these studies did not assess the correlation between these variables through cross-validation, so only a one-time analysis between the variables was possible and not an analysis of spatial correlation. This fact highlights the importance of the cross-validation analysis of the present study.
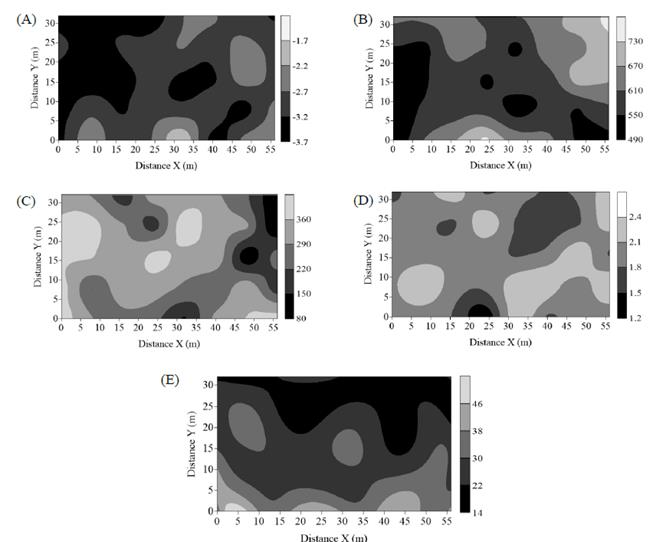
According to the method of [38], there was a trend in the saturated hydraulic conductivity data, requiring their fit. Fig. 4 shows the isoline maps for the saturated hydraulic conductivity of the soil. When analyzing the spatial distribution of the area, it is noted that the lowest values of soil Kfs are located near the left edge (Fig. 4). Such distribution can be explained by the high intensity of circulation of vehicles and agricultural machinery at this edge. It can be seen that the highest hydraulic conductivity values (Fig. 4A) were located in places with more significant sand fractions (see Fig. 4B). There is a positive association between sand content and soil macroporosity [32], which in turn can influence the soil to conduct more water.
Source: The Authors.
Figure 4 Maps of the spatial distribution of properties of the soil: (A) log-normal saturated hydraulic conductivity (mm s−1); (B) sand (g kg−1); (C) silt (g kg−1); (D) log-normal clay (g kg−1); and (E) soil organic carbon (g kg−1).
High variability in hydraulic conductivity is observed, which can be explained by the influence of local soil heterogeneity. Similar responses were found by [10], who associate high variability more with soil structural factors than with textural factors.
4. Conclusions
The best fitted mathematical model for soil hydraulic conductivity was spherical, with a 12.50 meter range.
Soil physical indicators showed high spatial dependence.
Although there was no point to point relationship between sand and silt contents and hydraulic conductivity, crossed spatial variation occurs for those variables.
The highest values of hydraulic conductivity are found in regions with higher sand content in the soil.
Geostatistics made it possible to identify spatial cross-correlation between hydraulic conductivity and texture and to map regions of lower hydraulic conductivity, where specific management techniques should be adopted so that the conductivity can be increased.

