


 Inglês (pdf)
 Artigo em XML
 Referências do artigo
 Enviar este artigo por email
 Citado por SciELO
  Citado por Google
  Similares em
SciELO
Similares em
SciELO  Similares em Google
 Permalink
1. Introduction
Intraocular Pressure (IOP) is the fluid pressure inside the eye, commonly measured through applanation tonometry. First introduced by Goldmann [1], applanation tonometry is based on the Imbert-Fick principle which states, according with Duke-Elder, that “the pressure in a sphere filled with fluid and surrounded by an infinitely thin and flexible membrane is measured by the counter force which just flattens the membrane to a plane” [2]. Based on his studies on corpses’ eyes, Goldmann added tear and cornea parameters to this principle so that it could be applied to human eyes, thus building an instrument for measuring intraocular pressure: The "Goldmann tonometer" (GT). These tonometers are widely accepted in usual practice [3,4].
These tonometers are calibrated using standard weights provided by the manufacturers, where 1 g = 10 mmHg. For example, manufacturer companies like Haag-Streit A., provides a weight bar engraved with rings at 0, 2, and 6 g. Therefore, based on the abovementioned conversion, this standard calibrates the tonometer at 0, 20, and 60 mmHg, respectively. Also, other brands on the market B, provide four weights, of 2g each, to calibrate the tonometers at the points of 20, 40, 60 and 80mmHg. Therefore, manufacturers disagree on the calibration patterns. In fact, some manufacturers provide different tonometer calibrations according to the model, as observed in their corresponding manuals A.
GTs must comply with a standardized calibration procedure, as specified in requirement 7.2 of standard [5] regarding the selection, verification and validation of the methods in metrology field. In this context, a new standardization procedure was implemented [6]. This procedure verified method traceability by directly comparing the weights provided by the manufacturers against the calibrated standards provided by accredited laboratories. Although GTs are devices designed to measure pressure, they are calibrated indirectly using weight standards.
Furthermore, GTs are used in combination with slit lamps. In these setups, both devices must be correctly aligned as any deviation may generate source measurement errors. As such, other sources of error not identified in the calibration procedures must also be considered. [7-10] For example, misalignment between the GT and the slit lamp, adjustment issues in the GT feeler arm, and the condition of the GT measuring prism. These factors are usually not assessed during weight-based calibration, which focuses on the mechanics of the tonometer and not on its optics. As "even the slightest calibration error can adversely affect treatment decisions for patient with advanced glaucomatous damage"[7]. These possible sources of error must be assessed to achieve greater accuracy in the calibration procedure and, hence, in tonometry.
Regarding the development of new tonometry techniques, other authors have built calibration assemblies in an attempt to verify the pressure measured by their equipment; for Instance, [11] where contact lenses were used to monitor IOP on enucleated porcine eyes connected to a pressure sensor through a cannula. These tests needed to be performed quickly, before the eyes lost their biomechanical properties. In another study, [12] the applanation surface of the GT’s measuring prism was modified to eliminate errors caused by the biomechanical variability of the cornea. Indeed, the central corneal thickness varies from person to person and decisively influences the measurement of intraocular pressure (IOP) with conventional techniques [13].
For this study, the authors used an assembly similar to the one used by [11], but used corpses’ eyes. Both studies proved that models can be constructed where pressure is regulated and the results can be compared with the measurements provided by tonometers. Using experimental methods, this paper proposes the design, construction, and validation of a calibration prototype for GTs. However, the structure of this prototype is different from that of the common standard, which uses weights provided by the corresponding manufacturers.
2. Subject and materials
Based on the experimental method, the design stages for this prototype were as follows: Initial construction of four hydraulic models; selection of an optimum hydraulic model from the previous stage and selection of the appropriate pressure sensor for the selected model. Then, design of the circuit associated with the pressure sensor, digital processing of the output signal from the circuit and, finally, assembly, validation and assessment of the prototype.
The first step involved selecting materials with structures similar to the anatomical eye for the preparation of the initial hydraulic models.
2.1. Construction of the hydraulic models
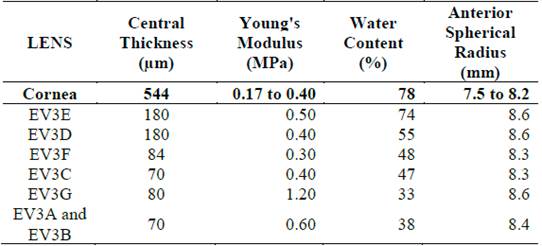
Cornea is the tissue that comes in contact with the GT applanation prism. Therefore, the technical specifications of soft contact lenses were reviewed to select the appropriate contact surface for the prototype. Considering their approximation to the corneal parameters involved in tonometry, the characteristics of these soft contact lenses were compared with that of cornea, as shown in Table 1. The specifications were taken from [13,14]
Four hydraulic models were assembled using four different lenses readily available in the market. These lenses were attached to spherical ECG suction cups, which were hollow inside. In accordance with a previous study [15], the dimensions of these suction cups were similar to the average axial length of the eye.
2.2. Selection of hydraulic mode
The models were tested as shown in Fig. 1. Each model was connected to an insufflation bulb and an analog pressure gauge through a hose, duly calibrated and certified to measure pressures from 0 to 300 mmHg.
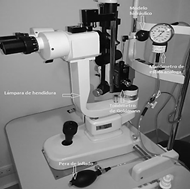
As part of this test, pressure was applied to each model through the bulb, monitored on the referential pressure gauge and compared against a duly certified GT. For each model, three different measurements were recorded at 20, 40, 60, and 80 mmHg, as per the procedures described in the corresponding manuals[A] [B].
According to the results from the previous stage, a repeatability and reproducibility study, used for to identify variability in measurement due to instrument [16] was conducted at seven points (20, 30, 40, 50, 60, 70, and 80 mmHg) for the two models that exhibited the greatest accuracy. In addition, two operators were used, taking three measurements per operator for a total of 42 readings per model. In this way, the variability due to the device or model was obtained. The expression of repeatability and reproducibility estimates in terms of standard deviations.
2.3. Selection of pressure sensor
The criteria for sensor selection were accuracy and availability, considering that pressures to be measured ranged between 0 and 80 mmHg (with a resolution of 2 mmHg), as per the corresponding GT scale. In addition, the selected sensor utilizes a silicon, micromachined, stress concentration enhanced structure to provide a very linear output to measured pressure, according to the manufacturer's manual.
Consequently, the technical specifications of seven different sensors were assessed.
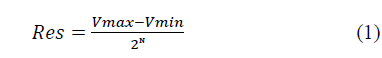
In addition, to process the output signal from each sensor, Arduino UNO R3® data acquisition (DAQ) card was used; its input resolution was estimated as follows:
Where:
N:Number of Card Bits. Vmax:Maximum Voltage
Vmin:Minimum Voltage-
As we used a 10-bit ADC (Analog to Digital Converter) converter whose input voltage ranged between 0 and 5 V, the resolution of the DAQ was 4.88 mV, according to Equation (1).
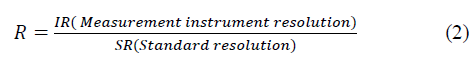
After expressing the sensitivity of the selected sensor in mV/mmHg its resolution can be determined using a simple rule of three. This calculation verified that the sensor was indeed suitable for tonometer calibration as per the criteria described by [17], which establishes that a calibration process is successful when resolution ratio (R), as given by Equation (2), is ≧4, and preferably 10.
2.4. Circuit calculation
To leverage the maximum possible number of ADC converter combinations for the DAQ system, given that the resolution of the measurement system must be optimized, a circuit for introducing gain and offset values to the sensor output signal was designed. The offset converts the minimum signal value to 0 V and the gain converts the maximum signal value to 5 V. For these purposes, a circuit based on two operational amplifiers, was used, as shown in Fig. 2, according to [18,C].
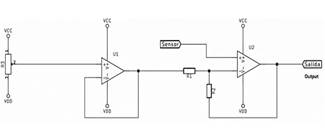
Vcc and VDD: Supply voltages. Source: Higuchi, Hotta, and Iwabuchi, 1992.
Figure 2 Basic Circuit for Improving Prototype Resolution.
The amplifier on the right (seen Fig 2.) carries out the conversion process. The sensor input is connected to the non-inverting pin and the input (R1) and feedback (R2) resistors are connected to the inverter. An Offset voltage is connected to the input resistance, coming from a potentiometer.
The circuit’s characteristic equation is as follows:
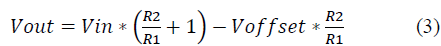
However, it can be simplified as follows:

Where:
Vout:Output Voltage
Vin:Input Voltage
G:Gain
Voffset: Off set Voltage
2.5. Digital signal processing
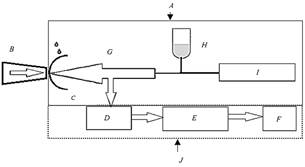
Using the test block shown in Fig. 3, a correlation analysis between the circuit’s output signal and the pressure applied to the model was performed. This signal was coupled to an analog input from the DAQ card, followed by reading the corresponding input after applying 1000 readings (approximately) to dampen the noise. This information was stored in a variable and was subsequently transferred to the computer.
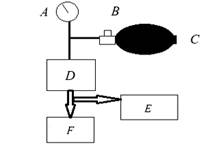
A: Manometer, range 0-300mmHg. B: One-way valve. C: Inflated pear. D: Sensor + Circuit. E: DAQ Card. F: Voltmeter. Source: The Authors.
Figure 3. Test Block for Pressure Sensor.
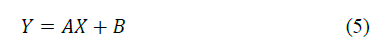
The signal was displayed as a digital variable that was proportional to the pressure, with values ranging between 0 and 1023. To convert these values to mmHg, the response from the sensor was linearized using the function that defines the behavior of a straight line:
At this stage, to obtain ample number of samples for an accurate linearization, the digital values were read in increments of 2 mmHg, from 0 to 80 mmHg. In Equation (5), variable Y is the digital number read by the DAQ card corresponding to a pressure value of X. Next, these readings were tabulated and graphed to determine the resulting characteristic function. Then, the equation obtained after solving for variable X, can be implemented in the programming code to convert these data to mmHg.
Subsequently, Equation (6) was used to calculate the mean absolute deviation (MAD) of the readings as well as the standard deviation (Sx) of the mean absolute errors. Afterwards, type A uncertainty (µa) for the electronic block was determined using Equation (7). Finally, to achieve greater accuracy, we performed two additional rounds of linearization following the steps from the previous method.
Where:
2.6. Prototype assembly
The prototype was constructed following the schematics depicted in Fig. 4. To induce pressure in the model in a controlled manner, a millimetric screw was coupled to a 3-mL syringe.
A: Hydraulic model. B: Applanation prism of the Goldmann tonometer. C: Contact lens. D: Sensor + Circuit. E: DAQ Card. F: PC/Display. G: Pressure exerted by the liquid. H: Aqueous humor. I: Pressure inducing device. J: Electronic block. Source: The Authors.
Figure 4 Prototype Diagram.
2.6.1. Prototype validation and assessment
The prototype was validated by Metrology Laboratory at the University, where the values-20, 30, 40, 50, 60, 70, and 80 mmHg-were simulated using a duly certified Rigel UNI-SIM vital signs simulator. Then, these results were statistically assessed in a normal distribution, calculating the corresponding errors at each measurement to obtain the uncertainty in measurement.
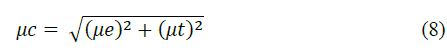
Next, Equation (8) determined the combined uncertainty (µc) for the prototype using the known uncertainties from both electronic block (µe) and GT (µt) used for the hydraulic model measurements during the R & R study. In this manner, this uncertainty value was compared against the uncertainty values reported by the laboratory.
To ascertain prototype compliance, its uncertainty was compared against the ISO 8612 standard [19], which establishes a ±2.5-mmHg tolerance in tonometer readings. Subsequently, the prototype was evaluated by calibrating 15 GTs at a renowned clinic in the Valle del Cauca region. The procedures issued by the GTs manufacturers were followed to record the tonometry readings, according to the recommended measurement points. Finally, an assessment of the readings from the tonometer calibrations was conducted using the prototype and the results were compared against the calibration data from the current standards.
3. Results and discussion
Price and commercial availability were the selection criteria for the four lenses used in the hydraulic models. As shown in Table 1, the EV3E lens is the closest to the corneal parameters, but it is an expensive lens and its delivery time depends on its manufacturing specifications, whereas the EV3D lens is more affordable and available for immediate delivery. The EV3C and EV3A lenses were selected on the basis of the same criteria. From this last type, two lenses with different positive optical powers (EV3A and EV3B) were selected to assess the effect of the shape of lenses (from the same manufacturer and material) in tonometry readings. Then, the appropriate solution was selected to accurately simulate aqueous humor in the models.
Once the models were built, the test as described in Section 2.2 was conducted. Tables 2 and 3 list the measurement readings at each point. Three readings are required normally.A Longer readings can cause eye fatigue.
Table 2 Results of the Goldmann tonometers calibration test with the Hydraulic Models Contact Lenses vs. Cornea.
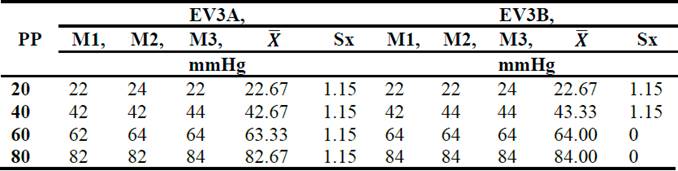
PP: Pressure point (mmHg).
Source: The Authors.
Table 3 Results of the Goldmann tonometers calibration test with the Hydraulic Models Contact Lenses vs. Cornea.
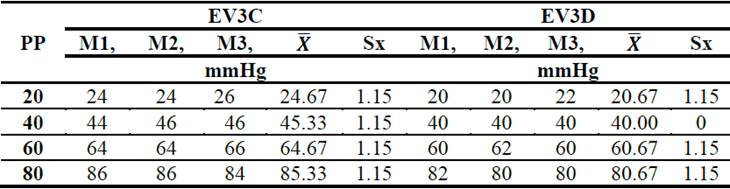
PP: Pressure point (mmHg).
Source: The Authors.
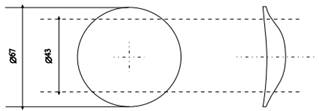
The first three models used positive lenses as, according to [20,21], corneas can be considered as converging lenses. Therefore, as depicted in Fig. 5 [20], the selected lenses had an optical area with a convergent aspherical surface and a smoothing zone with the following optical powers, in diopters (D): +4.25D (EV3A), +6.50D (EV3B), +7.00D (EV3C).
During the test, we found that aspherical lens with higher optical power exhibited greater central thickness with regard to their periphery. This interferes with tonometry readings as greater force must be applied to flatten the surface, a situation that can lead to measurement errors, according to [22]. This finding is reflected in the values reported in Table 2 for the EV3A and EV3B models, which use lenses from the same manufacturer but with different optical powers, and validated by the values reported for the EV3C model, Table 3, a more powerful model. The difference in pressure between the EV3A and EV3C models can easily be observed.
On the contrary, according to Table 3, the best performance was reported for the EV3D model, which uses a 0D lens. As there is no difference in the thickness between this lens’ optical zone and its periphery, the applanation process is easier and more uniform. Input data for the R&R study obtained from Goldmann tonometer Calibration using the EV3A and EV3D Models Therefore, the EV3A and EV3D models were selected for the R&R study. Their input data is reported in Table 4.
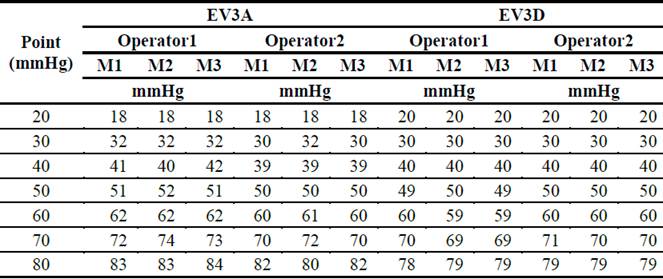
The corresponding R&R study parameters were discussed in Section 2.2, and the intermediate results from variation ranges (R1 and R2) and averages (X) for each operator are described in Table 5.
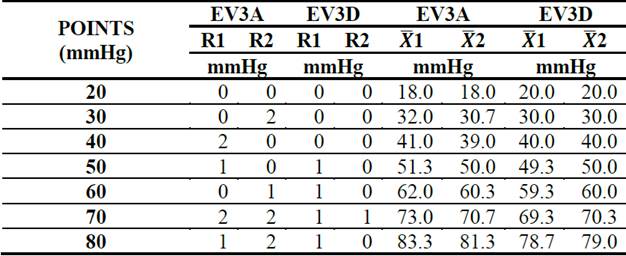
The expression of repeatability and reproducibility estimates in terms of standard deviations (S). The device variation errors (by repeatability and reproducibility) were estimated based on the results reported in Table 4. The results from this variation-error estimation, using the calculation method of [16,23], were: SEV3A = 1,458 mmHg and SEV3D = 0.39819 mmHg. Hence, the EV3D model was selected as it produced the least margin of error. The following formula was used:

where:
(Srepet)2:Variation from Repeatability
(Sreprod)2:Variation from Reproducibiliy
After selecting the hydraulic model, the best pressure sensor was selected after reviewing seven technical datasheets supplied by the manufacturers, as shown in Table 6.
Table 6 Technical Specifications of Pressure Sensors.
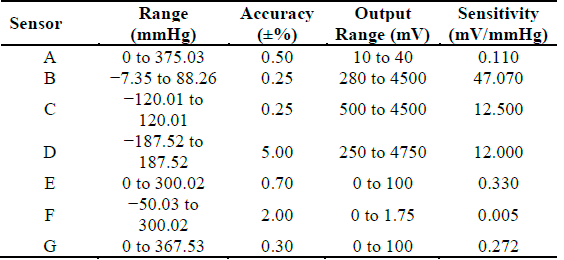
Source: Technical Datasheets Supplied by the Manufacturers
Sensor B displays greater accuracy than sensors A, E, and G, as shown in Fig. 6. The three discarded sensors (A, E, and G) feature a wider measurement scale, so the signal had to be amplified to reach the input range of the DAQ card; this affected the instrument resolution. However, the measuring range for Sensor B adjusts better to the requirements; therefore, its output range is approximately the same as its technical specification (0.28 to 4.5 V), which facilitates circuit design as complex amplification stages are not required.
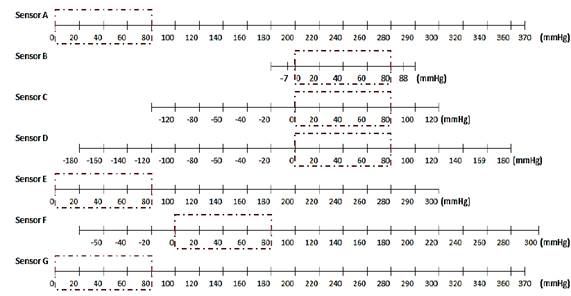
Source: The Authors.
Figure 6 Comparison between Sensors’ and Prototype’s Ranges. (Range of prototype: 0 to 80 mmHg).
Then, based on its sensitivity (47.07 mV/mmHg), the resolution of Sensor B was estimated at 0.104 mmHg using the rule of three described in Section 2.3.
In according to Equation (2), and considering that the tonometer’s resolution (IR) is 2 mmHg and the sensor’s resolution, in this case pattern resolution (PR), is 0.104 mmHg, the ratio R calculated is:
R=(IR/PR) = 2.000/0.104, this is,
R=19.230, which satisfies the criteria (R ≧ 10) described by [17].
Subsequently, a 2 × 2 equation system (10, 11) was formulated using Equation (4) by assigning the desired equivalent output voltages (Vout)-both minimum and maximum-for the circuit to the output voltages from the sensor (Vin):


The solution to this system is G = 0.1838 and Voffset = 1.78V. According to Equation (3), G = R2/R1. As a value of 1 KΩ was assigned to R2; accordingly, R1 would be 5,382 KΩ.
Next, the circuit was optimized for operation through trial and error, and the calculated components were assembled as per Fig. 4. Furthermore, as the operational instrumentation amplifiers denoted high accuracy and reliability, two AD620Ns were used and two potentiometers were placed to vary resistors R1 and R3, thus obtaining our offset and gain values. In addition, to reduce noise, 100-nF capacitors were placed between the terminals of each voltage source. Given the simplicity of the circuit, there was no need to verify its operation through a specialized simulation software.
Then, using the test block from Fig. 3, after displaying the circuit output on the computer, the first linearization was performed. Its corresponding equation and graphics are provided below.
Equation Fig. 7:
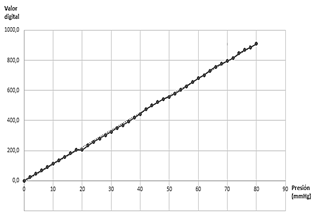
Fig. 7 shows that X-axis corresponds to the pressure applied to the sensor, whereas the Y-axis represents the digital response, which ranged between 0 and 1023, from the electronic block to said pressure. Solving for variable X from Equation (12) our digital values were converted to mmHg using the DAQ card programming code. Next, the mean absolute error, MAD, standard deviation, and type A uncertainty measurements for the electronic block, were calculated, in according Equations (6) and (7). Table 7 lists the results from the two subsequent linearization stages; stage two exhibits less uncertainty, which is why the DAQ card programming ended there.
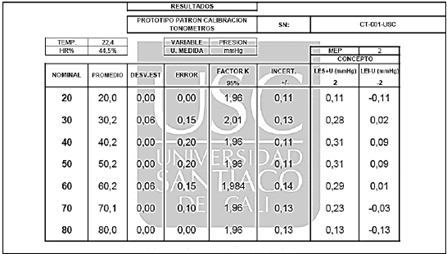
After the prototype was completed, it was sent to Metrology Laboratory at the University for validation. As observed in Fig. 8, the uncertainty lies within the range ±0.11-±0.14 mmHg, thus complying with ISO 8612, which establishes a ±2.5-mmHg tolerance for tonometer readings.
To verify this, the combined uncertainty for the prototype was calculated using Equation (8), considering that the uncertainty of the electronic block (µe) is ±0.090 mmHg (as per Table 7) and that the uncertainty (µt) of the GT, used in the R&R study, is± 0.085 mmHg at 95% confidence, according to Table 8. Table 8 indicates the pressure measurements in mmHg. The test conditions were performed at 20,4 ° C, with a relative humidity of 55.3%, in the metrology laboratory of the University.
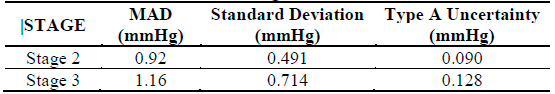
Table 8 Data generated from the Goldmann Tonometer calibration certificate.
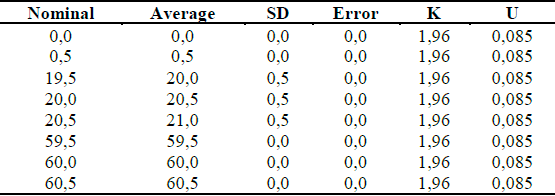
SD: Standard deviation. U: Uncertainty. K: Factor for 95% confidence.
Source: The Authors.
In addition, the lens itself is a source of uncertainty; this value corresponds to the repeatability component of the R & R study conducted for the EV3D lens, which is ±0.211 mmHg. Therefore, the total uncertainty of the prototype is ±0.244 mmHg, which is well within the stipulated criteria.
Table 9 describes the results from the assessment conducted for the prototype. Each measurement point of the variable pressure (mmHg), was assessed within the corresponding tolerance range, according to the GT manuals provided by the manufacturers. For example, the 20-mmHg point was assessed at 19.5 and 20.5 mmHg; the 40-mmHg point, at 39.5 and 40.5 mmHg; the 60-mmHg point, at 59 and 61 mmHg; and the 80-mmHg point, at 79 and 81 mmHg.
Table 9 Results of the Calibrations of 15 GTs Performed with the Prototype.
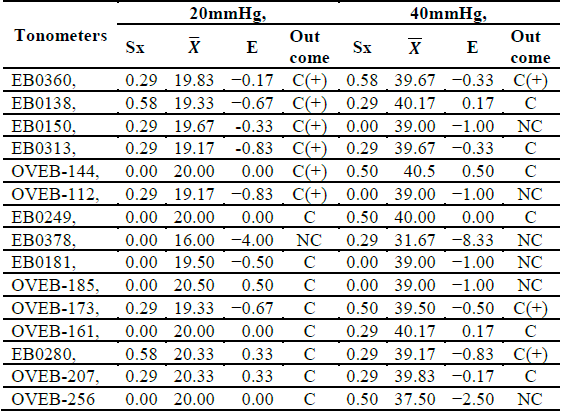
C (+): Compliance above Measuring Point.
C (-): Compliance below Measuring Point.
NC: Non-Compliant within Measuring Range.
C: Compliant within Measuring Range.
Source: The Authors.
For each measurement point was determined, respectively: Nominal value, Average, St. deviation, Error, K. factor (95%), Uncertainty and Concept (LES+U; LES-U). The measurement points 40 and 50 mmHg, present minus variation, according to intervals in column “Concept”. Results are satisfactory, because permitted error maximus (PEM) is 2.
According to Table 8, at the 20-mmHg point, only 53% of the GTs comply with the specifications from the manufacturers. Therefore, we infer that the tonometries conducted using other devices on people with normal IOP (11-21 mmHg) and in accordance with [24] would be erroneous, with some even presenting errors exceeding 1 mmHg. This observation is relevant for the purposes of this study as many people with glaucoma may report normal IOP values, especially considering that glaucoma is the second leading cause of blindness for worldwide, according to [25]. As glaucoma is usually diagnosed when eye pressure exceeds 21 mmHg, only 40% of GTs comply at 40 mmHg. This situation is unsettling as “even the slightest calibration error can adversely affect treatment decisions for patients with advanced glaucomatous damage” [7].
However, after reviewing the calibration certificates issued in August 2018 for the assessed GTs, all complied with the specifications from the corresponding manufacturers, with the exception of model EB0378. These calibrations were performed using the weight standards and specifications provided by the manufacturers. After comparing these values against the developed prototype, it can be concluded that accurate error measurement can only be achieved using a validated pressure standard as weight-based calibration does not yield reliable data on the offset of GTs.
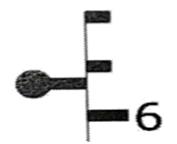
Nevertheless, in the procedures included in their manuals, manufacturers recommend performing calibrations at pressure points that are not within the resolution of the GTs. For example, in the 20-mmHg pressure point, manufacturers recommended verifying between 19.5 and 20.5 mmHg, when the GTs have a specified resolution of 2 mmHg, and 0,5 mmHg would be a best resolution. This adds the element of subjectivity to a tonometry. For example, if a patient presents a tonometry as the one depicted in Fig. 9, it is not clear whether the doctor must use the reading below or the reading above. Therefore, a more accurate resolution should be one of the criteria when purchasing a new tonometer.
4. Conclusions
During the development of the hydraulic model, the behavior of the eye structures involved in tonometry was simulated, which showed that when materials similar to these structures are used, a model can be designed whose pressure can be measured using a GT. In addition, by integrating the model into an electronic block specifically designed for the given range (0-80 mmHg), suitable uncertainty and resolution values could be determined for the calibration of these tonometers as per the corresponding ISO standard.
The traceability of the prototype was verified by validation at Metrology Laboratory at the University; this validation can be performed at any accredited laboratory in the country. The assessment of the tonometers revealed a higher degree of accuracy than the commonly used standards in the industry, thus evidencing shortcomings in weight-based calibration procedures and tonometries performed using these GTs.
The contribution from this prototype to GT calibration, in addition to its structure, operation, and the weights currently used, is evidenced when the prototype is placed on the optical mechanism of the tonometer. In addition, to making direct pressure comparisons, this study also included the sources of error associated with its use with the slit lamp, thus enabling a comprehensive assessment of the entire instrument, both mechanically and optically. Therefore, when calibrating 15 tonometers, two faulty applanation prisms were replaced, three GTs were aligned as they were found to be out of focus, and two loose prism arms were adjusted-situations that would not have been easy to identify should the tonometers have only been calibrated using the weights.
According to [7], the error sources for GT calibration are rarely investigated, which is why other patterns that may provide more information on these sources should be explored. In this manner, tonometry accuracy can be improved and more stringent calibration criteria can be realized against lax procedures that lead to measurement errors.
For future studies, we recommend assessing different materials for the hydraulic model, specifically for the surface in contact with the cornea, as its parameters significantly influence tonometry, as suggested by [26]. As evidenced in Table 3, owing to its optical power, the shape and thickness of the contact lens directly influenced the measurement; in this case, it contributed to the error. Hence, the selection or development of a membrane that approaches corneal parameters will be a key factor for the development of a pressure standard suitable for measuring GTs.

