


 Inglés (pdf)
 Articulo en XML
 Referencias del artículo
 Enviar articulo por email
 Citado por SciELO
  Citado por Google
  Similares en
SciELO
Similares en
SciELO  Similares en Google
 Permalink
1. Introduction
The significant growth in the demand for global energy and the increasing concern with the environment has accentuated the search to produce cleaner energy. In this context, wind energy has stood out as a major contributor to this desired energy transition.
Over the last few decades, onshore wind has consolidated itself in the market and has gained notoriety. As a result, the wind energy market has become established, both in terms of facilities and the creation of a supply chain of parts, components and software, derived from the strong incentives of public policies by local governments [1]. The next logical step was to occupy new spaces, such as the oceans and seas, where wind energy can achieve better performance as a result of higher and more constant wind speeds due to the absence of major interferences.
The wind resource at sea is superior to that on land and accumulates advantages over it. There is less visual and acoustic impact when compared to onshore systems, and it also benefits from much more extensive available surfaces. In addition, the ease of maritime transport - which has few limitations in terms of cargo and dimensions compared to land - made it possible for offshore wind turbines to reach powers and sizes much larger than those on land. As a result, offshore wind farms usually have several hundred megawatts of installed capacity.
Europe, a pioneer in wind generation, has most of its wind farms installed on land. Due to the reduction of suitable and available continental locations for new ventures, several wind farms have been established at sea, in conjunction with the advantage of using higher towers and greater productive capacity, impossible to be installed onshore [1]. Thanks to this transition to the sea environment, the use of offshore wind energy for electrical generation has grown exponentially in the world in recent years. The global installed capacity, which was 3 GW in 2010, increased in 2018 to 23.1 GW, which represents a growth of more than 750% in the period of just eight years [2].
The seas have long been explored for purposes other than fishing or transportation. The oil and gas sector, for example, has been dominating the seas for longer time, and today it is a strong industry, however, suffering harsh criticism for its notable environmental impact. With this, on the one hand, an incipient industry advancing research and development aiming the offshore exploration, and on the other, an industry that can be said to be mature with full knowledge in this area. Therefore, it is possible to clearly perceive the potential for complementary work between renewable and fossil generation in the search for the best shared use of these resources.
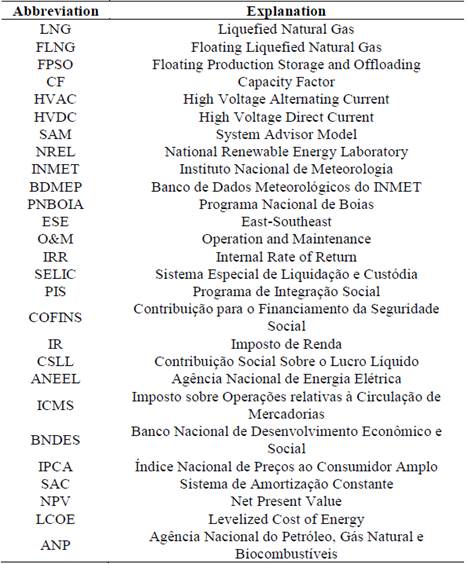
Petrobras (Brazilian government oil company) recently released new discoveries in the Sergipe and Alagoas fields. Six new fields have been discovered: Cumbe, Barra, Farfan, Muriú, Moita Bonita and Poço Verde [3]. The company expects to extract around 20 million m³ per day of natural gas, equivalent to one third of current Brazilian production. With this, Brazil could be among the leaders in relation to natural gas. A drop in prices and an increase in competitiveness are expected with the production growth. There are alternatives for transporting such a significant production volume: the construction of gas pipelines connecting the fields to the land; or through ocean-going carriers that will offload the Liquefied Natural Gas (LNG; Table 1 includes a description of abbreviations and acronyms used in this article) from the Floating Liquefied Natural Gas (FLNG), which are entire installations that deal with the storage and processing.
As the fields are located at depths greater than 2,000 m, the construction of gas pipelines can become technically and economically unfeasible. This way, the use of a FLNG becomes a better alternative. Despite consuming a lot of internal energy, they can offer a product with high internal demand. LNG is a commodity of great commercial value and can be easily sold to other countries.
Oil and natural gas are still valued resources that, rather than simply being burned and thus contributing to global pollution, can be better utilized to become more noble products (fertilizers, polymers, etc.). An offshore oil or natural gas platform functions as an artificial island in the high seas, which is why it needs energy supply to maintain its exploration operations and support activities. Usually, the explored fuels themselves are used for burning and supply energy for the platform. However, public policies limiting greenhouse gas emissions end up putting pressure on stakeholders in the oil and gas sector to seek alternatives to supply the platforms' energy demand. In addition, new technologies, such as the development of advanced oil recovery, further increase the demand for energy, driving the sector in the search for new solutions.
In this context and aiming to make natural gas a product of greater and better added value, the present work aims to analyze the technical and economic feasibility of an offshore wind farm to supply the energy demand for an FLNG platform to explore the fields of Sergipe and Alagoas Basin, located in northeastern Brazil.
2. Methodology
As mentioned above, the present work aims to evaluate the possible synergy between an offshore wind farm in the Sergipe and Alagoas Basin supplying the energy demand of an FLNG.
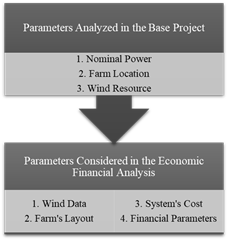
For this purpose, the study was divided into two stages: the first being the elaboration of a base project for the offshore wind farm ensuring the necessary demand supply, and the second, an economic-financial analysis using the System Advisor Model (SAM) software for assessing the model feasibility, as can be seen in the workflow presented in Fig. 1.
2.1. Base project
For the base project, some essential parameters to be considered were addressed, such as the farm's nominal power and location, as well as the analysis of the wind resource involved.
2.2. Nominal power
To parameterize the study, the average energy demand of an FLNG platform was analyzed. Since the 1970s, oil and gas companies have been conducting research in the development of concept designs for floating Liquefied Natural Gas plants. In parallel with the development of Floating Production Storage and Offloading (FPSOs) (floating units for the production, storage, and transfer of oil and / or natural gas and outflow of production by tanker ships), FLNG projects have recently started to mature [4].
The FLNG Petronas SATU (FLNG SATU) unit was the world's first floating natural gas liquefaction plant to begin production - reaching the first gas reservoir in December 2016 and delivering its first payload in South Korea in March 2017. With a production capacity of 1.2 million tons of LNG per year, it is 365 meters long and weighs over 100,000 tons when fully loaded [5]. As it is currently in full production and considered a medium-sized facility, this project was used as a reference for the present study.
The FLNG SATU facility is capable of generating 100 MW of electricity using natural gas, which would be able to supply all the energy demand of its facilities. According to [6], fuel gas consumption on an FLNG platform is typically 10-12% of the feed gas, depending on the liquefaction process used. It should be noted that fuel consumption will be higher than on land plants due to the need to sustain marine systems. The primary users will be gas compressor drivers, that is, gas turbines or steam boilers for steam turbine drivers. Besides, the gas will be used for power generation, in addition to other small fuel gas consumers.
As a comparison, the energy demand of a FPSO platform, commonly used in Brazilian waters, was analyzed. Unlike FLNGs, FPSOs do not process Natural Gas into Liquefied Natural Gas, they only produce, store and transfer oil and / or natural gas to tankers. The FPSO P-62 platform, in operation by Petrobras in the Campos Basin, installed at a water depth of 1,600 meters, has the capacity to process up to 180,000 barrels of oil and 6 million cubic meters of natural gas daily. Its electric generation capacity is 100 MW [7], which is similar to the FLNG previously analyzed. Therefore, for this study, the energy demand of a medium-sized FLNG and an FPSO are considered equivalent.
Having defined the nominal value of the energy demand, which for this study will be considered 100 MW, the second step was the analysis of the Capacity Factor (CF) of an offshore wind farm. According to [8], there is a clear trend that points to higher CF’s in the new European offshore wind farms since 2008, with average capacity factors increasing from around 35% to approximately 50% in recent years. [8] has presented 43% as the world average capacity factor value for the year 2018. Thus, for this study, a 40% CF was considered.
Considering a 40% CF, 250 MW would be needed to fully supply the FLNG or FPSO. However, and considering that the wind energy is intermittent, batteries banks attached to the platform are necessary to store the surplus energy and supply the FLNG or FPSO in times of little or no wind. Such installation must be analyzed to verify its technical and economic feasibility, which is not part of the scope of this work, but it is worth emphasizing its importance in a global analysis regarding the stability of the system.
Having defined the nominal power of the farm, the turbines were selected. [8], in its annual report, informs that the average size of offshore wind turbines has grown 3.4 times in less than two decades, from 1.6 MW in 2000 to 5.5 MW in 2018. Offshore contracted wind farms in Europe in 2018 used turbines between 3.5 MW and 8.8 MW of capacity. In this scenario, significant growth is expected for the coming years, as turbines reaching 12 MW are currently under manufacturing. This way, the use of turbines in the range of 10 MW was considered for the study.
The turbine chosen was Vestas' V164 with 9.5 MW of nominal power. Thus, the final dimensioning of the farm consists of 26 MW turbines, with a total nominal capacity of 247 MW.
2.3. Farm location
For the location of the wind farm, three main factors were analyzed: water depth, distance to shore and distance to load. These are the most important factors in the costs of offshore projects. The increase in depth results in greater investments as well as the distance from the coast affects installation costs in terms of transport logistics. Also, the distance to the load influences the length of the submarine cables and determines whether the transmission will be made through high voltage cables in alternating or direct current (costs are different and the preference depends on the extension of the cabling) [9].
The foundation structures for offshore wind turbines have been developed in a variety of solutions and are strongly related to the extent of the water depth in which the farm is located. The design of the support structure must consider several factors to provide an appropriate solution. Foundations are an essential aspect that influences technical feasibility, economic feasibility (the costs of offshore foundations represent about 20 to 30% of the total cost) and the environmental feasibility of the project (issues related to the impact on marine life and its surroundings air).
In Europe, most of the foundation structures built until 2018 were monopiles, corresponding to 81.5% of foundations installed [10]. Currently, this type of structure is the main type of foundation used in the offshore wind market due to its ease of installation in shallow water at medium depths. They are competitive structures for small and medium wind turbines, usually suitable for locations with a depth of up to 30 m. However, with the advancement of technology and the increasing depth of offshore wind farms, other foundation technologies have become competitive, such as the space frame structures called "jackets", more suitable for medium depths, generally ranging from 20 to 50 m.
As wind technology advances in deeper waters, floating platforms are gaining more attention. Floating structures allow the installation of wind turbines in deep waters, where the offshore wind structures fixed at the bottom are not viable. They can be deployed in deep and ultra-deep waters, in the range of 1,000 meters and beyond. Floating structures have great flexibility in production and are easier to install. However, they present a major challenge regarding the stability of the wind turbine. The structure must provide sufficient buoyancy to support the weight of the turbine and restrict rolling and heaving movements within acceptable limits.
The technology has developed significantly in recent years, and in 2017, the first large-scale floating wind farm began to take shape on the north-east coast of Scotland. The project consists of five 6 MW floating turbines, using an iron ore ballast to operate in deeper waters ranging between 90 and 120 meters.
Despite the great advances, this is still a little-known technology, and in a country like Brazil, where the offshore wind industry is non-existent, it would be premature to propose such a solution. Therefore, for the study in question, we sought to identify an area in which more consolidated technologies could be used, such as monopiles and jackets.
The fields discovered in the Sergipe and Alagoas Basin are found in ultra-deep waters, about 2,500 meters deep [3]. Using Google Earth program, a nautical chart issued by the Brazilian Navy was superimposed where an area suitable for the construction of the farm can be observed, with depths varying between 25 to 30 meters, as it can be seen in Fig. 2 below.
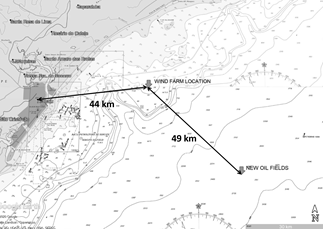
This area is approximately 44 km from the coast and 49 km from the new fields discovered. The annual report on offshore wind energy in Europe [10] states that the average distance from the coast of farm installation, in 2018, was 33 km, in 2017, this distance corresponded to 41 km. Most of the parks are less than 70 km from the coast. In this scenario, the distance of 44 km is reasonable and acceptable.
The distance to the load will define whether the transmission of energy will be done through high voltage cables using alternating current (HVAC) or direct current (HVDC). The cost of transmission by HVAC and HVDC depends on several factors besides distance, such as the installed capacity of the farm and bathymetry. For short distances, which is more common among the farms in operation today, transmission via HVAC is cheaper. After a certain distance, the losses linked to this technology become exceptionally large. HVDC transmission is considered the most economical option for long distances, usually from 100 km [9]. In the study in question, the distance of 49 km satisfies the limit imposed for the use of alternating current transmission.
2.4. Wind resource
As for the offshore wind resource in the Sergipe and Alagoas Basin region, the data obtained from the new Atlas of Brazilian Wind Potential launched in 2017 by the Electric Energy Research Center [11] were first analyzed. As described in the document's methodology, data on wind speed and direction were obtained for the year 2013, throughout the national territory, via numerical simulations.
For the study in question, the thematic map regarding the measurements of wind speeds at 100 meters high was analyzed, which corresponds to the average height of the rotor of offshore wind turbines today, including that of the present work. The thematic map indicates that the Sergipe and Alagoas Basin is located in an area with average wind speed in the range of 7 to 8 m/s, being considered technically practical by the wind industry.
2.5. Economic analysis
The economic analysis of the present study was based on the System Advisor Model (SAM) program, version 2018.11.11 r4, developed by the National Renewable Energy Laboratory (NREL), a renewable energy laboratory linked to the Department of Energy of the United States of America. SAM is a simulation software that allows the technical-economic modeling of renewable energy generation systems, including wind. One of the goals of the program's developers is to create a tool to aid decision making.
It is important to note that the program is based on the American model for the purchase and sale of energy, as well as the ruling contracts for the US electric sector, and on prices and costs adopted by the country. Whenever necessary, adaptations will be made to the Brazilian reality without losing sight of the values of the international market; where this is not the case, reservations will be noted throughout the work. The following are the inputs provided to the program.
2.6. Wind data
SAM comes with a set of typical files representing wind resources from US locations, not covering other regions of the globe. To define the wind resource at the project site, SAM requires a meteorological file that describes the hourly wind resource over a period of one year.
Firstly, it was used data from the Brazilian National Institute of Meteorology (INMET) through the Meteorological Database for Teaching and Research (BDMEP). The Database stores daily meteorological data in digital form, from historical series of several conventional meteorological stations in the INMET station network. A station was located in the city of Aracaju, which proved to be the closest to the study region. However, the available data were incomplete and inadequate to the offshore environment, making its use unfeasible.
The Brazilian Navy, through the National Buoy Program (PNBOIA), has buoys collecting metoceanographic information along the Brazilian coast. However, for the Northeast region, the closest buoy to the Sergipe and Alagoas Basin is the Recife buoy, which is more than 460 km away from the study region.
With the help of thematic maps of the new Atlas of the Brazilian Wind Potential [11] the direction and intensity of the wind in the buoy’s location was analyzed and compared to the region proposed for the implementation of the wind farm. The predominant wind direction and intensity, in both positions, are similar, and, therefore, the data from the Recife buoy are satisfactory for a primary analysis of the wind in the region of interest.
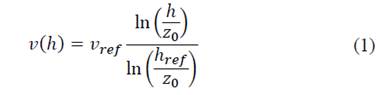
The data had to be processed in order to correct reading errors and adjust the time series according to the program's input parameters. Additionally, it was necessary to correct the wind intensity for the height of 100 m. In fluid mechanics, the Law of the Wall states that the average speed of a turbulent flow at a given point is proportional to the logarithm of the distance from that point to the "wall", or interface between fluid and solid. Such theorem can be described according to the eq. (1):
Where,
v(h) is the wind speed at the desired height;
v ref is the reference speed - in this case it is the data obtained by the PNBOIA measurements;
h ref is the reference height - buoy’s height, in this case, being 4.72 m;
h the desired height - in this case 100 m;
and z 0 is the roughness dimension of the soil surface - used as 0.0002 for calm seas [12].
2.7. Farm’s layout
In this study, the V164 turbine model from the manufacturer Vestas was adopted, comprising of 9.5 MW of nominal power [13]. The technical parameters of the turbine are detailed in Table 2.
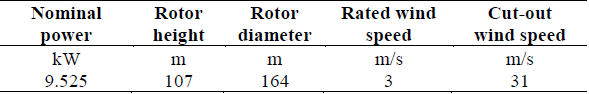
The farm consists of 26 turbines of 9.525 MW, with a total nominal capacity of 247.65 MW. For the shear coefficient, the value of 0.14 was adopted, which, in general, is used to predict the wind at higher altitudes, which provides good results on smooth surfaces, such as the sea [14].
For the configuration of the farm, two lines with 13 turbines each was adopted. Wind turbines need to be positioned so that the distances between them are between 2 and 10 rotor diameters, depending on the individual circumstances of each location. This spacing represents a compromise between compactness, which minimizes the cost of capital, and the need for adequate clearance to reduce energy loss through the wake, a “shadow” effect of the wind from the upstream devices. The necessary spacing will depend mainly on the prevailing wind direction. In the offshore case, where land use is not a limiting factor, winds tend to be of greater intensity and the positioning of turbines with more significant distances between them is possible by the use of larger equipment. Therefore, it was decided to use a spacing of 8 times the diameter of the rotor, carefully positioning the turbines between the two lines in an interspersed manner, to reduce the loss due to the wake effect.
According to the wind data obtained, it was possible to verify that the predominant wind direction is east-southeast (ESE), with a weighted average annual orientation of 120°. Consequently, the park was positioned perpendicularly to this direction, in order to absorb as much of the region's prevailing wind energy as possible.
2.8. System’s cost
For the calculation of system costs, the SAM software has standard capital cost values of the NREL [15] wind cost models updated in 2017, which use a different set of cost assumptions for onshore and offshore wind farms. The cost data tends to be realistic, however it does not represent the real costs of a specific project in all its particularities. Thus, they must be critically analyzed for further validation.
The calculation of the farm’s installation costs is derived from its technical characteristics and location. For this, technical information specific to the project is inserted, such as: maximum water depth, type of foundation, distance from the shore, distance from the port and distance from the shore to the network. This information is obtained after choosing the most suitable area for the installation of the wind farm, as already highlighted in the previous section.
Regarding the type of foundation adopted, both the water depth and the installed power of the wind turbines were considered. Despite the monopiles being more accessible to manufacture and install, for larger turbines the jackets are more suited because they use less steel throughout its construction. In addition, jackets can also be used in a wide range of soil conditions [16]. In this way, jackets were the foundation type selected for this study.
After inserting the technical information, the costs were estimated by the software. Then, a critical analysis of the values obtained was performed in order to check for its reliability.
The total installed cost per kW value calculated by SAM was US$ 8,012.35/kW, almost double the average published by [8] in its 2018 report on renewable energy generation costs, described as being US$ 4,350.00/kW. When analyzing the total installed costs for commissioned offshore wind projects and weighted global average 2000-2018 [8] it is noticed that the total costs are higher in Europe than in China, reflecting the fact that the Chinese development remains in shallow water, close to ports. In Europe, the average total costs in the year of 2018 ranged from approximately US$ 4,000/kW to less than US$ 6,000/kW.
The total cost determined by SAM consists of two parts, one corresponding to the estimated cost of the Turbine and the other corresponding to the cost of the System Balance, which includes costs for the development of the project, structure and foundation, logistics and installation, and infrastructure electrical.
For the case of the project under study, with the technical specifications of the turbine, SAM estimated the cost of the turbine at US$ 1,557.00/kW. When compared to the cost considered by the British Crown in its guide to a 2019 offshore wind farm [16], which, after currency conversion, amounts to approximately US$ 1,330.00/kW, the cost estimated by the program can be considered in the same order of magnitude.
For the case of the cost of the System Balance, considering all technical parameters regarding the location and specificity of the study, SAM estimated the value of US$ 6,455.35/kW. This cost alone already exceeds the maximum limit of the average total costs for the year 2018 presented in the IRENA report [8]. Which shows that this cost is likely oversized. However, this cost is composed of several parameters defined by the program itself, considering the costs of project development, structure and foundation, logistics and installation, and electrical infrastructure, which makes it challenging to analyze and verify each one of them.
Based on the breakdown of the capital costs of offshore wind installations [17] it is observed that the turbine corresponds to approximately 33% of the total capital cost of the installation. By doing a reversed calculation, and considering the value of the turbine found by the program, it is possible to obtain the total capital value as being US$ 4,718.18/kW, which is more in line with the world averages presented in the 2018 report of generation costs for renewable energy [8]. Based on this, the value of the System Balance is estimated, by working out the difference between them. The cost of the System Balance is now US$ 3,161.18/kW, which is manually inserted into the program, disregarding the previously calculated value.
Regarding the Operation and Maintenance (O&M) costs, the value presented in the guide for a 2019 offshore wind farm [16] was considered, which, after currency conversion, is equivalent to approximately US$ 100/kW annually.
Regarding the system’s degradation, SAM allows defining rates due to the aging of the equipment over time, for example. When accounting for the individual conditions of the place, it is confirmed that the load factors decrease with age, at a rate similar to that of rotating machines. It was found that wind turbines lose 1.6 ± 0.2% of their production per year [18]. Therefore, the value of 1.6% per year was defined for the performance degradation of the system.
2.9. Financial parameters
For the composition of the cash flow, it necessary to insert financial parameters. The first section of this module is made up of the “Solution Mode” where it is possible to determine which type of objective function should be used by SAM to calculate the results of the financial table. For this purpose, the retail electricity price was selected as the entry value, so that the program calculates the resulting internal rate of return (IRR).
The sale price of energy was determined based on the average sale prices at the end of the negotiations of the last “Leilão de Geração”, nº 04/2019 (A-6), which took place on the 18th of October of 2019. The 44 wind farms had an average final price of R$ 98.89/MWh. However, the sale price of onshore wind energy is not representative for offshore projects (which suffer higher additional costs due to being located at sea). Therefore, for the retail electricity price of the study, the global average auction price was considered, which in total obtained 91 contracted generation projects, with an average price of R$ 176.09/MWh [19]. With a dollar exchange rate of R$ 4.14 on the same date, according to the Central Bank website, the sale price of energy is approximately US$ 0.04/kWh. An escalation rate of 1% is applied to the sale price of energy over the years in the project's cash flow.
The project's analysis period is 20 years, according to the life span of the wind farm after its construction phase. For loner timeframes, the prediction of some parameters of analysis is challenging, such as inflation and the base interest rate. Such indicators were obtained in the report “Perspectivas para a Inflação do Banco Central do Brasil” (the Portuguese for Inflation Outlook for Central Bank of Brazil) [20] which forecasts for the next years an inflation rate around 3.5%, and the base interest rate, SELIC, at 6.5%. Such data results in a nominal discount rate of 10.23%.
The taxes considered on the project were: PIS, with a rate of 0.65% and COFINS, with a rate of 3%. Income Tax (IR) with a rate of 1.5% for the provision of services and CSLL (Social Contribution of Net Profit), with a rate of 9%. An extra charge corresponding to wind farms is the service inspection fee for Electric Energy, paid to ANEEL (Brazilian National Electric Energy Agency), which corresponds to 0.4% of the gross income obtained from the sale of energy. The total federal charges add up to 14.55%. In addition to these, the ICMS tax for the State of Sergipe was considered, which corresponds to 18%.
The cost of insurance for a wind project is in the range of low percentages of total annual costs and is mainly dedicated to covering risks for turbines and all other equipment on site. The risks are mainly related to environmental problems, such as fires, earthquakes, devastating storms, and lightning. For large projects, it can be considered in the order of 0.07% of the total cost of capital [21].
The residual value, to be considered by the program in the last year of the cash flow, was estimated at 25% of the total cost.
With regard to financing, the practices of the National Development Bank (BNDES) concerning the New Energy Auctions A-4 and A-6 of 2017 were considered. The auctions aim to support projects intended to the expansion and/or modernization of the infrastructure of the country's energy generation. Applied to the conditions of the auction, and according to the agency's practice, the financing can get up to 80% of BNDES participation and the remaining 20% coming from the contribution of private resources [22].
As this is a large-scale project, the financing was considered to be made directly to the BNDES, without the involvement of third-party financial institutions. According to [22], the interest rate is then defined as the sum of the Financial Cost, the BNDES Basic Remuneration and the Credit Risk Rate. Financial cost refers to the Long-Term Interest Rate, which corresponds to the IPCA (Extended Consumer Price Index) + 1.78% per annum for contracts signed as of January 2020. According to the Brazilian Central Bank, the annual IPCA of 2019 is equivalent to 4.31% per annum. In turn, the basic remuneration of BNDES was approved at 1.7% per annum [22]. The BNDES' credit risk rate can reach up to 3.37% per annum, depending on the customer's credit risk. As the project has a low credit risk, a 1.5% credit risk rate was assumed. Adding all the installments, the interest rate totals 9.29%. For wind energy, the bid provides for an amortization period of 16 years, adopting the constant amortization system (SAC).
With the result obtained, different evaluations were developed, which are to be addressed in the following section.
3. Results
After defining all the system inputs, it was possible to run the SAM program and obtain the results relevant to the economic and financial analysis of the proposed wind farm.
Fig.3 shows the monthly energy production generated by the wind farm over a year. The values presented are the result of the intersection of climatic data and the composition of the proposed wind farm. It can be seen that there are variations in the amount of energy generated over the months due to the variability of the wind regime throughout the year. The months of July and August have the highest energy production, with 94,815,200 kWh and 102,598,000 kWh, respectively.
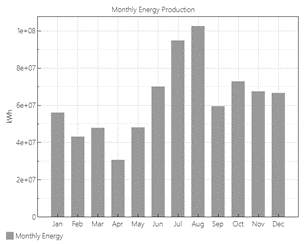
Fig. 4 shows the annual energy production generated by the wind farm in its lifespan. In the first year, the park generates approximately 760,000 MWh, with a capacity factor of 35%. As a comparison, the world average CF value presented by [8], for the year 2018, is 43%. The decline in power generation over the years is explained by the system's performance degradation rate, considered to be 1.6% per year [18].
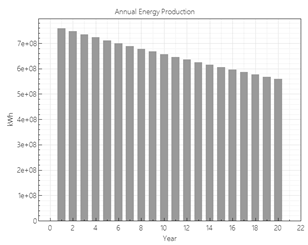
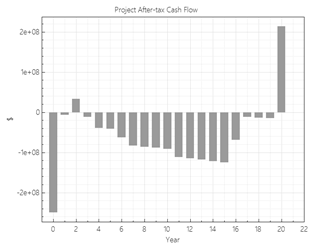
Fig. 5 shows the cash flow over the project’s lifespan. As noted, the cash flow shows negative results over the entire 20-year period, displaying, thus, the project's unfeasibility. The main variation observed over the years is related to BNDES financing conditions, with financing debts being paid up to the 16th year, equivalent to 80% of the project cost. The project has a negative net present value (NPV) of approximately US$ 634 million, as expenses are higher than revenues. This can be explained by the high capital cost involved in the project. The negative value of the NPV indicates that the project is not viable, as there is no financial return during its useful life.
The net capital cost of the project is equivalent to a total cost of approximately US$ 1.248 billion. Dividing this amount by the nominal capacity of the park, the value of US$ 5,040.32/kW is obtained, which is within the range of average total costs in the year 2018 in Europe, between US$ 4,000/kW and US$ 6,000/kW [8].
Accounting for all expected costs over the life of the farm, it was possible to calculate the LCOE (Levelized Cost of Energy), which represents the total project lifecycle costs. It is the present value of the project costs, expressed in cents per kilowatt-hour of electricity generated by the system over its useful life. The annual tax return on the project is equal to the annual revenue minus the cost of the project.
The LCOE is calculated based on costs such as: installation, operation, maintenance, financing, inflation, and other rates; divided by total energy generation (kWh) during its useful life. The LCOE also indicates an average minimum price at which electricity must be sold to offset investments made over the life of the project.
As a result of the financial models, SAM calculates the real and nominal levelized cost values. The levelized real cost is in constant dollars, adjusted for inflation. The nominal LCOE is a current dollar value. The choice of actual or nominal LCOE depends on the analysis. According to the program's help mode, the value in real dollars (constant) might be suited for long-term analysis accounting for years of inflation over the project’s life, while nominal (current) dollars may be more appropriate for short-term analysis. term. A comparison was made, using real LCOE values from other projects, and the nominal value obtained by the program is the most appropriate.
Thus, the simulation carried out by SAM results in US$ 0.153/kWh as the nominal LCOE. According to [8], the global weighted average LCOE of offshore wind projects ordered in 2018 was US$ 0.127/kWh. Europe's weighted average LCOE was around US$ 0.134/kWh, 28% higher than China is, in which the value was approximately US$ 0.105/kWh.
As noted, the LCOE value indicates an average minimum price for the sale price of energy. The value of LCOE found by SAM, of US$ 0.153/kWh, is higher than the average sale price of energy negotiated in the last Generation A-6 Auction, held in October 2019, which, after currency conversion, results in US$ 0.04/kWh. This way, it was possible to perform a sensitivity analysis to identify the reference price for the sale of energy that would allow investment in the project. The value of US$ 0.188/kWh was found to be the minimum energy sale value to make the project feasible. In this scenario, the value of the NPV is approximately US$ 509 thousand and the internal rate of return of the project 10.28%.
In the end, an analysis of the saved cost by avoiding the burning of natural gas to energize the platform was made. For the sake of comparison, the total energy generated by the wind farm is considered to be the same energy to be generated by a natural gas turbine inside the platform. Since the calorific value of natural gas is equivalent to 10.93 kWh/m³, and considering a turbine with 40% efficiency, a rate of 4.37 kWh/m³ is obtained. Dividing the total amount of annual energy generation by this value, an annual consumption of natural gas by the platform is estimated at approximately 174 million m³.
The average selling price of natural gas in Brazil published by the ANP (Brazilian National Agency of Petroleum, Natural Gas and Biofuels) in November 2019 is approximately US$ 11 per MMBTU. After the conversions have been carried out, the total amount of natural gas consumed to energize the plant is equivalent to approximately US$ 67 million per year.
Comparatively, considering LCOE as the minimum cost price for the wind farm, using the equivalent of the first year’s annual generation, a value of approximately US$ 116 million per year is obtained, which amounts to approximately 1.7 times the price that would be obtained with the natural gas sale.
4. Discussion
It is worth mentioning that the study is based on wind data from a location close to the place of interest. Although this was the most consistent data found to elaborate the analysis, it does not faithfully reproduce the reality of the place where the wind farm is proposed, and that a further study with more accurate wind data is advisable.
Regarding the environmental impacts of offshore wind farms, no analysis was considered in this study. However, it is extremely important to consider sustainable development and understand the physical risks involved, as well as the dynamics of the systems and their affectation by anthropic activities.
With respect to the estimated costs of the project, many factors can influence its real value. It is important to note that this is still an industry that does not exist in the country and the introduction of an entire production chain, such as labor and specialized equipment, should be considered. Offshore wind becomes a competitive industry when compared to onshore mainly for its logistical advantages where it is possible to transport large turbines offshore, but for this it is necessary a whole network of port infrastructure adapted for the equipment handling. Brazil has a long history with the oil and gas trade and can benefit from this knowledge. This can be a competitive advantage resulting in reduced costs for the project.
With the development and evolution of technologies, the costs involved in the construction of offshore wind farms in the world have been showing a continuous and drastic drop over the years, which has made previously unlikely projects possible. As presented, the results referring to the cost of capital were satisfactory when compared with international values. The value found by the program simulation is the average of the average total costs in Europe in the year 2018.
The levelized cost of energy, the LCOE, is 20% above the world weighted average. Although satisfactory, this difference can be understood by the different taxes, inflation and other factors related to the Brazilian reality.
The financial analysis carried out by the SAM software initially shows that the project is unfeasible due to the stipulated sales price (based on the average price of the last Generation auction). This is largely due to a unique feature of Brazil: the electrical system is essentially fully interconnected. Also due to the fact that the Brazilian electric matrix is based on hydroelectric production, it has a vast territorial area extension with expressive potential for the growth of renewables such as solar and wind power, allied to a low growth in demand, currently depreciating electricity sale prices. In this context, alternative and more costly energy sources, such as offshore wind, do not attract investor’s attention. The sale price of energy should be approximately 4.7 times higher than the current average value in order to make the proposed offshore wind farm viable,
In a subsequent analysis, it is observed that the cost involved in the generation of energy by the offshore wind farm is still 42% higher than the gain generated by the sale of natural gas saved from the platform's self-consumption. However, other factors must be considered, such as pollutants and the greenhouse gases emitted in the process of burning natural gas for electrical generation. Although not yet a reality, the carbon emission tax has been much discussed in the global context and offers a potentially effective means of reducing losses of greenhouse gases. If measures of this order are adopted, the study may become economically viable. It is also worth mentioning that the expansion of energy generation consists of determining the ideal technology, expansion size, sitting, and timing construction of new plant capacity in an economic fashion over the long planning horizon.
5. Conclusion
The present study aimed to analyze the technical and economic feasibility of an offshore wind farm to supply the energy demand for an FLNG or FPSO platform to explore the fields of the Sergipe and Alagoas Basin, located in northeastern Brazil.
In order to choose the most suitable area for the installation of the wind farm, technical aspects were analyzed, such as: water depth, distance from shore and distance to load. An area with satisfactory distances and relatively shallow water depth was selected.
After simulation by the program, the estimated cost of capital and levelized cost of energy for the project were presented in accordance with international values. However, the project proved to be unfeasible due to the average price of energy generation applied in the country.
The construction of offshore wind farms is still a challenge for Brazil due to not only the high costs necessary to install such projects but also the lack of infrastructure and experience for this market. The fact that the country already has extensive experience with offshore activities will facilitate the insertion of this industry and the rapid absorption of the best practices in the sector.
The synergy between the oil sector and offshore wind energy can include many benefits, such as the reduction of greenhouse gas emissions within the oil and gas sector itself, making the non-renewable resource available to a more noble use, in addition to paving the way to an industry that can diversify the Brazilian electric matrix.

