


 Inglés (pdf)
 Articulo en XML
 Referencias del artículo
 Enviar articulo por email
 Citado por SciELO
  Citado por Google
  Similares en
SciELO
Similares en
SciELO  Similares en Google
 Permalink
1. Introduction
As shown by the Intergovernmental Panel on Climate Change, the levels of anthropogenic emissions of greenhouse gases (GHG) in the last three decades are equivalent to the same level of global warming that occurred in the last 1,400 years [1]. Also, climate change has increased the frequency and intensity of extreme events such as droughts, floods, cyclones, hail, and others [2]. To mitigate emissions from hard to decarbonize sectors, an energy transition towards other energy carriers might be needed [3-5]. Among the existing alternatives, such as electricity and biomass, hydrogen is been seen as a promising agent as it can be stored, used by many sectors, and offers a flexibility that cannot be achieved with electricity [6].
In 2018, the transport sector was responsible for 32.8% of Brazil’s energy consumption, in addition to representing 60% of oil products consumption, in energy terms [7]. Such values represent how the transport sector is associated with the oil chain, in addition to being energy-intensive. Given the different technological alternatives applicable to the transport sector, it is understood that the future of this sector is of paramount importance for the evolution of the national energy chain.
There is a global movement of electrification of the vehicle fleet [8,9], which can come from a series of technologies. In this work, such technologies are divided into battery electric and fuel cell electric vehicles and possible fleet penetrations for these vehicles are considered [10,11]. These technologies are at a commercial level of operation, with only the maturation and competitiveness phase remaining to establish themselves in the market. For this, these technologies also depend on the development of the necessary infrastructure for their entry, such as robust expenses in the electric grid and hydrogen transport network [12,13]. In this way, electric vehicles that do not depend on this infrastructure are of relevant interest to the Brazilian market, especially when considering the possibility of using ethanol, given the already existing infrastructure of the sugar and alcohol sector in Brazil and in South America.
Thus, this article aims to analyze, through the comparison of different scenarios, the role of four vehicle technologies with little or no tailpipe emissions. The objective is to compare some of the electric vehicle technologies available for the passenger transport sector found in the literature and to compare some relevant indicators when considering a less polluting transport sector. This is done by comparing six fleet penetration scenarios for different vehicle technologies and analyzing the projection of indicators such as energy use, water consumption, and infrastructure change.
Then, the implications of each of these indicators are discussed, as well as the comparison of some other indicators that complement the analyzes of this work. The scope of the analysis made with the indicators is contained between the filling station and the vehicles, not considering a full life cycle assessment analysis.
The presented paper is structured as follows: a methods section, presenting the required data and assumptions for each of the analyzed indicators, a findings section, which presents the indicators projection in the proposed scenarios and a discussion of the results; and a concluding section.
2. Methods
In this research, an analysis is performed to quantify the energy and water consumption of different vehicle technologies, as well as any possible change in the necessary infrastructure. This is done from literature data and vehicle fleet projection scenarios. However, unlike a life cycle analysis, the scope of this work analyzes changes in energy and water consumption from the filling station to the vehicle, which is the scope of this analysis.
First, to calculate the projection of these indicators until the year 2050, a projection of the fleet of vehicles for the Brazilian passenger transport sector must be calculated. For this, different methods can be used, such as the use of income elasticity of demand for the penetration of new vehicles and the use of vehicle scrapping curves for the removal of vehicles from the fleet. This method was already applied for the Brazilian fleet in the Modelagem setorial de opções de baixo carbono para o setor de transportes report [14]. Thus, we use the value obtained in the projection of the Brazilian passenger vehicles fleet of the aforementioned report as our 2050 projected value and the data from the Brazilian National Transport Confederation for 2019 values [15]. Hence, the projection of the Brazilian vehicle fleet between 2020 and 2050 is calculated based on a first-degree function.
Using the fleet projection, two sets of scenarios are developed. The first set (Scenarios 1 to 4) consists of each of the analyzed vehicle technology with a 50% fleet penetration by 2035 and total penetration by 2050. The second set (Scenarios 5 and 6) comprises the same penetration of two different, but not competing, technologies, of which each fleet penetration is half of the penetration amount of the first set. A sensitivity analysis is also performed, with a ten percent higher and lower fleet projection in 2050. Figure 1 presents the projection and sensitivity range of the two sets of scenarios.
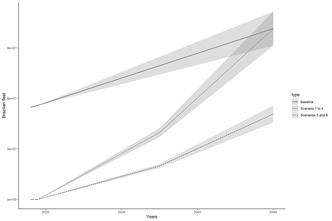
Source: The author
Figure 1 Baseline Brazilian fleet projection and fleet projections from the analyzed scenarios. Wedges represent the sensitivity analysis projection from all scenarios.
The first scenario regards the entire Brazilian light-duty vehicle fleet composed of battery electric vehicles. The second, third, and fourth scenarios consider the penetration of fuel cell vehicles but differ in the means of hydrogen production. The second scenario considers hydrogen produced from water electrolysis, the third scenario considers hydrogen produced from ethanol reforming, and the fourth scenario considers only direct ethanol fuel cell vehicles. The last two scenarios, five and six, contemplates the penetration of two electric vehicle technologies and are justified by the preservation of the ethanol infrastructure since the non-use of this energy vector can be incredibly significant for the Brazilian sugar and alcohol sector. The fifth scenario contemplates the mixed penetration of battery electric vehicles and direct ethanol fuel cell vehicles. This scenario is justified by the penetration of electric vehicles as a global trend and the partial maintenance of the ethanol chain infrastructure, preserving its use until 2050. The sixth and last scenario contemplates the penetration of hydrogen fuel cell vehicle technologies. This last scenario considers fuel cell technology as the winning technology for light vehicles, with the maintenance of the ethanol infrastructure being reformed at the filling station to produce hydrogen and the use of water electrolysis for the production of hydrogen.
For the indicator comparison, some assumptions are made based on the literature. First, an average annual distance per car must be used to estimate energy and water consumption per year. For the Brazilian light duty fleet, the value estimated by the Modelagem setorial de opções de baixo carbono para o setor de transportes report is used [14]. The vehicle energy and water consumption indicators are presented in Table 1, with their values being obtained in the literature [8,16-19]. The same energy use is assumed for the fuel cell vehicle with hydrogen generated from ethanol reforming in the filling station (H2bio) and the direct ethanol fuel cell vehicle (FCetoh), due to the lack of information available for each technology. The water consumption of the fuel cell with hydrogen generated from electrolysis (H2elec) assumes the water required by the electrolysis and the H2bio assumes an additional 6% in water to the volume of conventional hydrated ethanol.
Table 1 Energy and water consumption indicators projection.
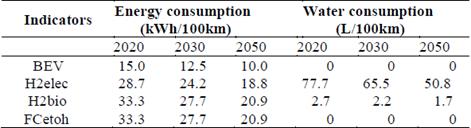
Notes - BEV: Battery electric vehicle; H2elec: Fuel cell vehicle using hydrogen derived from electrolysis; H2bio: Fuel cell vehicle using hydrogen derived from ethanol reforming; FCetoh: Direct ethanol fuel cell vehicle.
Source: The author
Regarding the change in infrastructure, different assumptions are made for each vehicle penetration. For the battery electric vehicles (BEV), it is assumed the values found by Harrison and Thiel, of which the authors find that electric vehicle market share increases as the electric vehicle per charging point ratio decrease from 25 to 5 electric vehicles per charge point [20]. These values are used to calculate the required charging infrastructure in each year of the analyzed scenarios, going from 25 electric vehicles per charging point in 2020 to 5 in 2050.
The required hydrogen infrastructure change for the H2elec vehicles uses data found in The Future of Hydrogen report to estimate a power regression for refueling station deployment per vehicle [8]. The equation used for this projection is f = 1.286 * c 0.45 , where 𝑓 is the number of hydrogen filling stations and 𝑐 the number of hydrogen cars in use.
Regarding the infrastructural adaptations for the H2bio vehicles, it is assumed the same ratio of internal combustion cars per filling station in the United States [21]. This route requires the installation of ethanol reforming infrastructure in the existing filling stations. The FCetoh vehicle does not require any direct infrastructural change.
3. Findings
In this section, the results of the indicators are presented, as well as a discussion regarding these indicators and their implications for the penetration of these technologies in the Brazilian transport sector.
3.1 Indicators projection in the proposed scenarios
Table 2 presents the yearly energy demand required by each vehicle in the scenarios. As seen in Table 1, the battery electric vehicle has the lowest energy consumption per kilometer of the analyzed vehicles, thus making Scenario 1 the scenario with the lowest energy consumption. Scenario 5 also has a lower energy consumption when compared to the other scenarios, mainly due to half of the vehicle fleet being composed of BEVs. Scenarios 2, 3, 4, and 6 present a remarkably similar energy demand, especially when considering the sensitivity analysis.
Table 2 The energy demand of the analyzed scenarios.
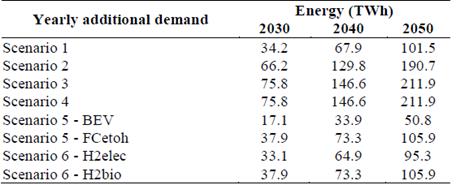
Notes - BEV: Battery electric vehicle; H2elec: Fuel cell vehicle using hydrogen derived from electrolysis; H2bio: Fuel cell vehicle using hydrogen derived from ethanol reforming; FCetoh: Direct ethanol fuel cell vehicle.
Source: The author
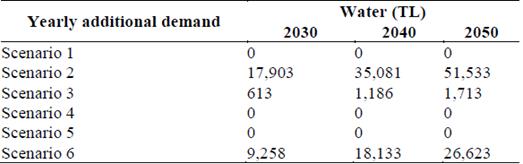
The required additional water consumption, as presented in Table 3, shows another advantage of the BEV-only scenario. This is also shown in scenarios 4 and 5, as the direct ethanol fuel cell does not require any additional water in the hydrated ethanol. Hydrogen produced by water electrolysis requires large amounts of water, making Scenario 2 by a large difference the highest water demanding scenario.
The additional infrastructure change can be presented as additional public charging points, for the battery-electric vehicles, or additions/adaptions in filling stations, and its projection for the analyzed scenarios is presented in Table 4. The direct ethanol fuel cell vehicle does not require any adaptation for the existing infrastructure, making Scenario 4 the only scenario without infrastructural changes. Scenarios 3 and 6 require the adaptation of thousands of filling stations to implement ethanol reforming infrastructure, while scenario 6 would also need the construction of filling stations to store hydrogen produced from electrolysis. Although public charging stations are not the only option for recharging battery-powered electric cars, many buildings are not suitable for deploying electric vehicle charging points, making a large part of the public infrastructure necessary.
Table 4 Additional infrastructural change in the analyzed scenarios. For the battery electric vehicles, the estimated values are in millions of public charging points. Regarding the other vehicles, values are estimated in thousands of additional/adapted filling stations.
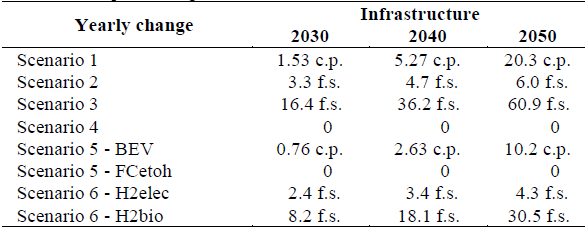
Notes - BEV: Battery electric vehicle; H2elec: Fuel cell vehicle using hydrogen derived from electrolysis; H2bio: Fuel cell vehicle using hydrogen derived from ethanol reforming; FCetoh: Direct ethanol fuel cell vehicle; c.p.: Millions public charging point; f.s.: Thousands filling station.
Source: The author
3.1 Discussion
The results may present the battery electric vehicle as to the obvious ’winner’, as it requires much less energy and no direct additional water in its scenarios. But as presented by Botsford and Szczepanek, if all BEV owners tried to charge their vehicles at the same time, the utilities might not be able to compensate this demand, thus requiring smart meters to enable utility control to optimize grid operations [22], thus increasing the need for more complex infrastructure.
There is also the issue of residential charging in buildings, which would require adaptations to meet the increased demand, and the problem of attributing the cost of this recharge and the recharge point, given that not all residents of a building will have a BEV at the same time. This is a major issue in denser urban areas, where most of the population lives in buildings. These issues can be partially met by the installation of charging points in filling stations but would require a robust infrastructure to meet fast charging standards.
In the case of hydrogen production by electrolysis, there can be two main problems related to infrastructure. The electrolysis process can be done on a large scale, reducing costs with economies of scale, or can be done at the filling station itself. The former would require greater investments in hydrogen storage and transportation, which is a problem in itself, as hydrogen can cause hydrogen embrittlement in metals, thus presenting a challenge for transporting and storing this gas. While producing hydrogen via electrolysis at the filling station would require much less area for storing it, if the production needed to be met by onsite photovoltaic panels, this could require a large area of dedicated photovoltaic panels.
Regarding the scenarios with the highest ethanol consumption, it would require only a 6% higher amount of ethanol when compared to the ethanol consumed by the Brazilian transport sector in 2019 by 2050 [23]. This can be explained by the higher efficiency of the fuel cell vehicle, with it having 2 to 3 times lower energy consumption per kilometer when compared to an internal combustion engine flex vehicle. Also, it is worth mentioning that this energy consumption by 2050 would need to require a 1% higher ethanol production when compared to the 2019/2020 harvest values [24]. Regarding the demand for ethanol in Scenarios 5 and 6, it would leave 50% of current ethanol production free for other higher values products, such as high value-added chemicals [25].
Using the aforementioned values for ethanol demand in 2050 and data from Conab [24], it is possible to estimate the land use area needed exclusively for the Brazilian passenger transport sector. Assuming a constant sugar-cane yield from 2019 values, it would be needed approximately 8.7 million hectares of the planted area. In comparison, if all the electricity demand for Scenario 1 in 2050 is generated by photovoltaic panels it would require more than 150 thousand hectares of land, using fixed photovoltaic panels, or 115 thousand hectares if using 2-axis concentrated photovoltaic system, using the generation weighted average land use from NREL [26], thus needing 13 to 17 times more land area than the planted area for ethanol.
The Brazilian sugar and alcohol sector employed 784 thousand people in 2016 when it produced 27 billion liters of ethanol [27]. If seen as a proxy for direct jobs, the reduction of each million liters of ethanol produced would reduce 28 jobs in this sector if the consumption of ethanol for other inputs or the increase in sugar production is disregarded. Maintaining and possibly increasing ethanol production can preserve several jobs. However, it is necessary to consider the generation of other jobs, such as the generation of energy from photovoltaic panels. Using data available from Ram et al. and the estimated electricity demand in Scenario 1, the projected photovoltaic generation for energy supply would employ 1 million people when considering manufacturing, construction and installation, and operation and maintenance [28]. However, less than 5% of these jobs would be needed in the long run, with this being the percentage of jobs for operation and maintenance positions. In order not to lose these jobs in the sugar and alcohol sector, there must be investments in the research and development of some technologies, such as ethanol reforming and/or direct ethanol fuel cells. According to IEA [29], battery electric and fuel cell vehicles are at a stage of commercial operation in a relevant environment, making these technologies commercially available, while still needing some evolutionary improvements to stay competitive. Hydrogen and fuel cell technologies had an estimated government budget of U$ 11.5 billion from 2005 to 2018 [8], causing them to evolve from a pre-commercial demonstration level to a stage of commercial operation. Battery electric vehicles have an estimated U$ 300 billion investment plan for the next 10 years, as companies want to develop cheaper batteries with longer ranges [30]. Direct ethanol fuel cell and on-site ethanol reforming are technologies that still require greater levels of R&D investments, making this kind of early investment required as a measure to maintain the sugar and alcohol sector.
4. Limitations
To improve this study, a well-to-wheel (WtW) life cycle assessment analysis would be required, thus improving the comparison of the indicators as well as making the analysis more robust. Other sensitivity analyses can also be made, analyzing the impacts of each indicator individually.
If a WtW assessment is done, it should be noted that other factors might appear as a bottleneck for some of these vehicles. For BEV, extensive modifications to the power grid are needed to support fast recharging and greater volume in electricity demand. There can also be considered the additional water demand for photovoltaic panels for the H2elec and BEV vehicles.
5. Final remarks
This study focuses on the comparison indicators for different technological routes in six different fleet penetration scenarios. For this, a projection of the Brazilian fleet of passenger vehicles is used, as well as indicators found in the literature are used to estimate their impacts in the scenarios.
It is found that a total fleet of electric vehicles for the passenger transport sector may require half the energy required by other routes, but it may require 10 times the occupied area. Water consumption can vary greatly depending on the scenario, with the scenario that only considers the penetration of fuel cell vehicles with hydrogen produced by electrolysis being the most demanding water scenario. Regarding infrastructural change, the direct ethanol fuel cell vehicles are the only vehicle that does not require any additional infrastructure.
Even so, this work analyzes some excluding and non-excluding routes, but an in-depth analysis would be necessary to understand what would happen with other fuels, such as gasoline and diesel, while the analyzed fleets penetrate.
For future works, when comparing the penetration of different routes, some other indicators can also be analyzed, such as the materials needed, tailpipe/indirect emissions, and the costs of each scenario. In this way, these indicators can enhance the analysis, to complement this study.

