


 Inglés (pdf)
 Articulo en XML
 Referencias del artículo
 Enviar articulo por email
 Citado por SciELO
  Citado por Google
  Similares en
SciELO
Similares en
SciELO  Similares en Google
 Permalink
1. Introduction
It is urgent to mitigate the sustained growth of C02 emissions in the atmosphere, which causes irreversible climate change. The limited consent for the community is 450 parts per million, which implies a temperature rise of 2ºC above the pre-industrial temperature. It is necessary, if they could produce irreversible effects for the ecosystem, among other consequences. For the concern in the medical field and the control of gas emissions (between C02), as well as in the field of research, as well as in the study of energy and environmental sustainability. In this sense, different policies and agreements such as the Kyoto Protocol are proposed. Of the combination of methods available in the state of the art, the improvement of Energy Efficiency is the one that has the greatest impact in this context. This implies more progressives in manufacturing technology, and the efficient use of resources to guarantee the longest possible life and improvements in technical efficiency. In this context, energy efficiency is understood from the supply side. Energy efficiency on the demand side implies a change in the consumption habits of users, which is difficult today. For this reason, there is a sudden increase in the energy transition time that refers to the substitution of one type of source for another. In recent years, a trend was created to favor the insertion of renewable energies in many countries through various laws and policies. This is the case in Argentina, where the last years have been dictated by renewables 26190 and 27191. However, the question arises: Is the massive insertion of renewable energies the most sustainable way? This work seeks to partially answer this question. To do this, if you present in this article a level of description and survey of the data of three types of renewable sources: Wind, Solar and Biomass. This is in order to use them in future work in relation to this problem.
The work is presented as follows, in section 2 a summary of the methods and materials used is presented. The state of the art, definition of the problem, modeling and proposed solution are presented. The types of generation surveyed are briefly described below: wind, solar and biomass. The main characteristics of generators, types, energy transformation, advantages and disadvantages are presented. Section 3 reveals the potential of renewable generation sources in the province of Entre Ríos, Argentina. Regarding wind power, graphs of probability distributions of wind speeds are presented, it is compared with the operating speeds of the wind turbines and the load factor of the device. Finally, section 4 presents the conclusions of the work.
2. Methods and materials
2.1 State of the art: problem, modeling and solution
The term generator refers to the device capable of transforming energy from a resource called an energy vector. If the resource is "inexhaustible" or its rate of regeneration is greater than the rate of consumption, it is considered renewable. If, in addition, the resource does not produce C02 emissions, or its emissions are absorbed in the emissions balance, it is considered clean. This is in accordance with the terms energy sustainability and environmental sustainability.
Energy sustainability, or also called energy sustainability, is defined by the World Energy Council (WEC), as the balance between three main objectives: energy security, social equity, and mitigation of environmental impact. The satisfaction of these three objectives requires complex consensus between the public and private sectors, between governments and regulators. Additionally, the economy must be considered, that is, the required investment costs.
Environmental sustainability refers to the efficient and rational administration of natural resources, in such a way that it is possible to improve the well-being of the current population without compromising the quality of life of future generations [1].
The Life Cycle Assessment (LCA) allows a design, investigation and evaluation of a production process and the associated environmental impact during the exploitation of the energy resource in question. The purpose is to evaluate the potential impact on the environment throughout its entire life cycle by quantifying the use of resources. There are specific procedures or guides to follow for the standardization of the LCA methodology by ISO, within the ISO 14040 family of standards [2].
ISO 14040: 2006: defines the principles and reference frameworks for environmental management and life cycle analysis. While the ISO 14044: 2006 standard: defines requirements and guidelines for Environmental Management and life cycle analysis.
The procedure for determining the LCA is as follows: first, the system limits are set, then the losses of the different subsystems are measured, making corrections in the power quality. Third, the economic-monetary conversion of energy is carried out, and finally the statistics obtained are analyzed [3]. Additionally, to obtain energy profitability, it is necessary to calculate the useful energy obtained, in addition to that invested. The relationship between the two is called the Energy Return On Investment (EROI). This is presented in eq. 1.
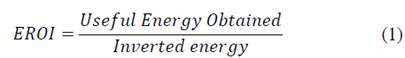
In reference [4], the present authors present the first theoretical study of EROI, together with the discussion of these aspects. The first step to determine the EROI is then to carry out a survey of the usable potential of the resources of interest.
Some of the difficulties in determining this index is the scope and limits of the model. For example, oil or its derivatives in themselves are not useful, if electrical energy, therefore the manufacture of generators should be considered. However: What if a generator factory must be located? Should it be considered in the LCA? These questions are still under discussion. Regarding renewable energies, the most used generation sources are presented below: wind, solar and biomass. Biogas is also analyzed within the biomass item.
2.2 Wind Generation
Wind turbines are machines that make it possible to capture energy from air masses into rotational energy through blades and transform it into electrical energy by means of a built-in electrical generator. The set of wind turbines is called a wind farm, whose extension depends on the type of generator and power. Although there are different construction types, wind turbines can be classified according to design power: from powers less than 1 kW to 10 MW. For powers less than MW, it can be classified as mini-wind and micro-wind. Additionally, it can be classified according to the position of the rotor shaft. They are classified as Vertical Axis Wind Turbines (Vertical-Axis Wind Turbines, VAWT) and horizontal axis wind turbines (Horizontal-Axis Wind Turbines, HAWT). In the case of VAWTs, the dimensions of the blades determine the volume of air that participates in the energy transformation process and consequently the design power of the generator.
The limit of power that can be extracted is given by the limit established by physicist Albert Betz. This limit that bears his name is derived from the conservation of mass and the moment of inertia of the air flow. The Betz limit indicates that a turbine cannot take advantage of more than 59.3% of the kinetic energy of the wind. Modern wind turbines get between 75% to 80% of the Betz limit.
For analytical purposes, the usable energy Ec of a wind generator can be initially approximated by:

Where:
K is a factor that is in the range of: 0.135≤K≤0.045.
D is the diameter swept by the rotor.
V is the wind speed: it is observed that the available energy is directly proportional to the cube of the speed. Wind speed is measured in m / s, and when its value exceeds 4 m / s, or 14 km / h, it is suitable for wind installations.
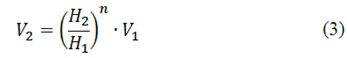
From this expression three reference values are broken down: from 1000 W / m2 the use is good, from 200 W / m2 the use is normal and below 50 W / m2 the use is bad, being energy / economically unprofitable the location of these plants. To obtain more precisely the energy obtainable from wind turbines, the wind statistics of the area must be studied, through measurements provided by the corresponding meteorological stations. The study of wind curves is based on probability distributions. This is because wind speed data is available from meteorological center surveys [5-6]. The data is generally measured at the height where the instrument is located, which is generally 10 meters. To extrapolate the measurement to other heights, other than those measured, the following equation is used:
For a study of probability distribution, in the state of the art they have the following distributions.
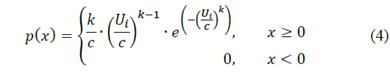
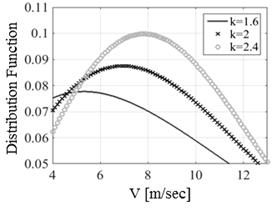
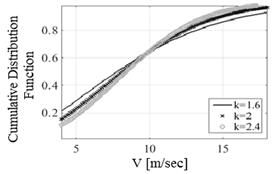
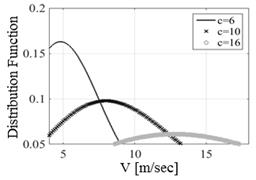
Weibull distribution: is a continuous distribution function that best represents a wide variety of wind regimes. This distribution requires knowing two parameters, the form factor k and the scale factor c. The scale factor gives information about how wide the distribution is and the shape parameter affects the curvature of the function.
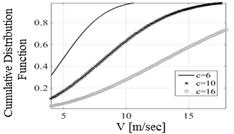
Weillbull distribution curves are shown in Figs. 1,2,3 and 4, varying the shape factors k and scale c. In this way, according to the parameters used, it is the optimal speed range, and therefore it will influence the load factor of the generator. In Fig. 1, it is observed that by increasing the scale factor the magnitude of the function increases and its maximum shifts to the right, increasing the maximum probability speed. In Fig. 3, as the shape factor increases, the maximum probability speed also increases, but the maximum decreases. It is observed in Figs. 2 and 4 that the cumulative probability is more sensitive to the variation of the shape factor than to the scale factor.
Source: The Author.
Figure 3 Weibull distribution with scale factors k = 6; 10; 16 and form factor k = 2.4.
Source: The Author.
Figure 4 Cumulative Weibull distribution with scale factors c = 6; 10; 16 and form factor k = 2.4.
Advantage: air is an inexhaustible resource and the energy it produces is clean and does not pollute. The emission of thousands of tons of carbon dioxide into the atmosphere is avoided, making it a very important element to curb climate change. Additionally, the resource is free and therefore saves on the purchase of fuel. The amount of energy produced can be estimated probabilistically, based on meteorological measurements. High powers can be obtained installed in confined spaces, compared to solar generation, which greatly reduces the land requirements for the installation of a wind farm.
Disadvantages: a first disadvantage is that due to the low density of the wind (and even more so at low speeds), the fact of producing high amounts of energy through wind turbines requires large spaces. Second, it is difficult for peak demand periods to coincide with high-generation periods, which tend to be at night. Third, wind turbines are mostly inductive, that is, they require reactive power to be able to generate. If the power system is unable to supply this reactive power, voltage instability and even system collapse can occur. Fourth, there are disturbances during normal system operation, such as: slow voltage variations due to changes in power flows due to the input or output of a wind turbine, rapid voltage variations due to changes in wind speed and voltage distortion due to the presence of harmonics. Finally, if any sector of the network is isolated and powered purely by wind turbines, failures in domestic electrical equipment and accidents to users may occur due to the quality of energy.
2.3 Photovoltaic solar generation
Photovoltaic solar panels consist of a cell that absorbs part of the sun's photons, made of silicon or another semiconductor material. Consequently, an electron is released and an electric current is generated. This current is suitable through inverters, power converters, etc. The energy produced is a function of the solar radiation characteristic of the location, the number of hours of sunlight and the constructive design of the panel with its complementary equipment. Its structure can be mono or polycrystalline, the latter being the most efficient and consequently the most expensive. Of the radiation that reaches the earth from the sun, part is absorbed at the surface (absorbed radiation, part is reflected and part is absorbed in the environment (diffuse radiation). If the direction of the radiation is perpendicular to the reflected surface, the energy absorbed at the surface will be optimal. Trackers are used to increase the energy production of photovoltaic solar panels. These devices are composed of mechanical systems, hydraulic, electrical and electronic mechanical systems that follow the path of the sun, thus capturing the maximum solar radiation for as long as possible The trackers can be of one or two axes, seeking a vertical or horizontal rotation or both, and that at all times the solar rays strike perpendicular to the surface of the panel [7-11].
Advantage: like wind power, solar power is a widely available and renewable source of energy. Solar generators are great for isolated systems, like remote rural areas, or geostationary satellites, for example. They are widely versatile to be applied in different installations. Finally, the radiant energy obtained can be predicted by means of known mathematical measurements and models (although affected by cloud cover).
Disadvantages: the hours of maximum availability of sun and of maximum demand do not coincide, at least in the residential case. Solar panels provide clean energy, however, their manufacture still depends on non-clean energy (fossil generation sources). Silicon or gallium arsenide have to be extracted from the Earth and then they are transformed in different processes to be able to place them on the panel, apart from other materials that make up the panel. Finally, the initial investment is high and large surfaces are needed to achieve adequate powers.
2.4 Biomass and biogas
Biomass is defined as organic matter of plant or animal origin, including those from its natural or artificial transformation, which can be converted into energy through biological or thermochemical processes [12-16]. From this wide range of resources, the following types of materials are mainly used: wood, vegetables (they are created specifically for their later use), forest residues (such as waste from tree felling) and Industrial waste (of various types), Solid Waste Urban (SWU). All these resources can be used as energy raw materials (fuels), in the various types of existing thermal installations. Normally its use will require a previous treatment for its best use. The recent use of solid urban waste has meant the incorporation of these materials, whose volume increases day by day in large cities, to energy production. From an energy point of view, biomass can be used in two different ways; burning it to produce heat, or transforming it into fuel for better transportation and storage. The nature of biomass is very varied, since it depends on the source itself, and can be animal or plant, but generally it is made up of carbohydrates, lipids and protids. Its use for energy purposes requires prior adaptation to be used, later in conventional transformation systems. This adaptation will be different depending on the type of biomass used, while in some cases a minimal cleaning and crushing of the material will suffice (physical processes), in most cases the process will be more laborious (chemical, biological or thermochemical processes). Biofuel is made up of fatty acids and alkaline esters, obtained from vegetable oils, animal fat and recycled fats.
Through a process called "transesterification" organically derived oils are combined with alcohol, in this case ethanol or methanol, and chemically altered to form fatty esters such as ethyl or methyl esters. These obtained products can be mixed with diesel or used directly as fuel in common engines. Another type of treatment to obtain fuels from organic waste is biodigestion. Biodigesters subject waste, generally manure or sewage, to the action of bacteria in an anaerobic environment, that is, without air. The result is biogas, which is produced in a closed container or tank called a biodigester, which can be built with various materials such as brick and cement, metal or plastic. The cylindrical or spherical biodigester has an inlet conduit through which organic matter is supplied together with water, and an outlet conduit in which the material already digested by bacterial action leaves the biodigester.
Advantage: the balance of C02 emissions is considered null, this is due to the fact that there is no energy expenditure in obtaining the resource, although there is for its processing. Additionally, if it is obtained from plant matter, CO2 emissions are offset by its absorption by photosynthesis. Its advantage over wind and solar generation is that as long as the resource is available, it can be produced at any time, and therefore it can be useful in high demand time zones. Biomass is mainly used to generate heat for industrial and domestic uses. Only a part of it, although increasingly important, is used for the generation of electrical energy. In this sense, this type of exploitation takes place through cogeneration systems. That is, systems that allow the simultaneous production and use of heat and electricity. There is not much danger in these plants, however there are fluids at high temperatures and the possibility of risks derived from their handling and generation must always be considered.
Disadvantages: while it is true that Municipal Solid Waste (MSW) are increasingly abundant, and that the production of plant materials suitable for later use as fuel has also increased. However, this resource cannot be compared to unlimited resources such as wind, sun, etc. The production of fumes causes pollution and annoying odors, due to the proximity of these plants to large cities. In some cases there are problems regarding the alternative use of raw material, which may be for the food sector. The production of biodiesel from soybeans could generate competition with this sector and shortages of this input. At the same time, there is the deterioration of the soil due to nutrient losses. Another drawback is the case in which the input associated with the waste has an alternative use with which it competes, such as the food industry or fertilizers. Therefore, there are multiple aspects that must be considered.
3. Survey of the potential of renewable generation sources in the province of Entre Ríos, Argentina
Regarding wind and solar generation, the data collected and plotted in this section were obtained from the records of the Gualeguaychu meteorological station, Argentina. These data are published by the Directorate of Hydraulics of Entre Ríos. Regarding biomass, data from the methodology called WISDOM were used, that is, Integrated Dendrofuel Supply and Demand Mapping, which allows identifying, quantifying and locating the production and demand of biomass as well as other eventual resources of this type not yet used. within a specific geographic area [14].
3.1 Potential in direct solar radiation
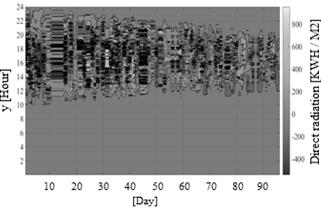
Solar radiation studies were used for a period of 4 months, corresponding to the Gualeguaychu meteorological station. These studies obtained the global solar radiation (total) and diffuse radiation (the radiation that is trapped in the atmosphere) per minute. The data were processed and presented in Fig. 5, where direct solar radiation is displayed in kWh per m2, which is the difference between global or total radiation and diffuse radiation. In this graph, the x-axis shows the day of the year, and the y-axis shows the corresponding month. The z-axis, represented by the color of the bar, represents the direct radiation received on a fixed flat surface. It is observed that the energy irradiance values are between 400 and 800 kWh / m2.
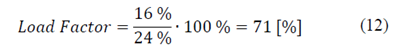
A load factor (LF) of around 24% is obtained, according to the hours of sunrise, the time when direct radiation hits the solar panel for energy transformation, and the obtained energy. The negative zone represents the effect of humidity by retaining energy from diffuse radiation, which is trapped in the atmosphere (diffuse radiation is greater than the global one).
3.2 Wind potential
Argentina's wind potential exceeds 2000 GW, 65 times the total installed capacity. Patagonia is one of the regions with the greatest wind potential, three variables are present almost simultaneously: direction, constancy and wind speed. There are regions with averages of 9 m / s. In an area of 1 km2 with 16 turbines 450/500 kW of capacity, 23
 can be generated.
For the wind potential survey, the records obtained from meteorological measurements in the Entre Ríos area were used. Through these records, it was possible to obtain graphical and statistical information on wind speeds. With these speeds, the load factor of wind power can be estimated using the operating curves of the considered wind turbine.
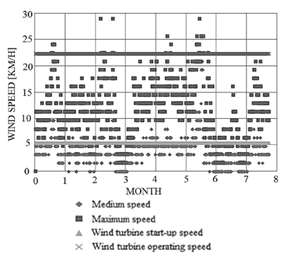
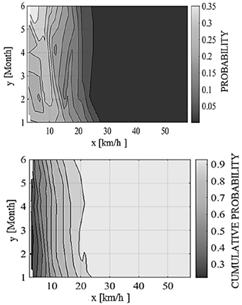
Fig. 6 presents the graph of the meteorological records with respect to the measured wind speeds in the Province of Entre Rios, Argentina. It also shows the minimum starting speed of the wind turbine (5 km/hr) and the speed of the wind turbine (22 km/hr). The minimum wind speeds are around the starting speed of the wind turbine. The maximum speeds are between the minimum operating speeds and the rated speed. Fig 7 shows the relative and cumulative probability distributions obtained from these meteorological records. In this way, the hypothetical operation of a wind turbine was estimated, see Fig. 8. Wind speed measurements are made using anemometers, installed at a height of 10 meters. Regarding Fig. 6, it is observed that there is fluctuation in the wind speed. In turn, it can be seen that the average speeds are less than 5 km/hr. This reverence value is, in turn, less than the starting speed of the wind turbine (Fig. 8). This fact is seen more clearly in Fig. 7, where the probabilistic distribution curves of wind speed and accumulated function are also presented. The abscissa axis is the wind speed, the ordinate axis is the analyzed month and the color represents the probability of occurrence of the wind speed. The average speed of the measurements is 3.8Km/hr, the starting speed is 5.4Km/hr and the engine speed is 22 km/hr. It is observed that speeds greater than those of the regime present a probability of less than 10%. That is to say, 10% of the semester, the generator will reach the normal operating or operating speed.
Source: The Author.
Figure 7 Plot of cumulative and relative probability distributions for the analyzed data in the Province of Entre Rios, Argentina.
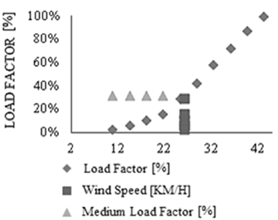
Therefore the load factor, in these conditions is low, which makes it not viable. Then, the height of the wind turbines is increased, in order to obtain wind speeds greater than these and consequently, improve the wind turbines load factor. So, from Eq. 3, if the height is increased to 30 meters, an average speed of 25km/hr is obtained. If a typical wind turbine operating curve is used, a Load Factor of 32% is obtained. It is seen to be a low load factor, compared to more reliable sources such as nuclear or fossil generation, which have load factors greater than 80%.
3.3 Biomass and biogas
Argentina has approximately 23.9 million hectares planted with transgenic crops, being the third most important world producer of transgenic crops and the second in Latin America. The activity is regulated by Law No. 26093, which is called the Regulatory and Promotion Regime for the Sustainable Production and Use of Biofuels. Said law establishes a goal of 5% of consumption diesel as biodiesel [16]. In Entre Ríos there are multiple sources of biomass: 6768 native forest sawmills, 153714 forest plantation sawmills, and 84450 rice mills.
Regarding crop residues in rice crops, 140000 ha have been identified so far in Entre Ríos (out of a total of 170000 ha), with the remaining 30000 ha located in other provinces. It is estimated that the potential of Entre Ríos in biomass / biogas is around 400 MW. Given that the demand is of the order of 4 % of the total demand (1.28 GW of 32 GW), 30 % of the total demand of Entre Ríos can be covered by this means. Of the 400 MW, Concepción del Uruguay can be assigned around 24 MW (6% depending on the proportion of the population). With a power factor of 0.85 it is equivalent to an installed power of 28 MVA. Given the large concentration of poultry industries in the province, the waste from these is considered for the production of biogas. For the raising and fattening of chicken, it is assumed that rice husk is used, instead of sawdust, for its assembly. This assumption is made for a number of reasons. In the first place, the abundance of this residue in the province and the difficulties of alternative use. Second, the use of sawdust makes it difficult to use chicken litters once discarded for biogas production.
Therefore, it is assumed that by provincial regulations it is required that chicken beds contain rice husk and that its residue be treated in biogas production plants. The biogas will be used for energy production and the fertilizer residues will be transferred to the breeding and fattening company. Additionally, half of the farms are mainly concentrated in the provinces of Entre Ríos (52%), mainly in the vicinity of large urban centers. At the country level, farms with a housing capacity of less than 50,000 birds predominate, the most frequent being family farms that house between 10000 and 20000 birds, located mainly in the provinces of Entre Ríos and Buenos Aires. In Entre Ríos the family-type structure predominates with a capacity of less than 30000 birds.
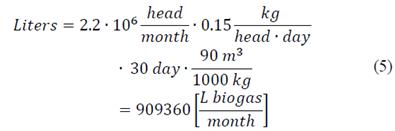
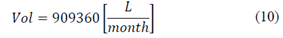
While in Buenos Aires, although family farms also stand out, larger farms predominate, with more than 100000 birds. In 2017, the national slaughter was 7.29 108 heads, and the provincial production was 52%, that is, 3.8 108 heads. Concepción del Uruguay is assigned 6% of the farms (according to the percentage of the population with respect to the province), then 2.2 106 heads in a month are obtained. Then the liters of biogas obtained per month are the following:
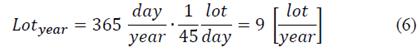
Additionally, the fattening period of each chicken is approximately 45 days. The quantity of lots is calculated as follows:
Then:
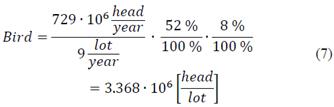
The result obtained corresponds to the number of bird heads per batch obtained after 45 days in Concepción del Uruguay.
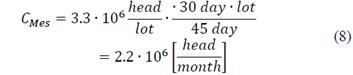
If this amount is transferred to a month, a number of heads/month is obtained as follow:
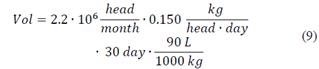
To calculate the volume of biogas available, since 0.150 kg of waste can be obtained for each head per day. From this waste, 90lt of biogas can be obtained in biogas for every 1000 kg of waste. Then the volume of biogas available corresponds to:
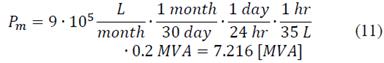
The use of cogeneration generators is supposed to allow the obtaining of electricity and heat, with a second gas turbine stage. This equipment is located at the place of interest. A reserve deposit is also installed on site. That is, assuming that there is user acceptance. The power of the generation equipment is 0.2 MVA, with a consumption of 35 L/ hr there is an average power of:
The load factor of the biomass power is then:
So, the Installed Power of the biomass resource is:
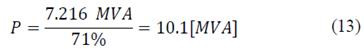
Therefore, considering only the poultry sector, there are potentially 10.1 MVA available to be used as generation input. If 0.2 MVA generation units are available, up to 50 generators can be installed. In conclusion, biomass and biogas can potentially be used as input to generate energy. These resources are also candidates to be used for Distributed Generation.
3.4 Life cycle analysis
Energy Returned On Investment (EROI) can be determined as follows:
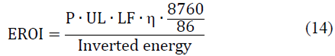
Where P is the installed power, VU is the useful life, LF is the load factor, η is the efficiency of the generators, 8760 are the hours in a year and 86 are the GWh per ETO. Invested energy can be estimated through a Life Cycle Analysis (LCA). Below is a brief description of the proposed methodology and the main results. The development of this methodology is complex and exceeds the space limitations of the article, therefore it is briefly described, seeking to develop the procedure in greater depth in future publications. Some references of works similar to the one proposed, carried out by other authors are [18-21].
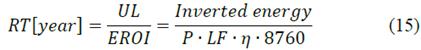
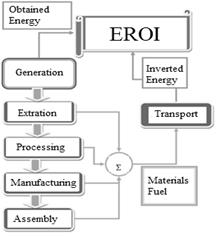
As can be seen in Fig. 9, in order to determine the denominator of the EROI, a Life Cycle Analysis is carried out, where the essential sectors to obtain the generator and the fuel necessary for its operation are divided. Waste is omitted for simplicity. In Fig. 9 a diagram of the Life Cycle Analysis used is shown. The 5 large sectors are extraction, processing, manufacturing, assembly and transport, the latter is distributed throughout the entire system. The transport sector is considered concentrated, this is like one more stage of the life cycle. Two inputs are considered: materials used and fuel required, where the cost of the generator fuel and the fuel required for transportation are estimated. In this way, energy costs are obtained, which are referred to in Equivalent Tons of Oil (ETO). For the determination of energy costs, two inputs were considered. In the first place, the composition data for each type of generation were used, according to the relative requirements of materials: polymers, iron, aluminum, copper, concrete and others (electronic devices). Second, the cost of fuel in transportation of each material used and the fuel required was estimated. In order to approximate the results, it was considered that the transport sector is made up of three devices: truck, train and ship. In this way, all energy expenses were added, which together with the useful energy obtained allow obtaining the EROI. If the Useful Life is divided by the EROI, an estimate of the time required to recover the invested energy as follows:
Source: The Author.
Figure 9 Life Cycle Analysis to calculate the Energy Returned On Investment (EROI).
The technical data of the generators used are presented in Table 1: Load Factor (LF), Efficiency, Useful Life (UL), Energy Returned On Investment (EROI), Recovery Time, Installed Power, Inverted Energy and Obtained Energy. These information obtained is a contribution of the present investigation. It is observed that the generation source with the highest load factor is biomass, followed by wind generation and later photovoltaic solar. From the technical data of the generators and the LCA, the Inverted Energy, Obtained Energy and EROI was obtained, which is presented in Table 1. To facilitate comparison, an installed power of 10 MW is taken for the three generation sources.
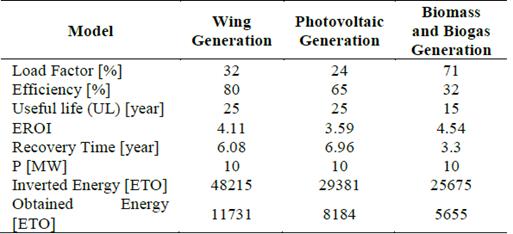
It is observed that the one with the highest EROI is biomass generation, followed by wind and finally solar. Therefore, the source with which the invested energy is recovered faster is biomass generation, since it takes 3 years. The results are consistent and, therefore, with the proposed methodology, results were obtained in accordance with reality.
4. Conclusions
The article proposes a theoretical and methodological contribution to evaluate the energy and later economic profitability of renewable generation projects. The contribution is novel since it obtains extremely important information that is discussed in the state of the art, the Energy Returned on Investment (EROI). The EROI measures the relationship between the Invested Useful Energy and the Obtained Energy, which is useful to know how much the energy benefit is in proportion to the energy cost invested. In this sense, the energy potentials and load factors necessary to determine the limitation and energy profitability of generators based on a renewable generation source were surveyed. The three sources have advantages and disadvantages to favor or prevent their implementation as projects, which were presented in the state of the art of this work. Solar generation is relatively predictable, but has drawbacks in that the moment of maximum generation does not coincide with the moment of maximum demand. Wind generation has the same drawback, which is also unpredictable. The main argument in favor of biofuels is the absorption of carbon dioxide (C02), so it follows that the balance is zero or close to zero. When the combustion is complete, all the fuel is transformed into C02 and water vapor, however, the trees and plants that are growing capture it again. In practice, combustion is generally incomplete. The first reason is due to the non-uniform distribution of air in the mixture and therefore, the necessary oxygen is not available to transform all the carbon intoCO2.
In this situation, carbon monoxide (CO), hydrocarbons (HCs, for example methane), N20 and other materials are also formed, which can generate serious impacts on the health of users and are also greenhouse gases. Therefore, an extensive and complex cost-benefit analysis of biomass / biogas is required. Regarding the survey, based on the results obtained, from the point of view of profitability and time, the most convenient renewable generation source is biomass generation. The other sources require investments that minimize energy costs in manufacturing and transportation, to improve their EROI. The biomass and biogas potential of Entre Ríos is promising. However, there are problems regarding combustion gases and odors due to their storage. This would generate inconvenience and damage to users. In turn, the low speed and frequency of wind in Entre Ríos makes it difficult to implement wind projects, requiring great heights to obtain good efficiency. It is intended to use the results of this work for future work to solve multiobjective optimization problems in energy economy. It is also intended to deepen the calculation methodology of the EROI in order to include it as material for discussion and deepening.
5 Referencing bibliography, tables and figures
BG: Biomass-based generation.
EG: Generation based on Wind Energy.
EROI: Energy Return on Investment.
ETO: Equivalent Ton of Oil.
LCA: Life Cycle Analysis.
LF: Load Factor.
MSW: Municipal Solid Waste.
OM: Overview Mapping .
RT: Recovery Time.
SG: Generation based on Solar Energy.
SUW: Solid Urban Waste.
UL: Useful Life.
WISDOM: Woodfuel Integrated Supply / Demand RT.

