


 Inglés (pdf)
 Articulo en XML
 Referencias del artículo
 Enviar articulo por email
 Citado por SciELO
  Citado por Google
  Similares en
SciELO
Similares en
SciELO  Similares en Google
 Permalink
1. Introduction
Companies play an essential role in mobility since they are considered primary producers of daily commutes [1-3]. In recent years, some companies have developed a variety of initiatives to improve their employees' mobility [4]. The creation of bicycle incentive programs is an example of these corporate mobility initiatives. Many European countries, including Germany, Belgium, Denmark, France, the Netherlands and Great Britain, developed incentive programs with different inducements. Some of them are economic, such as tax exemptions, payments per kilometer and financial support for bicycle purchase [2,5,6]. In Brazil, efforts to promote the use of bicycles for commuting to work are very recent. Some cities are expanding their bicycle path network and promoting actions to stimulate this type of transportation.
However, the projects and actions lack previous studies to analyze employee behavior and the impact that stimulus measures could cause.
Bicycle use offers several benefits for the individual: it improves physical fitness, increases cardiorespiratory capacity, and reduces the risk of developing cardiovascular diseases, obesity, and depression [7-11]. Daily use of the bicycle for commuting presents greater advantages than leisure use, only at weekends, since the benefits observed are more significant when there is regularity [8,12]. This mode of transport helps individuals to be physically active in their daily routine and helps to replace trips currently performed by motorized modes.
The benefits of cycling are not limited to users of this mode of transportation and society. Studies show that the regular use of this mode of transport brings gains for companies. From the companies' perspective, these benefits are related to improving the quality of life of its employees, generating a reduction of absences from work, turnover reduction, increase in productivity, and improvement of staff state of mind [13].
A variety of studies in the international literature have analyzed bicycle transport [14], even in the Brazilian context [15-17]. However, these studies mainly analyzed cyclist behavior, identifying factors that influence route choice and frequency of bicycle use. This information helps determine policies and strategies to favor cyclists, even if they are not regular users [18]. Few of these studies refer to bicycle trips exclusively to work [19].
This study aims to identify the issues most valued by the potential users of cycling in work trips and evaluate the impact of stimulus strategies on bicycle demand. For this, a case study was carried out with Companhia Riograndense de Saneamento (CORSAN) employees in Porto Alegre, Brazil, through a stated preference survey. The adopted technique allows the analysis of the users' preference against non-existent conditions and quantifies the impact of the implantation of strategies. Discrete choice models were estimated to determine the choice of bicycle use and analyze the likelihood of use in different scenarios [20-22].
Ordered logit models [23] were estimated since the response alternatives have an ordered nature that provide additional information for the model specification [24].
2.Method
2.1 Sample
The analysis population comprises 717 employees of CORSAN Headquarters, who carry out their activities in 3 distinct buildings, located in the historic center of Porto Alegre. Details of the study area can be found in studies developed in the same region [25,26]. We determined the survey sample size by calculating proportion estimators in simple random samples, specifying a minimum of 125 respondents. The confidence level adopted was 95% with 5% average permissible error.
Online surveys were issued during October 2016, using the Survey Gizmo virtual questionnaire tool [27]. The questionnaire was sent to all employees at CORSAN headquarters, resulting in 222 complete responses. We eliminated some responses by considering the following criteria: (i) inclusion of only those employees who considered themselves able to use a bicycle and did not declare physical or health limitations that made it impossible to use this mode (7 respondents excluded); (ii) inclusion of employees who consider that they reside at a cycling distance from the workplace (78 respondents excluded); and (iii) exclusion of employees who already use this mode to go to work (10 respondents excluded). These employees would not be affected by the proposed strategies. The treatment of the data resulted in a total of 127 respondents for the analysis, representing 17.71% of CORSAN headquarters’ employees.
2.2 Experimental design
Stated preference techniques use experimental projects to construct hypothetical alternatives to be presented to respondents. The experimental project considers five attributes, with two levels each. The levels indicated the presence or absence of the considered attributes. We selected the attributes based on a bibliographic review of international literature. The selected attributes were:
I. Locker room: changing rooms with shower and closet [27-31];
II. Bicycle parking: internal and secure bicycle rack [29,30,33,34];
III. Training: training to cycle on the street [35,36];
IV. Loaner: bicycle loaner programs that allow employees to use a bicycle to commute [9,11,37,38];
V. Bicycle path: bicycle path in the main access routes to work [9,10,39,40].
We did not include financial incentives to employees in the survey because CORSAN is a public company. The possibility of providing differentiated payments for some employees would need to be discussed in collective agreements, with the risk that the measure would be judicially challenged, causing damages to the company.
The experimental design was built using efficient designs [41] and implemented in the NGene software [42]. We chose efficient designs to generate parameter estimates with standard errors as small as possible, improving the model estimates' accuracy. Efficient designs require initial values for utility function parameters. As there was no previous information available on the parameters, a usual procedure was adopted in these situations, involving the following steps [41]: (i) Initial design - considering only the parameter sign of each attribute. From these values, we generated the first D-efficient design. (ii) Pilot survey - we conducted a pilot study with 60 individuals using the initial design. (iii) Parameter estimation - we estimated multinomial logit models to update the initial values of the parameters used in the initial design. (iv) Final design - we used the new parameters to generate a final D-efficient design.
The final design resulted in 12 choice situations. The measure of efficiency adopted was the D-error, which is the determinant of the variance-covariance matrix (AVC), for only one individual. The D-error of the final design was 1.3 [42].
2.3 Survey
The survey contains three sections: (i) characteristics of individuals and personal habits; (ii) perception of the route between home and workplace; and (iii) stated preference experiment (SP).
The first section involved questions about respondents' socioeconomic characteristics, such as age, gender, education, family income, neighborhood of residence, and children. This step also included questions on commuting habits and daily activities, such as after-work appointments, the distance between home and workplace, modes of transportation used, commuting time, availability of bicycles, the existence of bike-sharing stations close to home, use of bicycles, self-assessment of cycling ability, and the existence of cycle paths between the residence and CORSAN.
The second section focused on the perception of the route between home and CORSAN. The interviewees were asked to evaluate the best possible route on a ten-point Likert scale, according to the quality and availability of cycle lanes, road safety, public safety, slope, and visual attractiveness.
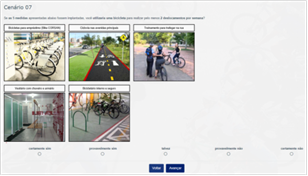
The third section consisted of the presentation of the 12 choice situations to the respondents. In each situation, the respondent was asked if they would perform at least two bicycle trips a week if certain strategies were implemented. The answers were requested on a probabilistic scale: (1) certainly not; (2) probably not; (3) perhaps; (4) probably yes and (5) certainly yes. The questionnaire presented images illustrating the choice situations to facilitate the understanding of the scenarios. Figure 1 shows an example of the SP choice situation (in Portuguese).
2.4 Modeling
We estimated an integrated choice and latent variable (ICLV) model to study the bicycle use decision. The perception of the route was added to the discrete choice model as a latent variable, combining the classical choice model with the structural equations approach for the latent variables. ICLV updates the classical choice models by incorporating latent variables describing attitudes and perceptions of individuals to represent the decision-making process more adequately.
We used perceptual indicators about the route between the home and workplace questions (third section of the questionnaire) to represent the latent variable Route perception (reflexive model). In particular, the indicators referred to visual attractiveness of the route (Attractiveness), slope of the terrain (Slope), public security (Security), traffic safety (Safety), route quality (Quality) and general perception of the route (General perception). These indicators were modeled using an ordered choice model. Figure 2 shows the model structure adopted.
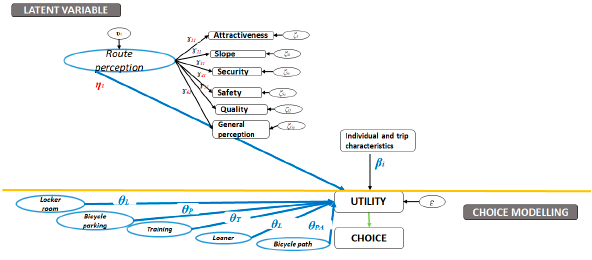
θi: parameters SP for atribute i; η1: structural term for route perception; ɤ11 to ɤ61:indicator parameters; βi: individual and trip characteristics parameters ; ζSa, υ1 and ɛ: error terms.
Source: Own elaboration
Figure 2 Model structure
For modeling purposes, we consider the questionnaire response of the SP alternatives as an ordinal variable, represented by a probability distribution among the five response categories presented, assuming the values 1, 2, 3, 4 and 5 if the individual chose ‘certainly not’, ‘probably not’, ‘perhaps’, ‘probably yes’ and ‘certainly yes’, respectively. The response categories are separated by four intermediate thresholds, defined as µj, where j ranges from 1 to 4 [24]. Equation 1 presents the generalized probability of the discrete choice model for the individual q being in a given category [24]:
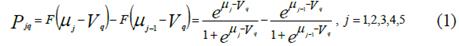
Wherein, P iq is the probability of choice of the subject q being in the category between the thresholds (j-1) and j; F(ε) is the logistics cumulative function (for j=5, the function F(µj-1 -V q ) adopts the value 1, and for j=1, the function F(µj-1 -V q ) adopts the value 0); V q is the representative component of utility for the individual q; and µj, and µj-1μ_(j-1) are the upper and lower limits of the category analyzed.
We divided the observed independent variables into two categories: (i) those related to strategies to stimulate the use of bicycles presented in the SP experiment and (ii) the socioeconomic habits of individuals, used as control variables. The selection of the independent variables included in the model was based on a backward elimination process, using a significance level of 5%.
The structural equation model, to specify the latent variable and its indicators, was added to the formulation of the discrete choice model. The parameters of both models were estimated simultaneously by the maximum likelihood method using the Pandas Biogeme software [42].
The estimated coefficients do not directly reflect the impact of the independent variables on the chances of being in a higher category. To compare the effect of the observed independent variables, measured at different scales, the marginal effects of these variables on the probability of bicycle use were calculated [24]. The marginal effects of individuals were aggregated using the sample enumeration method [21]. The marginal effect reported the impact of a variation of the observed independent variable on the probability of using a bicycle and is presented in Equation 2:
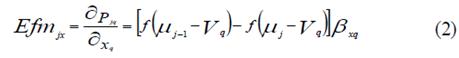
wherein Efm jx is the marginal effect in category j caused by variable x; f is the logistics distribution function; β xq is the value of the variable x for the individual q; and Pjq, Vq, µj, and µj-1 are defined in Eq. 1.
The model was validated with the same sample used in the estimation of the models. The validation was based on two metrics: Pearson's Chi-Square test [44] and the Sprague and Geers metric [44].
2.5 Simulation of scenarios
We simulated seven policy scenarios using the estimated model. These scenarios have made it possible to assess the impact of CORSAN policies on bicycle use. The evaluated scenarios considered implementing several strategies to stimulate bicycle use, individually and jointly, combining those that presented the greatest impact. These scenarios were compared to the current situation, with no strategies implemented.
3. Results
Table 1 presents the model estimates to represent the probability of cycling to work at least twice a week. The table also shows the descriptive statistics of the significant variables in the final model, sample proportions for categorical variables, and the mean and standard deviation for the continuous Distance variable.
Table 1 Model Variables and Parameters
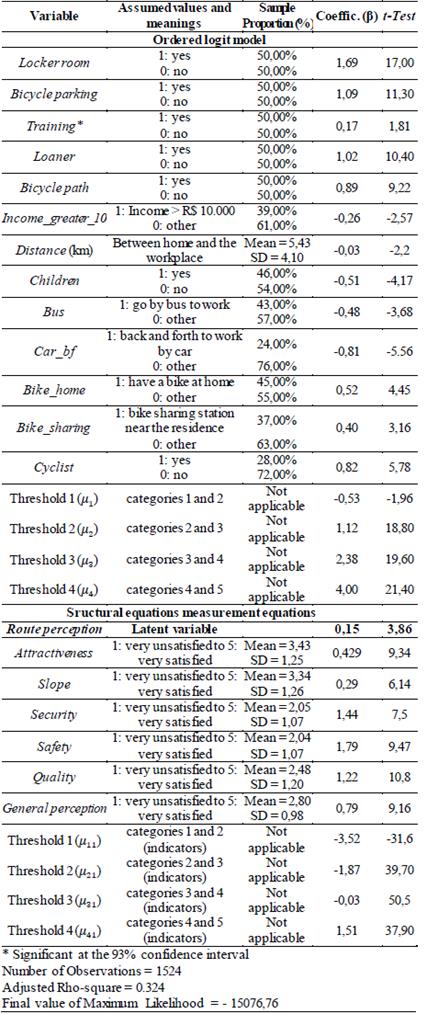
The indicators threshold were significant at the 95% confidence level. SD: Standard Deviation
Source: Own elaboration
The first five variables in Table 1 present a sample proportion of 50% to balance the effects produced by the controllable factors in the analyzed responses. Balancing is desirable in the design of experimental projects to meet statistical requirements, making analyses more robust. A sample proportion of 50% refers to the number of scenarios in which the variable was included in the SP Survey.
The model adjustment indicated by the Pseudo-R² = 0.324 was satisfactory, considering that values above 0.4 are considered great adjustments for these types of models [20]. Most of the model variables were statistically significant at the 95% confidence level (p-values less than 0.05) [21], except for Training, which was significant at the 93% confidence level.
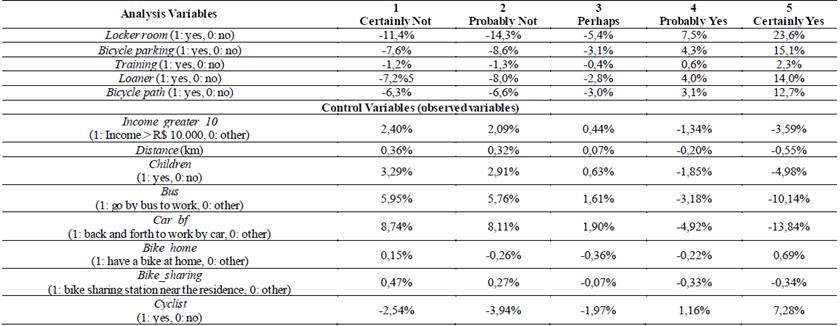
The Chi Square Pearson test showed a value of 4615.52, below the critical value of the distribution for 95% confidence (χ 95%, 19812 =20140.55) showing the suitability of the model. The Sprague and Geers metrics showed the following values: 0.3 corresponding to the magnitude of the error (MS&G), 0.27 the magnitude of the phase (PS&G) and 0.4 the global error (CS&G). These values are lower than 0.4 (equal for CS&G), which is the value proposed as a reference for the model to present an acceptable fit. Table 2 summarizes the marginal effects of the independent variables on the probability of cycling.
4. Discussion and simulation of scenarios
Contrary to traditional linear regression or multinomial logit models, the signal or magnitude of the coefficients estimated in the ordered models is not that informative about the effect of the explanatory variables. However, positive signs refer to higher probability of using the bicycle while negative to lower ones.
The effect of the change on a variable in the model depends on all other parameters, the observed data, and the category of interest [24]. Thus, the analysis of the impact of independent variables should be performed by calculating the marginal effects. A positive effect indicates growth in the probability of choice of the analyzed category, while a negative impact indicates a decrease [24].
The analysis of the signs of the marginal effects presented in Table 2 shows that the implantation of locker rooms, bicycle parking, bicycle loans, bicycle training for employees, and the presence of cycle paths for access to CORSAN, stimulate bicycle use for work trips. These variables present a positive sign in the marginal effects of categories 4 and 5, indicating an increase in the probability of bicycle use. This result coincides with those reported in other studies in the literature [9-11,32,35,37-39]. The comparison of the magnitude of effects, represented in categories 4 and 5, indicates that the implementation of locker rooms with showers and lockers (Locker room) is the most effective measure in encouraging bicycle use, and the availability of training for employees (Training) is the one that causes less impact.
A cycleway in the main thoroughfares (Bicycle path) had the second smallest marginal effect among the analysis variables, behind the variables Locker room, Bicycle parking, and Loaner. This result differs from those obtained in other studies [10,31,45], which indicates that a well-connected bicycle network is the primary stimulus factor for bicycle use. This difference can be explained by the urban context of CORSAN, which already has a connected cycling network that allows access to different places in the city. Thus, other facilities in the workplace can be perceived as a priority, presenting a greater impact in this modal stimulus.
The analysis of the marginal effects of control variables indicates that employees with higher incomes (greater than R$10,000, corresponding to middle/high income), who live at a greater distance from work and have children, are less likely to adopt a bicycle for trips to work. The existence of children in the family (Children) was the variable that presented the greatest impact among these socioeconomic variables, being a critical element for discouraging the use of bicycles on the work trip. This result is in line with the studies observed in the literature [27,45]. The negative impact of this variable may be related to the performance of chained journeys; that is, employees may not carry out work-to-work trips directly when moving, or intermediate stops are required to leave or pick up their children.
Income_greater_10 (middle/high income) also presented a high impact, as observed in other studies [11,49-51]. Distance showed a marginal effect of low magnitude, contrary to the literature [49,52,53]. This behavior may be explained because we removed individuals residing too far from their workplace from the sample. Therefore, the employees who composed the sample reside reasonably close to CORSAN, reducing the variability of this variable and reducing its importance. Studies show that distances between 5 and 7 km are the ideal radius for urban cycling trips [54,55].
Although some studies point to a reduction in the likelihood of bicycle use among women [11,49,56], no relationship was found between gender and the odds of cycling, so this variable was not included in the final model.
Regarding the impact on users who use buses and cars for their usual commuting, the results show that the use of buses or cars in daily commutes decreases the chance of adopting a bicycle. Two elements can explain this decreasing tendency for bus users. On the one hand, due to bus terminals near CORSAN, offering a wide range of itineraries in the region, favoring bus use and generating resistance to the change of pattern of the displacements. On the other hand, people who do not pay for their travel tend to be more resistant to changing their transport mode [44,46]. CORSAN provides transportation vouchers to its employees, obeying the legal limits of discount, it being, for some employees, a perceived benefit. The relationship between car use and the decrease in cycling probability is in line with the literature [46,53].
The availability of bicycles at home or near bike-sharing stations (Bike_home and Bike_sharing) presented a low impact, not representing a limitation or a stimulus for bicycle adoption on work trips. This result is contrary to some studies that suggest a positive relationship between availability and bicycle use [9,11,37,38]. However, in the survey, most of the employees surveyed (61%) reported having bicycles available, either themselves or at bike-sharing stations near their residence, influencing the impact of this variable. In addition, the purchase price of a bicycle is lower than that of automobiles and does not represent a barrier to the adoption of bicycle mode.
Individuals who regularly cycle, represented by the Cyclist variable, showed a greater propensity to use the bicycle for commuting. This result was expected since these individuals are characterized by a favorable behavior to this modality [52,58].
Regarding the latent variable Route Perception, the results show that this variable positively influences the utility of cycling. People who consider the route between home and CORSAN in better conditions are more likely to cycle to work. Also, the results suggest that the observed indicators adopted (regarding quality and availability of the bike lanes, road safety, public safety, slope, and visual attractiveness) reflect the effects of the latent variable. Safety and Security are the most important indicators. The importance of these aspects is in line with the results of previous studies performed in Global South cities [25,58,60-62].
Comparing the impact between the analysis variables included in the SP experiment and the control variables, showed that the former had a higher effect than the second. This result was also reported by other studies found in the literature [38,63].
The reported marginal effects represent the impact of each variable in an average situation, that is, considering an increment in the variable under analysis and keeping the remaining variables in their mean values. Thus, the value of the effect varies when calculated at different points in the probability distribution curve. We performed a scenario analysis by applying the estimated model and computing the demand to verify the impact of different strategies concerning the current situation of CORSAN, considering the sample characteristics.
Seven scenarios were simulated and compared to the current situation of CORSAN. The SP experiment did not include any of the strategies of this scenario analysis. The first five scenarios assess the specific impact of implementing strategies such as (1) locker rooms with shower and closet; (2) internal and secure bicycle parking; (3) training to use the bicycle on the street; (4) bicycle loaner program; and (5) bicycle path in the main access routes to work. Scenario 6 refers to evaluating the joint implantation of locker room and bicycle parking, while scenario 7 verifies the impact of the locker room, bicycle parking and loaner program, simultaneously.
Table 3 summarizes the impacts observed in each of the seven scenarios. The table presents the Base Situation (SB), the Impact of the Measure (IM) and the Future Situation (SF), with the distribution of probabilities in the five response categories analyzed. We represent the probabilities as follows:
P1- Certainly Not performing bicycle trips;
P2- Probably Not performing bicycle trips;
P3- Perhaps performing bicycle trips;
P4- Probably performing bicycle trips;
P5- Certainly performing bicycle trips.
The probability of cycling at least twice a week to travel to work corresponds to the sum of P4 and P5, indicated in the table as PUB (Probability of Bicycle Use). The minus sign indicates a reduction in the probability.
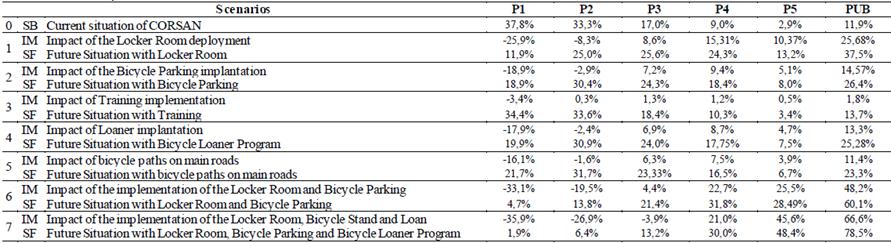
The PUB in the current situation (SB), without any of the proposed strategies, corresponds to 11.9%. The previous percentage corresponds to 15 individuals considering the sample of 127 employees. This result is in line with that obtained in the research, in which 12 employees reported using a bicycle for commuting to work, verifying the suitability of the estimated model.
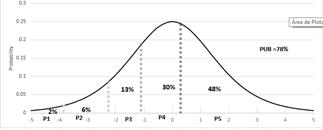
Analyzing the implementation of the individual strategies, the placement of locker rooms would represent an increase in bicycle use of 26%, making the bike market share reach approximately 38% of the employees. The implementation of other strategies would lead to smaller market shares, up to 15%. The joint implementation of strategies shows that locker rooms and bicycle stands would increase the market share to 60%. By adding the bike loaner program, the market share would be 78%. These percentages would correspond to 76 employees (60% of 127 respondents) and 100 employees (78% of 127 respondents), respectively. Figure 3 shows the impact of the three joint strategies deployed and the distribution of probabilities in each response category, compared to the current scenario, without any of the proposed improvements.
The quantification of this market share in absolute value for the population cannot be inferred from the results. Still, a range of variation can be estimated by adopting some hypotheses. Assuming that the proportions of physically and spatially limited employees (residing at a non-cycling distance) observed in the sample remain in the population analyzed, the number of employees eligible for cycling would be 440. Considering an optimistic scenario, that the total of this population has an interest in using the bicycle, the results would indicate that 343 employees would use a bicycle at least twice a week to travel to work. Considering a pessimistic scenario, in which only the sample studied is interested in cycling, this result would represent 99 employees who would use a bicycle to travel to work.

5. Conclusions
The study showed the impact of stimulus strategies on bicycle use on work trips through a case study with Companhia Rio-grandense de Saneamento (CORSAN). The estimated models showed that the implementation of locker rooms, bicycle parking, a bicycle loaner program, training for employees in bicycle use and the presence of bicycle paths for access to CORSAN, encourage cycle use for commuting. The company itself can implement the first four strategies, while the last one (bike paths) depends on government actions.
The analysis of the magnitude of the marginal effects indicated that the implantation of locker rooms with showers and closets is the most effective measure to stimulate bicycle use in commuting. The provision of bicycle paths on the main access routes would have a minor impact on the increase in this mode market share, probably due to a current connected cycling network in the CORSAN environment. The results showed that automobile use in the daily commutes decreases the tendency to adopt bicycles for commuting. Disincentives to car use could be considered in the region to encourage bicycle use.
The implementation of locker rooms, bike stands, and bicycle availability for bike loans to employees would increase the market share to 78%, representing a significant percentage increase compared to the current situation (a 66% increase over the current situation). Implementing these strategies would motivate 99 (pessimistic scenario) to 330 (optimistic scenario) employees, out of a total of 717, to adopt bicycles to commute at least twice a week. Locker rooms and bike parking could be offered without involving high costs. Locker rooms would be easily implemented with upgrades to the company's existing toilets, while the bike parking could be allocated somewhere presently idle inside the buildings. The availability of bicycles for lending involves higher costs due to the need to purchase equipment and the availability of maintenance staff. This measure can be implemented in a second stage, according to the observed demand.
The procedures adopted in this paper can be easily applied in other companies, expanding research of this nature in different contexts. Also, variables related to the type of adjacent vehicle traffic, climate, built environment (such as slope and public safety) could be added. Understanding individuals' behavior in their daily commutes can help develop strategies to stimulate active transport in other institutions, such as companies and schools. Their role in encouraging active modes is vital, promoting environmental and economic benefits and contributing to a better quality of life for the population.

