


 Inglés (pdf)
 Articulo en XML
 Referencias del artículo
 Enviar articulo por email
 Citado por SciELO
  Citado por Google
  Similares en
SciELO
Similares en
SciELO  Similares en Google
 Permalink
1. Introduction
Cities face several environmental challenges, especially in developing countries, such as vegetation loss and degradation, and air, water, soil, visual, and noise pollution [1]. Among these, pollution caused by noise directly affects human health and psychological well-being [2,3].
An increasing number of people have been exposed to urban noise and its harmful effects on health [4]. For this reason, this type of pollution is a concern for urban health management, as it affects communication and causes sleep disturbances, stress, cardiovascular problems, mental health damage, productivity decrease, social behavior disturbances, and discomfort [4].
In this context, vegetation has contributed to reducing outdoor noise pollution in urban areas by blocking and absorbing part of the sound waves [5,6]. This happens because tree leaves form a surface area for noise absorption. Also, plants can help reduce noise by transferring sound to other objects, changing the direction of the sound, returning the sound to its source, doubling the sound waves around an object, and mixing unwanted sounds with more pleasant sounds.
Moreover, natural elements in cities generate natural sounds that are perceived as positive by people, in contrast to noise pollution. This is due to the existing soundscape in green areas which corresponds to the acoustic environment associated with different types of sounds, both natural and generated by human activities [7].
However, barriers against noise pollution not only need to address the noise, but also be multifunctional, responding appropriately to the landscaping and the landscape quality, promoting both good visual and sound qualities [8]. Hong and Jeon (2014) explain that this is because eyesight and hearing are the main factors which enable people’s perception of the urban environment.
Research suggests that there are interactions between the perception of the visual and acoustic environments and that the sound environment quality has a similar effect to the visual environment concerning stress relief [9,10]. Thus, an analysis of the sound-visual quality of an environment can indicate the performance of the vegetation to promote relaxation, satisfaction, and well-being to people [5,8].
Nevertheless, landscape quality assessments commonly address only the visual aspect or are based on human preferences regarding sound and visual environments [11-14]. Quantitative noise emissions and their mitigation by vegetation are often not considered in landscape research. Thus, there is a gap of evaluation methods that mutually consider aspects related to noise attenuation barriers and the visual valuation of the landscape considering the presence of vegetation.
Therefore, in aiming to understand the relationship between landscape visual and sound attributes in urban green areas, the objective of this study was to evaluate the landscape’s visual and sound quality influence on propagating noise pollution in urban parks in the city of Curitiba, Paraná, Brazil.
2.Methods
2.1 Study area
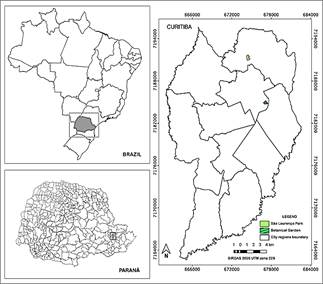
This study was conducted in two green areas located in the city of Curitiba: the Francisca Maria Garfunkel Rischbieter Botanical Garden (from now: Botanical Garden) and the São Lourenço Park. Curitiba is located in the southern region of Brazil (Fig.1), with ground-zero at the coordinates 25º25'40” S and 49º16'23” W, with an average altitude of 934.6 m [15].
Source: The authors.
Figure 1 Study area; Green areas in Curitiba, Paraná, Brazil, considered in this study.
The climate of Curitiba is Cfb or humid subtropical according to the Köppen-Geiger climate classification, characterized by summers with mild temperatures (averages of 20.5 ºC) and moderate winters, with average temperatures of 13.0 ºC [16]. The average annual precipitation is 1587.52 mm and the average annual relative humidity is 81.94% [17].
The municipality is located in the Montana and Alluvial Mixed Ombrophilous Forest and in Grassland phytogeographic regions, which are inserted in the Brazilian Atlantic Forest [18].
The Botanical Garden covers an area of 178,000 m² and is located in the eastern portion of the city on the edge of the Botanical Garden neighborhood with the BR-116 highway, at 25º26'31” S and 49º14'19” W, bordered by the Prefeiro Maurício Fruet and Prefeito Lothário Meissner avenues, the Engenheiro Ostoja Roguski street, and a railroad [19]. São Lourenço Park is located in the northern part of Curitiba and has an area of 203,918 m² [20]. It is located at the geographical coordinates of 25°23'01,983” S and 49°15'58,235” W. The park is bordered by the Mateus Leme (to the west), José Brusamolin (to the north), and Professor Nilo Brandão (to the south) streets.
2.2 Methodological procedures
There were three monitoring areas selected within the two study areas. The monitoring areas were next to the park’s limits, and adjacent to roads with intense vehicle traffic. A selection criterion for these areas were having at least 60 x 60 m of vegetation so that there was no transversal noise interference at the monitoring points, being chosen according to Oliveira et al. (2018).
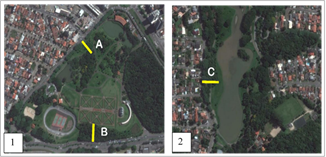
Three vegetation density levels were determined and therefore two green areas were chosen: the Botanical Garden, with two monitoring points: Location A (latitude 25°26'26.48" S, longitude 49°14'23.65" W) with low vegetation density, and Location B (latitude 25°26 '38.28" S, longitude 49°14'21.82" W) with medium vegetation density; and São Lourenço Park, with one monitoring point: Location C (latitude 25°23'5.64" S, longitude 49°16'4.39" W) with high vegetation density (Fig. 2).
Source: The authors.
Figure 2 Green areas in Curitiba, Paraná, Brazil; 1 - Botanical Garden; 2- São Lourenço Park; A - Monitoring area with low vegetation density; B - Monitoring area with medium vegetation density; C - Monitoring area with high vegetation density.
2.2.1 Noise pollution assessment
Noise pollution was simultaneously measured with photograph taking on weekdays for the visual assessment. Measurements were performed during peak hours between 4:30 pm and 7:00 pm, on days with meteorological conditions with the absence of rain and or strong wind, following the recommendations of NBR 10151:2000 [21] for standardization of measurements and absence of interference.
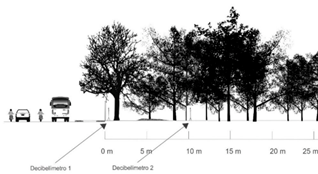
The method proposed by Oliveira et al. (2018) was used to assess the influence of green areas on noise reduction, by which two sound pressure level readers/decibel meters model DEC-470 (accuracy of ± 1.5 dB) recorded environmental sound at distances of 0, 5, 10, 15, 20, 25, 30, 35, 40, 45, 50, 55 and 60 m in the three monitoring sites (A, B, C), as previously described (Fig.3). Simultaneous measurements were performed in two different conditions: one at the source of the noise on the edge of the avenue, and the other at different distances from the source, with three repetitions (5 min of collection, each 30 seconds apart) [6].
Source: [6].
Figure 3 Position of measuring devices in relation to distances and noise source with two simultaneous measurements
2.2.2Visual quality assessment
The landscape visual quality was assessed by the direct method. This method consists of field trips to photography taking which represent substitutes for the landscape [22]. This study was based on the methodologies proposed by literature [6, 23, 24].
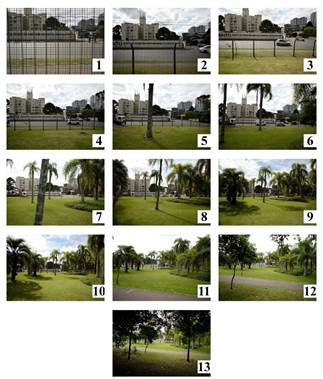
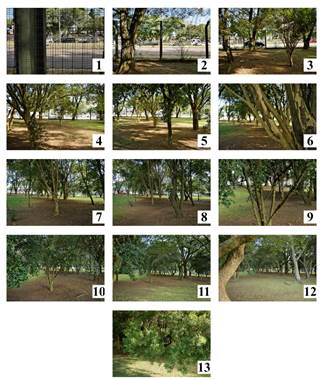
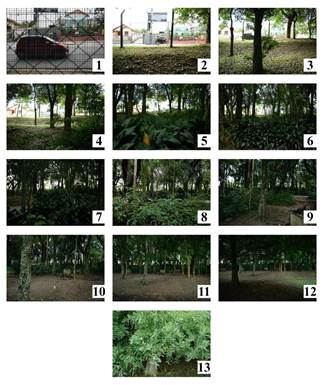
Photographs were taken at each monitoring point (A, B, C) at the following distances 0, 5, 10, 15, 20, 25, 30, 35, 40, 45, 50, 55, and 60 m from the source of the noise (avenue), in the center of the transect in the direction of noise propagation, totaling 39 photographs (Figs. 4, 5 and 6).
Source: The authors.
Figure 4 Landscapes assessed at Site A (Botanical Garden with low vegetation intensity): 1: Photo with squares for evaluation at 0 m distance; 2 - 13: Remaining transect at distances 5 to 60 m.
Source: The authors.
Figure 5 Landscapes assessed at Site B (Botanical Garden with medium intensity of vegetation): 1: Photo with squares for evaluation at distance 0 m; 2 - 13: Remaining transect at distances 5 to 60 m.
Source: The authors.
Figure 6 Landscapes assessed at Site C (São Lourenço Park with high vegetation intensity): 1: Photo with grid for evaluation at distance 0 m; 2 - 13: Remaining transect in distances 5 to 60 m.
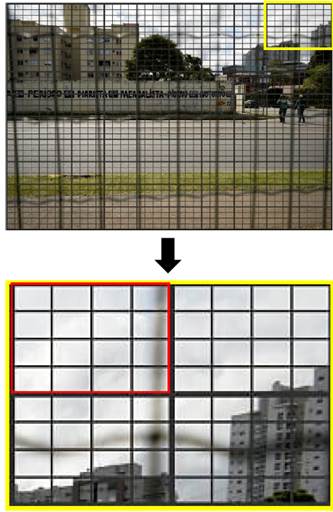
The photographs were taken between January 2 and March 19, 2017. The photographs in digital format were sized 9 x 13 cm, as recommended by Bobrowski et al. (2010), and grids with dimensions of 9 x 13 mm were allocated in each one, totaling 100 grids. In addition, 16 sub-grids were delimited within each grid, aiming to quantify the elements of the landscape in greater detail [6], totaling 1600 sub-grids per photograph (Fig.7).
Source: The authors.
Figure 7 A: photograph at point 0 m at Site A, with 100 grids and 16 sub-grids each; B: clipping of the photograph with emphasis on the red grid and its 16 subdivisions.
Each photograph was evaluated according to the percentage of natural and anthropic elements of the landscape in each grid. Each element received a weight (Table 1) related to the levels of anthropic presence. The less anthropized elements received higher weights, and those which showed a higher degree of anthropization received lower weights [6,20,24].
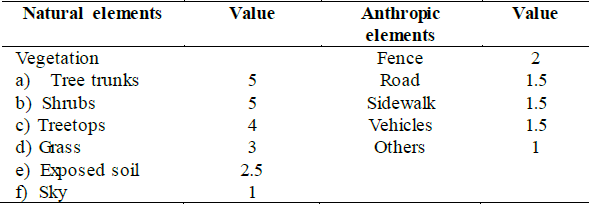
The sky, the elements of vegetation (treetops, tree trunks, shrubs, and grass), and the exposed soil were considered among the natural components. Thus, greater weight was attributed to the vegetation elements, as they represent an environment with a lower degree of anthropic interventions, while the sky, which represents a lack of vegetation, and the exposed soil received a lower weight for presenting a higher anthropization level. The anthropogenic elements of fences, roads, sidewalks, and vehicles obtained less weight because they represent disturbances in the surroundings of green areas related to urbanization and noise pollution. The class “others” refers to any other infrequent anthropic element in the photographs. The following equation based on Silva et al. (2012) was used to calculate the relative area represented by the elements of the landscape within the grid (eq. 1).
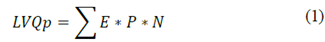
Where:
LVQp = Individual Photo landscape visual quality;
E = landscape element value;
P = proportion of the grid occupied by landscape element;
N = number of different elements in the grid.
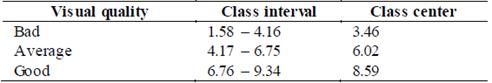
Next, three classes were established after calculating the landscape quality value: Bad, Average, and Good, based on the interval between the highest and lowest values, as recommended by Silva et al. (2012).
2.2.3 Noise pollution x visual quality
The differences between the sound pressure level (dBeq) at the distance of 0 m with the other distances tested in each transect were calculated to assess the influence of the locations on noise pollution blockage.
An analysis of variance (ANOVA) was performed to evaluate the variation of the results for each tested distance, and then the significance of the noise reduction was calculated by the SNK average comparison test (Student-Newman-Keuls) at the level of 5% probability.
All data were tabulated in the Excel 2016 software. A comparison was made between the visual quality and the noise pollution of the landscape of the averages obtained at each sampling distance, based on the average LVQ calculation for each photograph of the direct method.
The Statgraphics version 16.2 software program was used to evaluate the correlation between the methods of visual and sound assessments, where the average LVQ value of each tested distance together with the final average of the noise blockage were compared. An intensity classification was used for the correlation analysis, which defines the correlation intensity classes as: null (0.00 - 0.03), weak (0.03 - 0.35), medium (0.35 - 0.65), strong (0.65 - 0.95), very strong (0.95 - 0.99) and perfect (1.00) [25].
3. Results and discussion
3.1 Visual quality
Photographs were classified according to the landscape visual quality as Bad for values between 1.58 and 4.16; Average between 4.17 and 6.75; and Good between 6.76 and 9.34 (Table 2).
Location A (low vegetation density) showed a variation in the landscape visual quality value from 3.02 to 9.34. Photographs 1 to 5 obtained the LVQ classified as Bad (38.46%), Photographs 6 to 8 and 10 to 12 were classified as Average quality (46.15%), and Photographs 9 and 13 with Good quality (15.38%) (Fig.3). The low quantity of photographs classified as Good occurred because the site has low vegetation density in the Botanical Garden, however, the vegetation has a high landscape quality. Furthermore, in addition to the high vegetation value, another important feature for this location to have a low average LVQ value is the diversity of elements in the photographs and the absence of vegetation, which facilitated visualizing anthropic elements in the external areas of the park.
The variation in the landscape quality value at location B was between 2.31 and 8.79. Photographs 1 and 13 resulted in an LVQ in the Bad class (15.38%), Photographs 2 and 10 were classified as Average quality (15.38%), and the rest of the photographs were classified as Good quality (69.23%) (Fig.4). Most of the photographs classified as Good occurred because the site represents an area with medium intensity of vegetation in the Botanical Garden, in addition to the vegetation having a high value for landscape quality, and the diversity of natural elements in the place also changed the result of the landscape assessment in this monitoring point.
The landscape quality value at location C was between 1.58 and 9.31. Photographs 1 and 2 obtained the LVQ classified as Bad (15.38%), Photographs 3, 11, 12, and 13 were classified as Average quality (30.77%), and Photographs 4 to 10 were classified as Good quality (53.85%) (Fig.5). The main factor in evaluating the photographs that fit the Average class was the lack of diversity of natural elements, a high presence of treetops and trunks, and exposed soil.
Considering all of the study areas, a total of 9 (23.07%) photographs were classified in the Bad class, 12 (30.76%) in the Average class, and 18 (46.15%) in the Good class. Site A had an overall mean LVQ of 4.98, considered average, site B 6.84 and site C 6.89, thus considered as sites with good landscape. According to Silva et al. (2012), places with higher visual quality can facilitate tourist planning by highlighting the attractions of the green area.
The photographs considered bad were closer to the limit of the green areas with anthropic elements, constituting sources of visual and acoustic pollution. The photographs classified as Average obtained this classification due to presenting low diversity of elements or presenting anthropized elements. Lastly, the photographs with Good landscape quality presented a greater diversity of elements and the absence of anthropic elements.
The visual quality of the landscape of urban green areas is a factor of great importance for orienting the most aesthetically attractive points and consequently the most visited. Results of the study by the perception of tourists in a park in Hong Kong, China, indicated that certain points of the park were perceived as very artificial and gave the impression of being neglected by the green area management, in addition to being unsafe, especially those with little or no vegetation [26]. Thus, in places where more anthropic elements were found, management and adequacy of places are suggested to obtain better results and provide better well-being and comfort for its visitors.
3.2 Noise pollution
The maximum value of noise pollution, represented by equivalent decibels, was found at the maximum value of distance 0 (location B - 101.4 dB (A)) at the Botanical Garden, while the lowest value of 47.5 dB (A) was recorded at a distance of 25 m in location C (São Lourenço Park). It was also possible to determine the average equivalent decibels (dBeq) blocked at each location and the tested distance (Table 3).
Table 3 Average, maximum, minimum and equivalent decibel (dBeq) values blocked at each monitoring site.
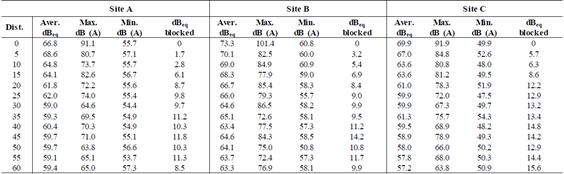
Source: The authors.
The lowest decibel values were found at distances of 5, 10, and 15 m, whereas distances of 40, 45, 55, and 60 m showed the greatest attenuation of noise, at location C. This result is explained by the three elements that control environmental noise: the noise source, the propagation path, and the receiver [8], which in this case corresponds to vegetation. In this sense, noise propagation depends on the power of the vehicle and on the characteristics and interactions of the noise in the system which is irradiated [2].
Trees and other vegetation types in conjunction with landforms reduce road noise by 6-15 decibels, while trees in combination with solid barriers reduce noise by 5-8 decibels; in comparison, a masonry wall, a typical sound barrier, reduces noise levels by 15 decibels [27], but imposes high costs [28].
This attenuation of noise pollution in the distances furthest from the noise source contributes to the feeling of well-being of people going to green areas. The soundscape in an urban park with little noise pollution is perceived as more pleasant, more relaxing, less irritating, and less stressful than that next to a busy street [29]. Xing and Brimblecombe (2020) state that the central areas of the parks normally present lower noise levels derived from traffic, and it is necessary to implement barriers at the edges of the parks so that the noise does not impair their visitation.
In Curitiba, Municipal Law No. 10,625 establishes a maximum value of 55 dBeq for green areas during the day [30]. Thus, all locations, despite suffering attenuation of noise pollution by vegetation, are still considered acoustically polluted, especially in locations A and B.
3.3 Visual quality X noise pollution
Correlation analysis between landscape visual quality and the amount of blocked noise showed a strong correlation coefficient (Table 4) for points A (0.65) and C (0.70), and average correlation for point B (0.38). Correlation considering the three monitoring points A, B, and C together was considered average (0.60). This means that increasing the landscape visual quality improves noise pollution attenuation.
Table 4 Average values of blocked dBeq, LVQ value and LVQ class at locations A, B and C.
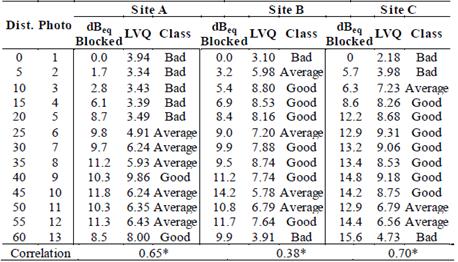
Note: * p < 0.0001.
Source: The authors.
The soundscape of a city is an important environmental reference for the quality of life in the urban environment [2]. Perception research has demonstrated the positive relationship between visual and sound landscapes. In comparing the population’s perception of the visual and sound aspects of five parks in China, Liu et al. (2013) found that the satisfaction levels with the sound and visual landscapes indicated relative importance in obtaining the satisfactory experience of the visit, with the visual aspect being the most important factor. However, the authors reiterate that the visual aspects are usually highlighted in the parks’ design, while the sound aspects are neglected. The soundscape is an expressive factor in people’s well-being, as it affects the preference for certain landscapes, and the effect of a type of sound in this preference depends on the visual elements of the studied landscape [31].
Also, the positive influence of the presence of natural elements on people in places exposed to noise is well-known, both on the stress caused by noise, as well as on that caused by visual pollution and even thermal comfort [5,9,32]. Thus, considering the sound-visual aspects of urban parks should be a factor addressed in their planning and management as a way to maximize their benefits to the population.
However, just planting trees around the limits of green areas is not enough and promoting aesthetic and ecological harmony is necessary, mainly prioritizing native species in natural areas in order to promote the biodiversity and conservation of these environments. Carles et al. (1999) affirm that the soundscape is promoted by the diversity of elements, especially the natural elements in urban green areas, but often this soundscape is left out and only the visual aspects of these areas is considered. The relationship between the visual and the soundscape varies depending on the morphological aspects and patterns of vegetation, green and human infrastructure, and the distribution of sources of noise propagation [33].
The soundscape can be compromised in cases where the landscaping does not consider noise pollution. The presence of vegetation at site A helped to reduce noise; however, sites B and C, which had more vegetation, obtained better results in blocking noise. Carles et al. (1999) state that there is an incompatibility in human perception when the interaction between sound and visual elements is inadequate. Thus, the benefits provided by the green areas are not enjoyed by people as they should.
Although this study did not address all the elements that compose the soundscape of the urban parks, the dBeq assessment is an indication of how harmful the noise pollution from vehicle traffic can be to the well-being of its visitors. Moreover, the premise that higher vegetation densities play a fundamental role in mitigating sound noise has been confirmed, in addition to promoting greater visual quality Therefore, there must be greater concern from the managers of urban green areas concerning the landscape measures that limit both sound and visual pollution external to these places.
4. Conclusions
Most of the photographs were classified as visually good, with location C being a point with high intensity of vegetation, which presented higher noise blockage on average.
The results showed that the photographs with the highest visual quality value provided greater acoustic blockage, mainly due to the presence and diversity of natural elements which have a greater weight in the landscape assessment.
Better visual landscapes resulted in greater amounts of attenuated noise, mainly due to the presence of natural elements.
We recommend planting native shrub and tree species at the green areas surroundings to constitute both visual and sound barriers of external anthropic elements and also to contribute to the local biodiversity.

