


 Inglés (pdf)
 Articulo en XML
 Referencias del artículo
 Enviar articulo por email
 Citado por SciELO
  Citado por Google
  Similares en
SciELO
Similares en
SciELO  Similares en Google
 Permalink
1. Introduction
Technological improvements in engineering projects are an aspiration of society, especially in metropolitan areas. Piles are one of the most important foundations in Brazil and root piles have had a great increase in their use over the last years [1-3]
Many different techniques to evaluate pile performance in the field have been developed, almost all meant for after pile execution, such as the popular static load test. Russo (2012) stated that the static load test to failure is by far the most reliable method to determine both bearing capacity and the load-settlement relationship of a pile [4].
Several researchers investigated the field performance of root piles [1-3,5,6] and other types of piles [7-13], with some important conclusions, such as that pile design has traditionally been based on collecting and analyzing data from load tests, revealing a scarcity of alternatives to support engineers when assessing pile performance during its installation.
This paper is a continuance of what was proposed by Monteiro et al. (2019) [3]. The improvements include the addition of a new variable (injection pressure) to those they considered and a different set of assessed piles, but also presents an innovative, non-destructive approach to estimate ultimate bearing capacity (Qult) and field performance of root piles by monitoring variables of interest: SPT N-values, pile geometry, drill bit's advancing velocity, drill bit's linear velocity, and injection pressure.
This was accomplished by installing a wireless sensor onto the rotating head of the drilling rig and applying the logged data to an empirical equation that is meant to be used during (or right after) the execution of the root pile, aiming at evaluating the installation procedure, that is, if the designed pile length was reached or not.
2. Root pile installation procedure
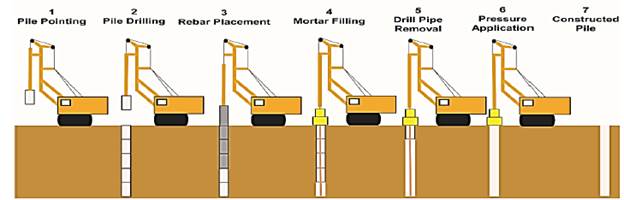
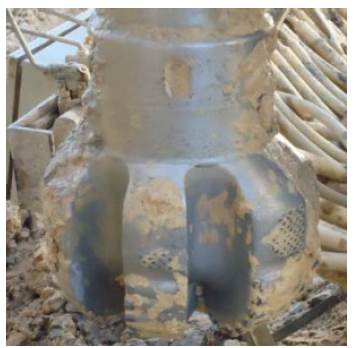
As shown in Fig. 1, the procedure to install root piles comprises: (1) pile pointing; (2) drilling; (3) placement of reinforcement bar; (4) mortar filling; (5) drill pipe removal; and (6) application of pressured air. This type of pile has a differentiated execution process, with some advantages over other executive processes, depending on local conditions and the soils properties where the pile will be installed. Fig. 2 shows a more detailed picture of the drill bit used in the boring phase.
3. Proposed methodology
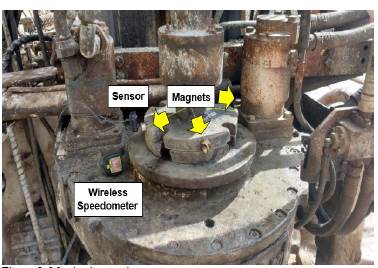
The proposed methodology is based on the use of a wireless sensor (tthe data acquisition device, which had the embedded features "speedometer" and "oedometer") during pile installation to monitor the variables of interest. First, the monitoring equipment was installed on the rotating head of the drilling rig (Fig. 3). Then, the diameter of the rotary drill was manually informed to the sensor, so that its "oedometer" function could keep track of each complete lap performed by the rotary drill (the piece that has the magnets on it). This procedure allowed the linear distance traveled by the rotary drill to be recorded by the sensor for the desired period of time.
In this study, the drilling rod used to bore the pile's last 1 m was subdivided in sections of 10 and 20 cm, as shown in Fig. 4. This was done to track the rotary drill's advancing velocity (Va) and linear velocity (Vb) during the boring of this final segment, as explained below.
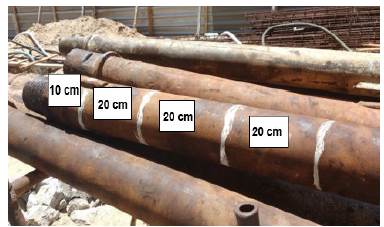
The advancing velocity (Va) and linear velocity (Vb) of the rotary drill were determined by monitoring the time necessary to drill the length between 2 marked sections. The linear distance between 2 marked sections was divided by the circumferential length of the rotary drill, thus obtaining the number of rotations that it performed during the boring of the specified section. The number of rotations performed per minute (the frequency f of the rotary drill) was calculated considering the time elapsed during the drilling of each segment and the number of rotations performed. The rotary drill's angular velocity (ωr) was then obtained (eq. 1):
Since the rotary drill is attached to the drill bit at the bottom of the hole, it can be inferred that the drill bit's angular velocity (ωb) equals the rotary drill's angular velocity (ωr). Hence (eq. 2):
The relation between angular and linear velocities involves the radius Rb. In this case, the drill bit's linear velocity (Vb) will correspond to the drill bit's angular velocity times its radius (Rb), as shown in eq. (3):
In this research, the development of the empirical equation for the executive control of root piles was initiated by selecting variables that would be easily obtained in the field, since the goal was to propose an analytical method to correlate them with pile bearing capacity that would be simple and easy to implement on site.
Therefore, the drill bit's linear velocity (Vb, associated with shaft resistance Qs) and the drill bit's advancing velocity (Va, associated with toe resistance Qtoe) were considered in the development of the empirical equation, along with: Toe resistance index (NSPT,toe), Average shaft resistance index (NspT,shaft), Pile diameter (D), Pile length (L), Pile perimeter (U), and Toe cross sectional area (Ap). The NSPT,shaft corresponds to the average SPT N-values along final section of the pile (that is, last meter) and the NSPT,toe, to the average SPT N-values along pile shaft.
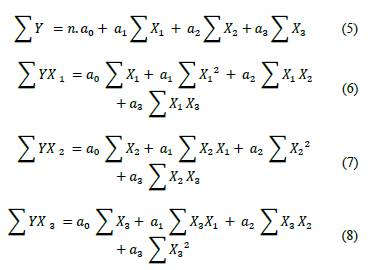
In this research, a multiple linear regression analysis was used to determine the relation between a dependent variable Y (in this case, Qtoe or Qs) and several independent variables (X1, X2, ... , Xn), as illustrated by the generic expression (eq 4):
In eq. 4, a1, a2, ... , an are the regression coefficients. The constant a0 represents the portion of the dependent variable Y that was not explained by the independent variables. The desired expression was obtained using the least squares method, which is based on the smallest deviation between the variable's observed (real) values and the estimated ones (obtained with the empirical equations). In the process, eq. (5)-(8) must be solved considering a multiple linear function of three variables. In this system, coefficients a0, a1, a2, and a3 are determined using the current Y, X1, X2, and X3 data.
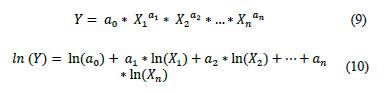
Considering that in bearing capacity estimation methods the relationships between the variables are not linear, an exponential model with log-transformation of variables was used, as exemplified in eq. (9, 10).
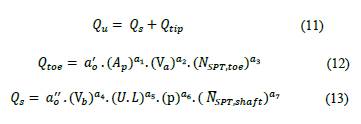
Considering the new variables ln(Xi) and solving eq. (5)-(8), the log-transformation of variables can be used and the multiple linear regression model can be implemented. Therefore, the values for the coefficients ai can be also obtained. In the end, the expressions to estimate Qult based on the field variables that were chosen are eq. (11) - (13).
4. Soil profile and site description
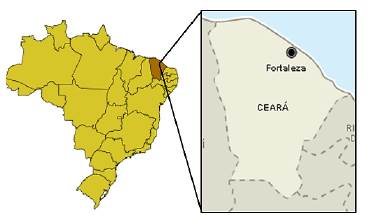
In this study, 8 real-scale root piles (lengths between 7.7 m and 18 m) were installed in five different experimental sites located in the city of Fortaleza, State of Ceará, Northeastern Brazil (Fig. 5).
Prior to installation of the root piles, Standard penetration tests (SPTs) and rock core borings were conducted at all five construction sites.
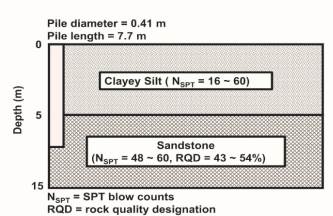
Site A, where test piles P1 and P2 were installed, the groundwater level was found at -3 m. A layer of clayey silt was found between ground surface and a depth of 5 m, with SPT N-values varying from 16 to 60. Below, there was a 10-m-thick layer of sandstone with RQD (Rock Quality Designation index) ranging from 43% to 54%, with SPT N-values ranging from 48 to 60.
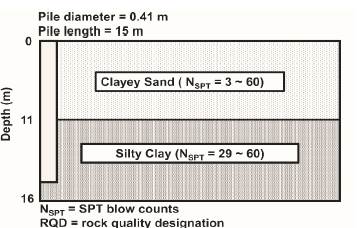
Site B, where test piles P3 and P4 were installed, a clayey sand layer was found between ground surface and a depth of 11 m, with SPT N-values varying between 3 and 60. Then, a 5-m-thick layer of silty clay soil, with SPT N-values ranging from 29 to 60, was found. The bedrock was located at -16 m and groundwater level at -1.2 m.
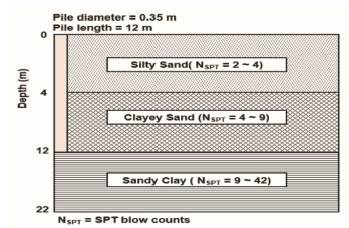
Site C (test pile P5) had its groundwater level located between -6.7 m to -7.4 m. A silty sand layer was found between ground surface and -4 m, with SPT N-values varying between 2 and 4. A 8-m-thick clayey sand layer was found below this silty sand, with SPT N-values between 4 and 9. Finally, a layer of sandy clay with SPT N-values from 9 to 42 was located, between -12m and -22 m.
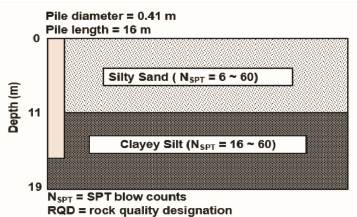
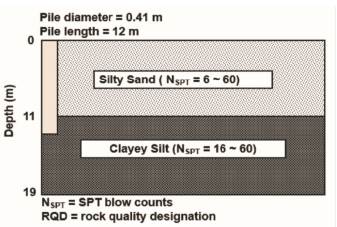
Site D (test piles P6 and P7) had a 11-m-thick top layer of silty sand, with SPT N-values between 6 and 60. Below, an 8-m-thick layer of clayey silt with SPT N-values from 7 to 59 was encountered. Water was found between -3.85 m and -4 m.
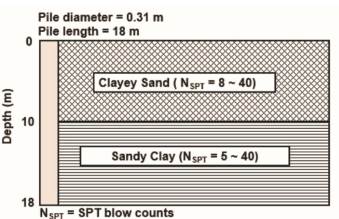
Site E (test pile P8) had a clayey sand upper layer, identified from ground surface to -10 m, with SPT N-values from 8 to 40. A sandy clay layer with SPT N-values of 5 to 40 was also found to a depth of 18 m.
Fig. 5 - 10 display the geometry of test piles P1 to P8 and the soil profiles for all 5 monitored sites.
5. Pile Load Tests Results
The 8 test piles were subjected to static load tests 10 days after installation and had their head vertical settlement measured by four dial gauges (two on either side of the pile) mounted on two reference beams. The load was applied in increments of 20% of the final test load and sustained until the settlement rate considering two consecutive readings was lower than 5%.
The piles were unloaded in five stages, after achieving the maximum load, except for pile P5, unloaded in four stages. The geometric configuration of the test piles, maximum load applied, injection pressure, and maximum displacement reported are summarized in Table 1.
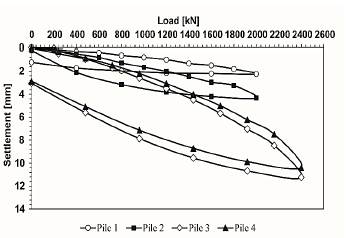
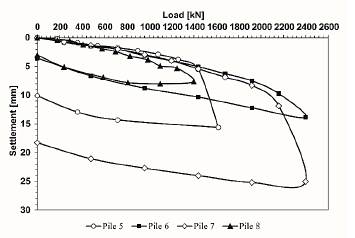
The curves "applied load versus settlement" from the static load tests for test piles P1 to P4 are shown in Fig. 11. Fig. 12 shows the results for P5 to P8. Looking at the curves, one can see that the tests on piles 5, 6 and 8 completely mobilized the shaft friction, for there is a sudden increase of the settlement around the maximum load applied. The other piles (diameter D = 0.41 m, but different lengths) were far from failure and showed similar behavior, where resistance was primarily controlled by the friction along the shaft.
Table 1 Results of performed load tests.
| Site | Test pile | L (m) | d (m) | Max. Applied Load (kN) | Settleme nt (mm) | Injection pressure (kPa) |
|---|---|---|---|---|---|---|
| A | P1 | 7.7 | 0.41 | 2,000 | 2.24 | 400 |
| P2 | 7.7 | 0.41 | 2,000 | 4.32 | 400 | |
| B | P3 | 15 | 0.41 | 2,400 | 11.24 | 300 |
| P4 | 15 | 0.41 | 2,400 | 10.38 | 300 | |
| C | P5 | 12 | 0.35 | 1,620 | 15.61 | 300 |
| D | P6 | 16 | 0.41 | 2,400 | 13.85 | 300 |
| P7 | 12 | 0.41 | 2,400 | 25.04 | 300 | |
| E | P8 | 8 | 0.31 | 1,400 | 7.60 | 300 |
Source: Authors 2021.
During the static load tests, for most of the piles, the distinct plunging ultimate load (Qu) reported by Fellenius [14] was not obtained. Therefore, Van der Veen's extrapolation [15] was applied to obtain the ultimate load for the test piles. The obtained values are displayed in Table 2.
6. Monitoring results
The monitoring process was carried out during the installation of test piles. While drilling the marked section of the drill rod (last 1 m), the data acquisition device (wireless sensor) registered the drill bit's linear velocity (Vb) and drill bit's advancing velocity (Va). The monitoring data are displayed in Table 3.
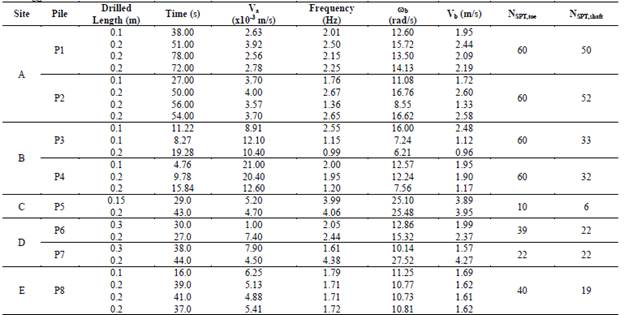
It should be mentioned that, for test piles P3, P4, P5, P6, and P7, due to unexpected events, adjustments in the lengths of the marked sections were needed (see "Drilled length" in Table 3). Also, in bores where certain soil layers had high SPT N-values and the boring process moved forward without any important obstructions, the N-values were limited to 60.
For test piles P1 and P2 (Site A), higher excavation times were observed (lower advancing velocities) due to a bottom rock layer. P5 (Site C) and P8 (Site E) showed a fair compliance in terms of advancing velocity. P5 (Site C) and P7 (Site D) were embedded in soils with similar stratigraphy (alternating clayey silt, silty sand, clayey sand, and sandy clay), and had a difference of 7.4% in their advancing velocities, a little smaller for P7 because toe resistance index was higher than that for P5. A correlation was then observed between those two variables: the higher the penetration resistance index, the lower the advancing velocity (an inversely proportional ratio).
Besides, during the installation of P5 and P7, high frequency values were observed. This was anticipated due to the direct relationship between frequency f (rotations per minute) and the drill bit's linear velocity (Vb). Therefore, the smaller the SPT N-values for the analyzed soil, the higher the drill bit's linear velocity, and the higher the frequency. Based on that, pile load capacity can be considered as inversely proportional to drill bit's linear velocity (Vb) and to the frequency f.
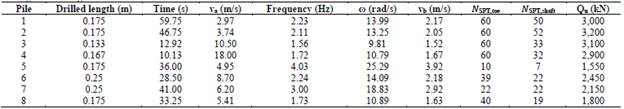
Table 4 displays the average values of the monitored variables and the ultimate load for each test pile.
7. Equation Proposal and Validation
A multiple linear regression analysis was employed to develop the empirical equation to estimate pile ultimate bearing capacity. Piles P1, P2, P3, P5, and P7 were randomly selected to develop the equation (calibration step) and piles P4, P6, and P8 were chosen for the validation step.
In order to correlate the monitored variables and pile ultimate load (Qu), it was necessary to estimate the load distribution along pile shaft and toe [3]. The Brazilian standard NBR 6122 [17] recommends that, for bored piles, shaft resistance should carry 80% of total load and toe bearing should be responsible for the other 20%. Hence, the proposed empirical equation for this standard scenario is (eq. 14).

where A p is Toe cross sectional area; V α is Drill bit's advancing velocity; NSPT,toe is Toe resistance index; V b is drill bit's linear velocity; U is pile perimeter; L is pile length; p is air injection pressure; and NSPT,shaft is average Shaft resistance index.
In the proposed equation, it can be easily seen that the variables that are directly proportional to pile load capacity appear in the numerator (and vice versa). Thus, the higher the pile perimeter (U), pile length (L), and average shaft resistance index (NSPT,shaft), the higher the overall pile resistance (Qu) will be. On the other hand, the greater the drill bit's advancing (Va) and linear (Vb) velocities, the lower the pile resistance.
The outputs of the proposed equation were compared with results obtained from load tests performed on the piles in the validation dataset (P4, P6, and P8). Table 5 shows the comparison between predicted values and those obtained from load tests.

Considering the analyzed scenario, the percentage error between estimated and reference values (that is, the ultimate loads obtained from the load tests) was somewhere between 0.2% and 65.1%. An absolute error of 17.1% was also verified for Pile P4 and of 16.7% for Pile P6. For Pile P8, a very unusual pattern was observed, as the estimated value was 65.1% higher than the reference value. For most piles in the validation dataset, the estimated values were a little lower than the reference values, which places the equation results on a safer zone.
It is worth highlighting that this research considered SPT N-values among its variables, but if the field situation involves fine soils, SPT N-values should be taken under careful consideration due to the great disturbance that it causes to the soil structure while it is being carried out. Eurocode 7 [1].
[6] stated that the use of SPT should be limited to a qualitative soil assessment, for there is no general consensus regarding its use in clayey soils.
The bearing capacity values obtained with the proposed equation were in fair consonance with reference values. Hence, it can be concluded that there is a correlation between pile bearing capacity and the assessed variables, and that the proposed method represents a simplified procedure for the executive control of root piles, aiding in decision-making process as to pile length during their execution in the field.
8. Conclusions
A simplified methodology for the executive control of root piles has been introduced in this study, offering a valuable tool for assisting engineers in the decision-making process during field operation. The technique is based on monitoring variables that can be easily obtained in the field (drill bit's advancing and linear velocities), which are based on traditional and well-established concepts from Physics. A monitoring methodology for root piles was developed, where variables were correlated with ultimate load values that could be obtained from static load tests, without actually performing them.
The soil profiles assessed for the development of this research were primarily coarse. Therefore, the application of the proposed approach should be limited to soils with similar characteristics. Further research is recommended for fine soils, in order to contemplate a broader variety of soil types.
This non-destructive approach is easy to apply and offers effective estimation of pile ultimate bearing capacity and straightforward interpretation of the outputs. And although in compliance with real field conditions, it is currently limited to root piles with lengths of less than 20 m and maximum bearing capacity of 2,500 kN.
This technique can be used during (or right after) pile installation, being a technically possible and economically feasible alternative for the executive control of root piles in the absence of a static load test.

