


 Inglês (pdf)
 Artigo em XML
 Referências do artigo
 Enviar este artigo por email
 Citado por SciELO
  Citado por Google
  Similares em
SciELO
Similares em
SciELO  Similares em Google
 Permalink
1. Introduction
Mobile devices are becoming increasingly popular and powerful, due to advances in broadband wireless network technologies and the ability to run all kinds of applications and mobile content (messaging, entertainment, social networks, commerce, mobile banking, social and public services, leisure, multimedia, etc.). In addition, mobile applications and services are increasingly present in most aspects of daily life, satisfying information, communication, and entertainment needs. However, mobile applications and/or services are subject to multiple factors that affect not only their performance (quality of service; QoS), but also end-user satisfaction (quality of experience; QoE). Some of the factors widely recognized as causing performance issues are: unreliable physical channels with limited bandwidth, node mobility, routing, resource limitations (device CPU, screen size, limited battery, and input methods), evaluation metrics, different operating systems, physical and climatic conditions, user profiles, diversity of applications, etc. [1,2]. In particular, in the South American and Caribbean region, the Mobile Economy reports [3,4] recognize that the QoS and its perception by users (QoE) are a barrier to mobile digital access, with users caring more about these than price.
QoE is the general acceptability of an application or service as subjectively perceived by the end user, which can be influenced by the user's expectations and context [5]. The metrics that are used to measure QoE are classified as subjective and objective. The subjective metrics are related to the user's opinion and evaluate the quality of an application or service based on personal experience [6], depending on subjective factors such as the context and the user's expectations. In general, subjective metrics are calculated using information obtained from user surveys or questionnaires. These methods have the drawback of being expensive in terms of time and money [7,8]. Traditionally, mobile QoE has mainly been examined through laboratory experiments where the contextual factor is fixed, as in [9] and [10]. Several methods are used to quantify subjective metrics, including the experience sampling method (ESM) [11], online surveys, the day reconstruction method (DRM) [12], and the mean opinion score (MOS) [6,13].
Objective metrics, which are systematic, exact, and repeatable, refer to various properties such as the data presentation time, which measures the time elapsed between a user's action and the application response, the consumption of mobile data, energy consumption, the user interface, and the content presentation [6]. Some research has analyzed QoE in close relationship to QoS, as a degradation in QoS can cause an unacceptable QoE. Various QoS parameters, such as delay, jitter, loss rate, error rate, bandwidth, and signal success rate, are used to determine the QoE value based solely on the QoS calculation [14]. This is because QoS is based on a set of metrics related to network performance parameters that can impact QoE. The amount of data received from a service in response to the user, the time elapsed between sending and receiving data, and the loss of information, are some of the metrics that are associated with QoS [7]. A large number of objective metrics can be used to analyze QoE.These may require different collection, recording, and calculation methods, and they can be used for various purposes (estimation, monitoring, prediction, or optimization). Different tools exist for the automatic objective measurement of QoE [15].
With the central objective of analyzing mobile QoE and investigating the relationship between objective and subjective properties and identifying possible QoS and/or contextual conditions that influence QoE, we conducted a descriptive, exploratory, and unsupervised field study. This study allowed us to collect 41,144 objective and subjective metric values for 31 days, through the interaction of 95 participating users with the CovidInfo (Android) mobile application. We specifically developed and linked a library of metrics to Covidlnfo that collects and calculates properties such as bandwidth, latency, user perception of latency, type of connection, packet loss, jitter, user opinion, and more. Users from Argentina and Cuba interacted with Covidlnfo in uncontrolled everyday contexts, based on their own needs and motivations, thus generating a set of real data. The choice of focusing on users from Argentina and Cuba was intentional, because we began with an a priori assumption that the differences in technological infrastructures between these two countries would be reflected in differences in the observations. In this article we present the results and discuss the possible factors determining them.
2. Materials and methods
For the field study, users anonymously downloaded an application and used it voluntarily according to their own needs and motivations. The application is CovidInfo, which which we specifically developed for our studies. A metrics library that we also developed for our studies was integrated with CovidInfo. The data were collected and calculated on each user's mobile device each time the application was executed, and they were then sent to a database server, from which they were downloaded and processed. In what follows, we briefly present CovidInfo, details about the implementation of the metrics, and the thresholds used for their interpretation.
2.1 The CovidInfo application
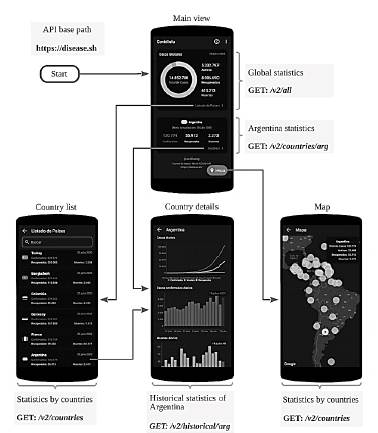
CovidInfo is a mobile application for Android that presents updated information, both quantitatively and graphically, on the evolution of the COVID-19 pandemic at the global level as well as specifically for each country. The application obtains this information from the Novel COVID API (https://disease.sh), which in turn collects data from Johns Hopkins University, the New York Times, Worldometer, and Apple reports. To develop the application, we used different libraries to implement some of the necessary functions and display the information for the user in an attractive way. One of these libraries is Retrofit [16], a secure HTTP client for Android that is used to query the API. Another one of the main libraries we used is MPAndroidChart [17], which offers a wide variety of customizable graphics such as those shown in the application.
Fig. 1 presents the navigation flow from the application interface and the queries and routes that are sent to the API to obtain the data that ate presented to the user through text, graphics, and a map.
2.2 The metrics library
The library implements the following metrics:
Latency: Measures the time a packet takes from the moment it is sent until the response is received. Latency is expressed in milliseconds (ms).
Jitter: Measures the variation in the arrival time of packets, caused by network congestion, loss of synchronization, or the different routes that packets follow to reach the destination. Jitter is expressed in milliseconds (ms).
Packet loss: Measures the number of packets that do not reach their destination. Packet loss is expressed as a percentage (%) representing the number of packets that are lost over the total number of packets that are transmitted through the computer network.
Packet loss: Measures the number of packets that do not reach their destination. Packet loss is expressed as a percentage (%) representing the number of packets that are lost over the total number of packets that are transmitted through the computer network.
We used the ping command to obtain the values of the preceding three metrics (latency, jitter, and packet loss). This command sends a signal, generally known as an Internet Control Message Protocol (ICMP) echo request packet, to a destination IP address and waits for an ICMP Echo Reply [18]. Specifically, the metric library uses the command "ping -c 5 disease.sh". The option "-c 5" defines the number of packets to send, and the option "disease.sh" specifies the server (https://disease.sh) to which the packets are sent. The ping command then returns the statistics corresponding to the percentage of packets that are lost, the average latency, and the jitter of the packets that are sent.
Bandwidth: Measures the available capacity of a network link, or the amount of information that can be sent through a physical or wireless link. Bandwidth is expressed in kilobits per second (kbps). We used the Android class "ConnectivityManager" [19], which provides information about the status of network connectivity by requesting the download bandwidth of an active link on the user's device.
Network type: Indicates the type of connection used by a mobile device, which can be WiFi or some type of mobile data network, such as 2G, 3G, or 4G. We used the Android class "ConnectivityManager" to identify whether the device was using a WiFi network or a mobile data network, and we used the Android class "TelephonyManager" [20], which provides access to information about the telephone services on a device, to determine the specific type of mobile data network (2G, 3G, or 4G).
Memory consumption: Measures the amount of memory used by the application to store internal data and application instructions when it is running. Memory consumption is expressed in kilobytes (kB). We used the Android class "ActivityManager.MemoryInfo" [21], which provides general information about the memory of the device and the applications that are running, to determine the amount of memory consumed by the application.
CPU consumption: Measures the processor capacity that is used by an application on a mobile device, which can vary depending on the types of tasks the application performs. CPU consumption is expressed as the percentage (%) of the device's total CPU capacity that is used by the application. We used the system log files associated with the use of the CPU to determine the application's CPU consumption.
Latency perceived by the user: Measures the time the application takes from the moment the user initiates an action until the data is displayed in the interface. Latency perceived by the user is expressed in milliseconds (ms). To obtain this value, the library records the instant of time when an action is initiated by the user and the instant of time when the action ends, after the necessary processing (data loading, conversion, and more) is performed and the result is shown to the user.
User opinion: Measures the level of the user's general satisfaction with an application. It is a subjective metric for analysis of QoE. To obtain a value for this metric, we asked a question about the user's satisfaction with the application's performance. The user's response could be one of three possible qualitative categories: "Bad", "Regular", or "Good", corresponding to the performance as perceived by the user; see Fig. 2.

Other data collected: In addition to the previously described metrics, we also collected data associated with the user's mobile device (brand, model, and version of the operating system). To collect these data, we used the Android class "android.os.Build" [22], which supplies information about the properties of the device and the system.
2.3 Recording of metrics and server storage
The recording of metrics begins when the user starts the application and runs in the background without affecting user interactions. The metrics associated with network parameters (latency, jitter, packet loss, bandwidth. and type of connection) and the consumption of device resources (memory consumption and CPU consumption) are periodically recorded in 10-sec intervals.
The user's perceptions of latency are recorded when an action is executed that begins with a user event, then requires processing by the application, and ends with a change in the interface that shows the result to the user. This happens, for example, when the user accesses (from the main screen) a screen that presents a list of countries; in that instance, the application loads the data from the web API, processes it, and then displays the result on the screen in the form of a list with the statistics for each country.
The user's opinion is the only metric that requires the user's conscious participation, as it requires a direct response from the user regarding the performance of the application. The user is first asked to indicate her/his perception of the application's performance after the third time she/he interacts with the application, so that the user already has some knowledge about the application and its performance. After registering the user's opinion for the first time, this process is carried out periodically, with the number of times the application is executed between solicitations of the user's opinion increased to five. This configuration decision reflects the need to obtain different opinions from the user, which can change due to different contexts in which the device's connectivity, the network speed, and the consumption of resources, along with other factors, may vary.
Once the library obtains the metric values, they are automatically sent to database servers. This made it possible to centralize all of the recorded values for subsequent analysis. We used the Firebase Realtime Database [23] (Google) and Back4App [24] (Back4App Inc.) database servers to store the data in the cloud. Because Google services are not available for Cuba, it was necessary to use Back4App for this country.
2.4 Thresholds
Except for the user's opinion, the recorded metrics register quantitative values for each measurement. These values are expressed in different units of measurement (ms, kbps, kB, %), and they also have different meanings. To resolve this heterogeneity, we carried out a qualitative category conversion process. The thresholds for converting the values for each of the metrics to the three categories are shown in Table 1.
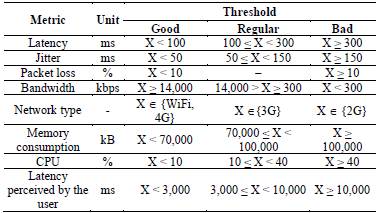
The categories for the user's opinion (Bad, Regular, Good) were used for this conversion in order to homogenize all of the values.
The definitions of the thresholds were first determined based on our personal experiences in the development of mobile applications and their use. Other important factors were the main characteristics of the mobile devices used by users, such as processing capacity, memory, and storage, among others.
3. Results
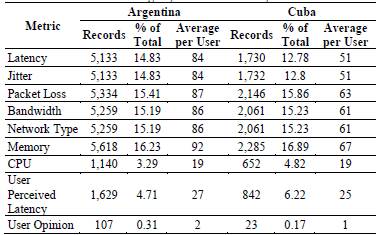
The CovidInfo application was downloaded and used by 95 end users, 61 from Argentina and 34 from Cuba, for 31 days (May 18, 2020 to June 18, 2020). In Argentina, the users were geographically located in eight different provinces (Buenos Aires, Chubut, Misiones, Cordoba, Mendoza, Entre Rios, the autonomous city of Buenos Aires, and Santa Cruz), while in Cuba they only come from La Havana. A total of 41,145 metric records were collected, 35,612 from Argentina and 13,532 from Cuba. The users from Argentina registered an average of 63 values per metric, while the users from Cuba registered an average of 44 values per metric. Table 2 presents details about the values obtained by metric and country, the percentage that they represent, and the average number of values per user.
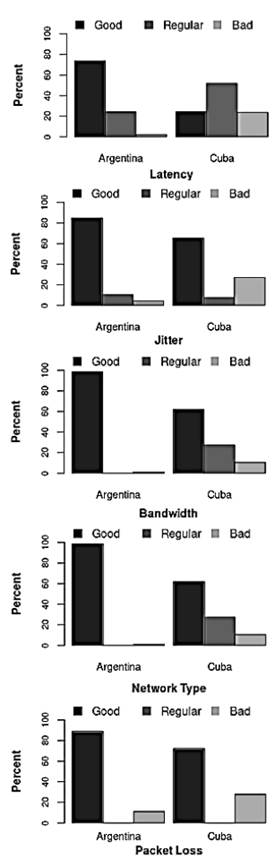
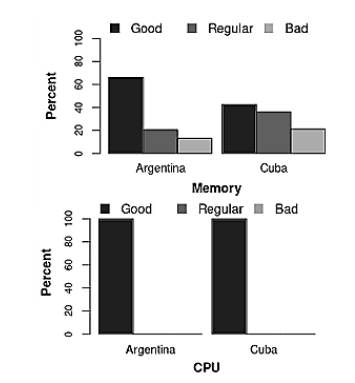
The graphs in Fig. 3 show the performance of the five metrics associated with QoS for each country based on the defined thresholds. For Argentina, the predominant registered values were 74% for latency, 85% for jitter, 89% for packet loss, 99% for bandwidth, and 99% for the network type, all of which were categorized as good. For Cuba, the results are less homogeneous, with 52% for the latency, which is categorized as regular, and good values predominating for the rest of the metrics, but to a lesser extent than for Argentina, with 65% for jitter, 72% for packet loss, 62% for bandwidth, and 62% for the network type.
The graphs in Fig. 4 show the performance of the metrics associated with the use of the devices for each country, according to the defined thresholds. In Argentina, memory consumption achieved better performance than in Cuba, but both countries achieved an equal and efficient performance for CPU resources.
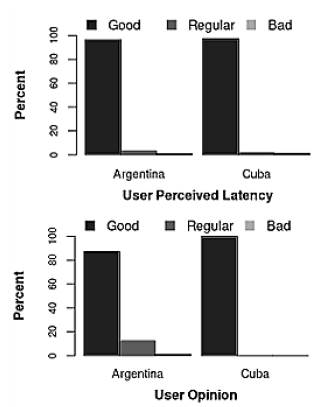
Regarding the metrics associated with the user experience, the two countries' results for the user's perceived latency and the user's opinion are comparable and optimal, as can be seen in Fig. 5.
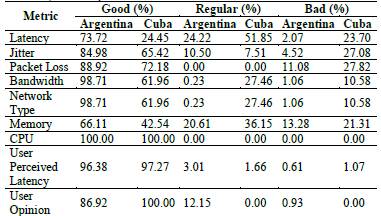
Finally, Table 3 summarizes the values obtained for the metrics in terms of percentages for the assigned qualitative categories, by country.
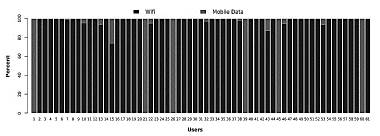
Figs. 6 and 7 present the type of connection used by each user in each country when the individual metrics were collected. For example, in both Argentina and Cuba, 100% of the metrics for user 1 were collected when they were connected to a WiFi network, and 100% of the metrics for user 9 were collected when they were connected to a mobile data network (4G, 3G, or 2G). The metrics for 10 users from Argentina and 2 from Cuba were collected using both types of connection. For Cuba, 38% of the mobile connections were 3G or 2G, while in Argentina the mobile connections did not reach 1.3%.
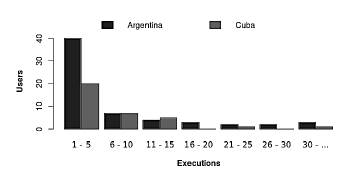
Figs. 8 and 9 represent the users' frequencies of executing the Covidlnfo application and the number of days they used it. In Fig. 8, it can be observed that in Argentina, 40 users (65%) executed the application between 1 and 5 times, while in Cuba, 20 users (59%) executed the application between 1 and 5 times.
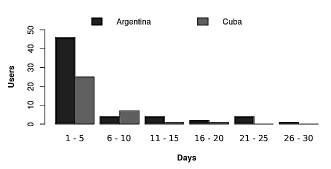
The observations are similar for the number of days they used the application. In Fig. 9, it can be observed that in Argentina, 46 users (75%) used the application between 1 and 5 days, while in Cuba, 25 users (73%) used the application between 1 and 5 days.
Fig. 10 presents in detail the number of daily metric records for Argentina and for Cuba, as well as the overall number of records accumulated by the combined countries, for a total of 48,145 metric records: 34,612 from Argentina and 13,532 from Cuba. The general daily average was 1,553, the average for Argentina was 1,117, and the average for Cuba was 436. In Argentina, May 26 had the largest number (3,465) of metric records collected, while June 17 had the smallest number (112) of records collected. In Cuba, May 24 had the largest number (1,343) of metric records collected, while June 17 had the smallest number (0) of records collected.
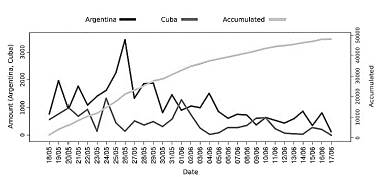
Source: Prepared by the authors.
Figure 10 Daily number of metric records for each of the two countries and accumulated records for the two countries combined.
Tables 4 and 5 present the percentages of the study participants' device brands and configurations, classified by country.
Table 4 Brand of mobile devices
| Brand | Argentina (%) | Cuba (%) |
|---|---|---|
| Samsung | 44 | 35 |
| Motorola | 26 | 15 |
| Xiaomi | 10 | 24 |
| HUAWEI | 3 | 15 |
| 3 | 0 | |
| TCL | 3 | 0 |
| LGE | 2 | 6 |
| Other | 8 | 6 |
Source: Prepared by the authors.
4. Discussion and related research
In this field study, we observed that the values of the objective metrics are generally good in both countries, since 88% of the total values registered in Argentina and 70% of those for Cuba were categorized as good. The greater number of records obtained from users in Argentina was due to a greater number of users but also these users' higher interaction with the application, although the use and execution of the application were in general low. For Argentina, over 96% of the latency perceived by users was categorized as good, and this corresponds to the metrics associated with the QoS also being categorized as good, all exceeding 73%, and also corresponds to the users' opinions. For Cuba, the latency perceived by users and the users' opinions were also good for most of the measurements (97% and 100%, respectively), although the values for QoS were lower, with latency being the most affected.
Although the results are generally good, there are differences between the metrics associated with QoS in the two countries, between 17% and 49%. In Cuba, the percentage of good values for these metrics is lower; however, this did not transfer to the metrics associated with the device and user. We judge that Argentina's good performance on all of the metrics is related to the type of network or connection used, which was mostly a WIFI network (> 93%) in Argentina and mobile data in Cuba (85%, only 61% of which were 4G), which to some extent affected the metrics associated with QoS.
Analyzing the social context in which the measurements took place, both countries were affected by the COVID-19 pandemic during the study period. In Argentina, the population complied with the quarantine or confinement ordered by the national government, known as ASPO (Social, Preventive and Compulsory Isolation), so we speculate that most of the measurements were taken in closed places with reduced mobility and in which a Wi-Fi network was available, such as homes. In Cuba, where the government policies aimed to maintain social distancing but with fewer restrictions, measurements could be recorded in open environments and with greater mobility, so the values were recorded through mobile data connections, although in Cuba, connection coverage through Wi-Fi is very low for individual users in the first place. The network type was the parameter that registered the greatest difference between the two countries.
Regarding the device configurations (brand and operating system), no significant differences were observed that indicate that these had an impact on the results that were obtained. In the two countries, the most used brands were practically the same, as were the versions of the operating system.
Another issue that we consider may have influenced the favorable results obtained for QoE, which in Cuba did not transfer to QoS, is the CovidInfo application itself. The application's simple design, its intuitive interface, and the fact that it does not require excessive memory or processing resources may be factors that positively affected the quality of the users' experience and the metrics associated with the device. However, more subjective information needs to be collected to confirm this assumption. The relationships and dependencies between usability [25] and the quality of the mobile experience [26] remain an open question and need to be further studied.
Various studies and field tests have been conducted to analyze mobile QoE. Establishing clear and convincing comparisons of results is a complex task, as there are substantive differences in terms of the number of participants, the observation periods, the design and methods applied in the studies (data collection, processing, analysis, etc.), the measured objects (video, audio, web services) and the evaluation objectives, among other aspects. However, most of these studies analyze and evaluate subjective mobile QoE based on metrics, questionnaires and/or surveys. A field study in Finland that aimed to analyze QoE data at the mobile application level is presented in [27], with 64,036 experience ratings collected from a total of 292 users for a period of 2 to 4 weeks during the summer of 2017. The participants installed a custom measurement app that monitored network quality and asked them to rate their experiences with other apps while or after using them. The study in [27] obtained realistic data, but it was focused on subjective analysis, unlike our study, which registers objective metrics.
The first unsupervised field study on the QoE of mobile adaptive video transmission on YouTube is reported in [28], and it shares some similarities with our work. The study in [28] used a specific application for monitoring (YoMoApp), which was downloaded by 196 users from five countries. The monitoring took place over two years, and more than 1,250 transmission sessions were obtained that recorded the parameters regarding the network layer, transmission parameters for the application layer, the device characteristics, and subjective classifications. The 674 sessions were then evaluated to gain insight into the streaming context and streaming behavior of mobile YouTube users. The data collection design was based on the session log, and various analyses and further processing were conducted. In a sense, the authors conclude, as we do, that it is necessary to broaden the subjective assessment of users. However, there is a radical difference between the two studies, as our approach to collecting the data is more precise.
Findings from a field study that analyzed the mobile QoE for tasks such as downloading files and web navigation are presented in [29], which focused on (3G) mobile broadband and connections and was carried out in Vienna (Austria) with 17 users participating for a period of three weeks. Surveys were used for data collection. The authors demonstrate that field results differ from laboratory results. They consider that there are several conditions that are difficult to control, estimate, process, and collect in the field. Regarding the results, the authors conclude that they are subject to the good Internet quality in Austria and therefore cannot be generalized.
A variety of studies have analyzed the QoE for mobile applications but, as mentioned above, most of these have been laboratory studies. In [9], mobile QoE was modeled for web navigation and file uploading and downloading. Data were collected from 108 users in controlled laboratory experiments, and the quality metrics included network performance and delay. In [10], mobile QoE was analyzed based on laboratory experiments that examined a variety of popular mobile applications (YouTube, Facebook, and Google Maps). As noted in [27], laboratory studies are less useful than field studies, as the mobile context is fixed and the users have been previously recruited and instructed in the use of the applications, which introduces an intervention in the study that can influence the results that are obtained.
5. Limitations
The data obtained during this study correspond to real experiences of real users who were not previously recruited or later interviewed. Users in the field study freely and voluntarily used the application at different times and on different days during the study period, which eliminates possible lab interventions or manipulations in the obtained results. However, we note several limitations of our work.
First, the study focused only on two Latin American countries (Argentina and Cuba). Although other countries in the region have mobile infrastructures with similar characteristics to each of these countries, contextual, social, and economic situations do not allow generalization of the results. In the case of Argentina, due to the COVID-19 pandemic, mobility and walkability in external environments were very reduced (i.e., it was not a normal situation) and the users had WIFI connections (in their homes), and these issues may have influenced the results. We believe that under normal urban mobility and walkability conditions, the results could be different. Therefore, the results cannot be generalized to other contexts or moments with significantly different mobility or mobile network characteristics than those found in Argentina. However, in Cuba, given that the possibility of a Wi-Fi connection remains very low for most of the population, we believe that the results would not be very different in the absence of a pandemic.
A second limitation of our study is its design for collecting user opinions. Broader opinions should be solicited, in order to establish more relationships.
Although the data collection was faithful to the reality of the experiences, there is a possibility of bias in the applied categorization (good-regular-bad) of the values for each metric. The thresholds presented in Section 2 were defined mainly based on specific technologies. We believe that the definition of thresholds should be updated based on the evolution of available devices and resources, as well as connection speeds, since these aspects of devices are constantly evolving in the context of mobile technologies.
6. Conclusion
In this paper, we presented an exploration of mobile QoE from an unsupervised field study in Argentina and Cuba. The study collected various metrics, including five associated with network parameters (latency, jitter, packet loss, bandwidth, and connection type), two on the consumption of device resources (memory consumption and CPU consumption), and two directly related to the user (latency perceived by the user and user opinion). We consider that the type of connection and mobility were the most influential factors determining the obtained results. Despite the limitations that we have pointed out, the experiences of the users were real and were not influenced by previous or subsequent actions. Our study was designed to capture what mobile application users usually do, autonomously downloading applications from a store and using them intuitively and freely. At present, there are few published reports of unsupervised field studies in relation to mobile QoE, with our study possibly being one of the first such reports from Latin American countries.
An interesting research topic would be to analyze how the results of these field studies relate to or reflect the digital gap in Latin American and Caribbean countries from a more social perspective.
Our future plans are aimed at improving future studies and reducing the limitations that we encountered. Our next approaches will be to (i) carry out field studies that cover more countries, (ii) use mobile applications for experiences that require more network and device resources (video and/or audio), and (iii) empirically adjust the thresholds defined for the metric values. Finally, beyond that, studying the relationships and dependencies between usability and mobile QoE holds interest for us.
CovidInfo is available for download from https://gispunpauarg.github.io/CovidInfoUNPA.

