


 English (pdf)
 Article in xml format
 Article references
 Send this article by e-mail
 Cited by SciELO
  Cited by Google
  Similars in
SciELO
Similars in
SciELO  Similars in Google
 Permalink
1. Introduction
This study presents methods to estimate of the monthly wáter production of the micro-basins of Quintana and Cantilote creeks, tributaries of the Paito river basin, Carabobo State, Venezuela. The study is based on an estimate through monthly water balance and prediction of direct runoff that occurred during 1980-1999 and 2015-2018. The monthly water balance is carried out on the land surface, including input-output components associated with precipitation, as the primary input variable, and the water losses represented by the infiltration and evaporation processes. Concerning infiltration, the influence of natural covers, uses and types of soil are taken into account, as well as evaporation.
The micro-basins of Quintana and Cantilote Creeks lack hydrometeorological information measured by direct methods within their extension, which has led to the application of spatial prediction methods supported by the use of data produced by remote satellite sensors through remote sensings, such as elevation models. Digital terrain created by the satellites ASTER (Advanced Spaceborne Thermal Emission and Reflection Radiometer), [1] and ALOS-PALSAR, being PALSAR one of the sensors corresponding to ALOS (Advanced Land Observing Satellite-1), [2], both in a cooperative effort between the governments of the United States of America and Japan. This technology is intended to contribute to mapping, accurate observation of regional land cover, disaster monitoring, and resource prospecting. Likewise, multispectral images of satellite technology are used to introduce the dynamics of changes in coverage and land uses in the study area [3], produced by the third generation of the series of LANDSAT satellites (Landsat 8OLI) placed in space by the government of the United States of America from 1972 to the present. Landsat 8 OLI data has rapidly become the primary source of information used by these satellites. The data offered improved spatial, spectral, radiometric, and geometric performance over data from sensors from the first and second generation of the Landsat satellite series [4]. Some experiences have validated the supervised classification of satellite images from the Landsat series to basins of Venezuela, including the Pao [4-5] and Urama rivers [6].
The water balance was carried out by adopting prediction methods for hydrometeorological variables concentrated in the area to spatial-temporal prediction methods to obtain autochthonous information for the micro-basins without information. A geostatistical model classified within the linear statistical models (probabilistic) known as Ordinary Kriging [7] was applied to predict the meteorological variables, precipitation, and evaporation. The experiences of using geostatistical models to predict the water balance have led to the establishment of mathematical functions that satisfactorily approximate the observations of the meteorological variables in the Pao and Urama river basins [8-10].
With respect to the estimation of surface runoff, it was carried out by adapting the method proposed by the United States Soil Conservation Service [11] and a method proposed by the Center of Hydrological and Environmental Research (CIHAM-UC, in Spanish) [12] in a space-time dimension to estimate the effective rainfall component within the mathematical expression of the water balance considered in this study.
The total flow was estimated by combining the direct runoff flow with the groundwater for the micro-basins of Quintana and Cantilote creeks. Base flow from groundwater storage seepage was quantified using the principle of Darcy's Law [10,13]. In the La Guacamaya aquifer, a groundwater flow of up to 1.58 m3/s was estimated in 90% of the aquifer area, with values of up to 9.73 m3/s for the rest of the aquifer area [13]. Likewise, the monthly water balance in the aquifer of the San Diego Municipality, Carabobo State, occupying an area of 117 km2, has been quantified in an average monthly sheet extracted varying between 77 and 110 mm/month (approximately 12.87 million m3/month) [10-14].
The study has the specific purpose of calibrating a geostatistical model, including deterministic and stochastic components, which describe the spatio-temporal variation of the water balance variables during 1980-2000 and 2015-2018. As well as, the adaptation of a deterministic model for the spatial prediction of monthly effective precipitation by entering variables in a raster format consisting of meteorological (monthly precipitation) and associated with land use, land cover and soil types (runoff coefficient). In both cases, the general purpose is the spatio-temporal prediction of the hydrometeorological variables in the micro-basins without records.
2. Materials and methods
The method involved processing in three MATLAB® computational tools, ArcGIS V-10.0, and ENVI V-4.7. By applying the tools contained in these computational packages. The following phases were developed:
2.1 Delimitation and properties of the micro-basins of the Quintana and Cantilote creeks
The delimitation and properties of the micro-basins of the Quintana and Cantilote creeks were carried out using a cartographic image at 1:25,000 scale produced by the Simón Bolívar Geographical Institute of Venezuela. A spatial reference procedure was applied in the work environment of ArcGIS V. 10.0 to locate the study area and compare the water network of the Quintana and Cantilote creeks with the network produced using digital elevation models from the ASTER satellites (Advanced Spaceborne Thermal Emission and Reflection Radiometer) and ALOS-PALSAR (Fig. 1).
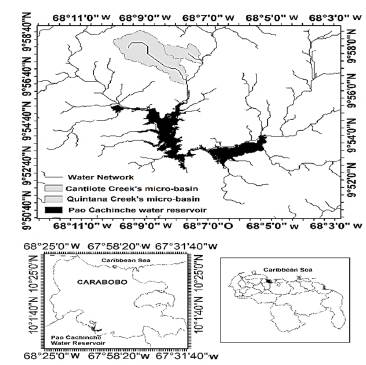
Source: Own elaboration
Figure 1 Location of Quintana and Cantilote creeks's micro-basins, Carabobo State, Venezuela.
The ASTER Digital Elevation Model was acquired from the U.S. Geological Survey (USGS). Four scenes were acquired to cover the Pao River basin. The files are identified as ASTGTM2N09W068 (for example this code indicates 09 degrees north latitude and 68 degrees west longitude), ASTGTM2N09W069, ASTGTM2N010W068, ASTGTM2N10W069. The general characteristics of each ASTER scene are: mosaic size (3601 x 3601 (1 x 1)), pixel size (1 arc-second, approximately 30 m at the equator), and referenced geographic coordinate system to reference the geoid of the 1984 World Geodetic System (WGS84) / 1996 Earth Gravitational Model (EGM96) [15].
The ALOS-PALSAR Digital Elevation Model (DEM) was acquired from the Alaska Satellite Facility website. Digital elevation models are created using interferometric Synthetic Aperture Radar (SAR) processing. According to [16], the L-band synthetic aperture radar (PALSAR; 1270 MHz / 23.5 cm) carried in ALOS is, in principle, capable of making observations with a large number of different combinations of polarization, off-nadir angles and spatial resolution. To ensure chronological and spatial uniformity, the following three modes have been selected: HH polarization, angle off nadir 34.3 degrees, resolution 10 m, polarization HH + HV, angle off nadir 34.3 degrees, 20 m resolution, HH polarization scan SAR, 100 m resolution.
PALSAR scene definition acquired in SAR scan mode is characterized by 12.5 m pixel spacing, 250 x 350 km image size (range x azimuth), east-west frame size (3500 pixels), south-north box (2500 pixels). Four scenes from ALOS-PALSAR were acquired to cover the Pao river basin, the files of which are identified as AP_02335_FBS_F0180, AP_02335_FBS_F0190, AP_02758_FBS_F0180, AP_02758_FBS_F0190.
In the ArcGIS V-10.0 environment, the scenes from the ASTER and ALOS-PALSAR satellites were projected on the plane by transforming the geographic coordinates to projected coordinates applying the Universal Transverse Mercator (UTM) method, using UTM Zone 19, Datum WGS84 and ellipsoid WGS84. Subsequently, a consistent mosaic of the four DEMs was made towards a single raster. Each raster within the mosaic had the same number of bands and the same bit depth.
Once the ASTER and ALOS-PALSAR DEMs were prepared, the micro-basins were delimited using the watershed tool within the hydrology module contained in the ArcGIS 10.0 Spatial Analysis toolbox. Regarding the properties of the basin, the slope of the land expressed as a percentage was determined using the ALOS PALSAR-DEM as input for each micro-basin, utilizing the surface tools in ArcGIS 10.0.
2.2 Delineation and properties of the water network of the Quintana and Cantilote creeks
The delineation and properties of the water network of the Quintana and Cantilote creeks were carried out using the DEMs, ASTER-DEM, and ALOS PALSAR-DEM, together with the tools of the hydrology module in ArcGIS 10.0 to generate maps on flow direction, accumulated flow, and streams. Likewise, the current classification tool was used to assign orders to the water network.
2.3 Models for the spatio-temporal prediction of meteorological variables of the Quintana and Cantilote creeks's micro-basins
The models for the spatio-temporal prediction of meteorological variables of the Quintana and Cantilote creeks's micro-basins were applied for precipitation and evaporation using the geostatistical analysis module in ArcGIS 10.0. The meteorological data on the monthly scale were acquired in two-time series (TS). TS-1 corresponded to the period 1980-1999 produced by the Ministry of Environment and Natural Resources (MARN, in Spanish) and TS-2 was created by the National Institute of Meteorology and Hydrology (INAMEH, in Spanish) during 2015-2018. TS-1 included monthly precipitation values measured with a pluviograph, using a type of meter that observes and records data in a band graph. Evaporation was measured with a type A evaporation tub [17].
The information corresponding to the period 2015-2018 was acquired by INAMEH using for precipitation, a tipping bucket as a raingage, calibrated to measure 0.01" (0.2 mm) of rain with each tip (contact between the bucket and the sensor) and a telemetry system with UHF (ultra-high frequency) radio transmitters [14]. Evapotranspiration (ET) is a measure of the amount of water vapor returned to the air in a given area. ET combines the amount of water vapor returned through evaporation (from wet surfaces) with the amount of water vapor produced through transpiration (exhalation of moisture through the stomata of the plant) to arrive at a total [11]. INAMEH's automated stations use air temperature, relative humidity, average wind speed, and solar radiation data to estimate ET, which is calculated once every hour, requiring a solar radiation sensor [18].
The spatio-temporal predictions were based on a model that combines deterministic and stochastic components [4]:
Where the target variable (Z) is associated with some location s, μ is the constant stationary function (global mean) and ε '(s) the spatially correlated stochastic part of the variation. The predictions are made as in [19] introducing the analysis of point data, the derivation and the plot of the so-called semi-variances -differences between the neighboring values:
Where z (Si) is the value of the target variable at some sampled location and z (Si + h) is the value of the neighbor at the distance Si + h. The semi-variances versus their distances produce a standard experimental variogram, which can be adjusted using authorized variogram models, such as linear, spherical, exponential, circular, Gaussian, Bessel, power, proposed by [20].
2.4 Validation of the Ordinary Krigging prediction method for estimating the meteorological variables of the Quintana and Cantilote creeks's micro-basins
The validation of the Ordinary Krigging prediction method for the estimation of the meteorological variables of the Quintana and Cantilote creeks's micro-basins was carried out by comparing the estimates in the precipitation and evaporation variables with the measurements of the meteorological station located in the Pao Cachinche water reservoir and reported in water balances prepared by the HIDROCENTRO Company [21-22].
2.5 Estimation of effective precipitation in the Quintana and Cantilote creeks's micro-basins
The estimation of the effective precipitation in the Quintana and Cantilote creeks's micro-basins was carried out by applying the US-SCS method [11]. For the application of the US-SCS model, the components adapted to spatially distributed variables were determined, detailing the description of the estimation of the spatial distribution through the raster of three components of the US-SCS model (land use and cover, soil type and runoff coefficients). In summary form, the required information was estimated as follows:
Initial conditions of the basin. The initial conditions of the basin depend on the antecedent precipitation. A moist soil condition was assumed, associated with the curve number (CNII) supported in a non-significant difference obtained in the effective precipitation determined by [8], considering the influence of the variations in the antecedent moisture conditions in the Pao river basin. The CNII values were selected according to the use and type of soil from [11].
Classification of soils according to their hydrological characteristics. The soils of the Quintana and Cantilote creeks's micro-basins were identified from the soil classification map for Venezuela produced by the IGVSB [23], finding that the soils was classified as an inceptisol type, corresponding to type D (high potential for runoff).
Hydrological Condition. As an indicator of the situation for infiltration, the hydrological condition was used as an index of the vegetation cover. The percentage of vegetation cover was extracted from the use and cover classification maps, finding a coverage proportion for the Quintana creek's micro-basin varying more frequently between 60 and 83%, as well as for the Cantiolote creek's micro-basin between 60 and 97%, being classified as good [11].
Land use and land cover. The supervised classification method was applied to 59 images of the LANDSAT 8OLI satellite on the monthly scale during the period 2015-2018. In both micro-basins, two types of coverage were detected, vegetation and degraded soil, the latter as a consequence of the denudation of the soil as a consequence of the natural phenomena of precipitation and runoff inherent to the hydrological cycle [11 ]. The predominant coverage during 2015 was vegetation. As well as two types of uses, agricultural and urban. The agricultural use that was detected in the satellite image analysis during the dry season could be the result of crops developed during the rainy season occupying between 5 and 10% of the micro-basins. This type of use is limited by the preservation of declared water reserve area according to Decree No. 2,320 by means of which the Protective Zone of the Upper and Middle Basin of the Pao River is created, in the states of Carabobo and Cojedes (Official Gazette No. 35,112 of 12-14-1992) [24]. e. Runoff coefficient. The Curve Number (CN) was determined depending on the soil classification, land use, treatment or practice, and the hydrological condition, the Curve Number (CN) was determined according to LULC, soil type and hydrologic condition of soils [11].
2.6 Analysis of the effective precipitation occurrence frequency of the Quintana and Cantilote creeks's micro-basins
The analysis of the effective precipitation occurrence frequency of the Quintana and Cantilote creeks's micro-basins was carried out by extracting a sample of data from the effective precipitation maps on the monthly scale in the period 2015-2018 for the Quintana and Cantilote micro-basins, by generating a vector that was entered into a tool to generate histograms and goodness-of-fit test of probabilistic functions to the study variables, within the MATLAB statistics module [25]. The results involved histograms, graphs of the effective precipitation exceedance probability and the maximum likelihood test as a criterion for selecting of the probabilistic distribution function (PDF) for the effective precipitation, testing PDFs such as exponential, normal and Weibull functions.
2.7 Spatial-temporal prediction of the groundwater flow of the Quintana and Cantilote creeks's micro-basins
The spatio-temporal prediction of the groundwater flow of the Quintana and Cantilote creeks's micro-basins was carried out using the database of the Ministry of Environment and Natural Resources [26-27], which provided information on 255 soil stratigraphic profiles obtained from the records of groundwater exploitation wells registered in the Ministry of Environment and Natural Resources during period 1971-2015. The prediction of the groundwater flow was carried out using the groundwater module of ArcGIS 10.0, which performs the flow estimation based on Darcy's Law [28]. The tool requires maps of static water levels in wells, effective porosity, saturated thickness, permeability, and transmissivity.
Maps of water levels were referenced for sea level. The water level decrease maps in the wells were obtained by applying the Ordinary Krigging method. Subsequently, the reference was made to the terrain utilizing the difference to the ALOS PALSAR-DEM. The soil properties referring to effective porosity, saturated thickness, permeability, and transmissivity were configured according to values reported in [23,27,29-32].
3.1 Geomorphological characterization of the study area
The study area was made up of two micro-basins corresponding to the Quintana and Cantilote creeks, tributaries of the Paito River (Fig.1).
3.1.1 Description of the geomorphological characteristics of the Quintana creek's micro-basin
The Quintana creek's microbasin was located between the geographic coordinates associated with the meridians whose longitude varies between W 68°10'30"and W 68° 07'30" and latitude between the parallels N 9°59 '00"and N 9°56'00" (Fig. 1). The Quintana creek's micro-basin area was of 8.23 km2. The characteristics of the streams of the Quintana creek's micro-basin can be observed in Fig. 1, finding that the length of the main stream was 6.98 km, the maximum order of the water network corresponding to the main stream was 5, drained mostly by 20.75 km of streams of order 1 and a total length of streams of 39.74 km. The variations of the terrain elevations within the Quintana creek's micro-basin were obtained for slopes above 20% in the area from the headwaters of the micro-basin. This had a smooth variation of the terrain elevations indicating that most of the area is a plain. This behavior was confirmed in the map of terrain slopes, where it was found that the extension of the area covered by slight and smooth slopes was representative in most of the area of the micro-basin, taking as reference the main channel, which is within the slopes classified as negligible (<1%).
3.1.2 Description of the geomorphological characteristics of the Cantilote creek's micro-basin
The Cantilote creek's micro-basin was located between the geographical coordinates associated with the meridians whose longitude varies between W 68°08'30" and W 68° 07'00" and latitude between the parallels N 9 ° 57 '00 "and N 9°58'30" (Fig. 1). The micro-basin area of the Cantilote stream was 2.09 km2. The characteristics of the streams of the Cantilote creek's micro-basin gave as a result that the length of the main stream of the Cantilote stream was 2.87 km, the maximum order of the water network corresponding to the stream main was 3, drained mostly by 5.49 km of streams of order 1 and a total length of streams of 10.42 km. The terrain elevation changes of the Cantilote creek's micro-basin resulted in a smooth variation of the terrain elevations of the river, indicating that most of the micro-basin was a plain.
3.2 Estimation of the monthly water balance for the micro-basins of Quintana and Cantilote creeks's micro-basins
The water balance was estimated for the Quintana and Cantilote creeks's micro-basins for two time series (TS). TS-1 encompassed the period 1980-2000 and TS-2 corresponded to the period 2015-2018.
3.2.1 Estimation of the monthly water balance for the Quintana and Cantilote creeks's micro-basins during TS-1
The estimation of the water balance for the two micro-basins involved five stages: 1) Spatial prediction of meteorological variables for TS-1, 2) Validation of the spatial precipitation prediction of the Quintana and Cantilote creeks's micro-basins for TS-1, 3) Validation of the spatial evaporation prediction of the Quintana and Cantilote creeks's micro-basins for TS-1, 4) Estimation of the water balance in the series for TS-1, 5) Analysis of the frequency of occurrence of the monthly water balance Quintana and Cantilote creeks' micro-basins for TS-1.
3.2.1.1 Spatial prediction of meteorological variables for estimating the water balance in the Quintana and Cantilote creeks's micro-basins for the TS-1
The water balance for TS-1 was estimated by making the difference between the raster maps of mean monthly precipitation and mean monthly evapotranspiration, weighted by area for the micro-basins of the Quintana and Cantilote creeks. Meteorological variables were uniformly distributed throughout the entire region.
For both micro-basins, in the dry period (January-March), the monthly precipitation was below 30 mm/month. In the rainy season, precipitation varied between 50 and 230 mm/month for 25 and 50% of the time. Likewise, minimum and maximum values occurred during the months of the rainy season, where precipitation varied between 30 and 250 mm/month. As an example, the May month showed the greatest randomness in the values. The maximum precipitation was observed from May to August, corresponding to 250 mm/month. There was a scarce variance of precipitation within any month in the dry season in the estimated values for 1980-1999, which varied between 5 and 10 mm/month, occurring by 25 at 50% of the time, while the variance increased between 40 and 50 mm/month within any month located in the rainy season for the period 1980-1999. Some outliers of monthly precipitation occurred, which were associated with those points beyond 1.5 times the interquartile range, which were found in the dry months (January, February, April, November, and December). Regarding evaporation (E), it was found that it takes the highest values and the greatest variance (40-60 mm/month), for the dry season (January-April), varying between 180 and 260 mm/month. The evaporation becomes more predictable during the rainy season because the variance decreased significantly (10 mm/month). In addition, the values in the interquartile range where these were located between 25 and 50% of the values, varied between 130 and 150 mm/month, being a range of regular occurrence during the rainy season.
3.2.1.2 Validation of the monthly precipitation prediction during TS-1
A comparison of the monthly precipitation was estimated by the Ordinary Kriging method derived from the MARN stations for the Quintana and Cantilote creels's micro-basins during 1980-1999 with the monthly precipitation observed in a meteorological station monitored by HIDROCENTRO in the Pao Cachinche water reservoir, for TS-1[21 -22], where it is observed that a high proportion of the observations were close to the estimates, existing a univariate linear relationship between the estimates and observations of the monthly precipitation through a gradient of 0.86, which was approximate to a 1:1 ratio, supported by a determination coefficient between observations and estimates of 0.95, which confirms a high to very high correlation [33]. As well as, the mean standard error varied in the order of 10-2 and 10-3, being close to zero and standardized mean square error varied between 0.7 and 1.52, less than 2 standard deviations, indicating that atypical errors did not occur [33].
3.2.1.3 Validation of the monthly evaporation prediction during TS- 1
A comparison of the monthly evaporation estimated by the Ordinary Krigging method derived from the MARN stations for the Quintana and Cantilote creeks's micro-basins for TS-1 with the monthly evaporation observed in a meteorological station by HfDROCENTRO in the Pao Cachinche water reservoir was applied for the period 1980-1999 [21-22], finding a univariate linear relationship between the monthly evaporation estimates and observations through a gradient of 1.15. Likewise, the determination coefficient between the observations and estimates was 0.98, which confirms a high to very high correlation [33].
3.2.1.4 Estimation of the monthly water balance during TS-1
The estimation of the monthly water balance (MWB) in the time series N° 1 (1980-1999) for the micro-basins of the Quintana and Cantilote streams, Carabobo State was made, finding alternation of the negative values of the MWB during the dry season and positive MWB values during the rainy season of each year in the period 1980-1999, reaching a maximum of 1,234,500 m3/month in the TS-1 for the Quintana creek's micro-basin and 313,500 m3/month in TS-1 for the Cantilote creek's micro-basin.
3.2.1.5 Analysis of the monthly water balance occurrence frequency of the Quintana and Cantilote creeks's micro-basins during TS.-1
The monthly volumes were associated with three probabilistic distribution functions, being the probabilistic Weibull function the one that best fits the observations. The flow associated with 80% exceedance probability was 120,000 m3/month and 30,000 m3/month for the Quintana and Cantilote creeks's microbasins, respectively.
3.2.2 Estimation of the water balance for the Quintana and Cantilote creeks's micro-basins during TS-2
3.2.2.1 Spatial prediction of meteorological variables during TS-2
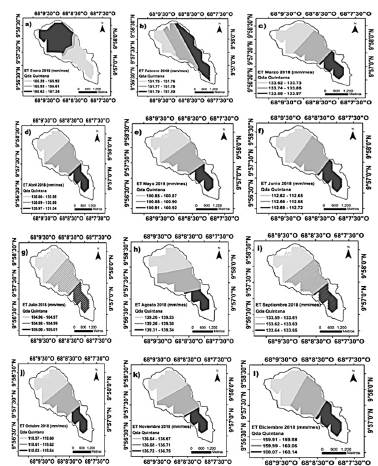
There was scarce variance of precipitation within any month in the dry season in the estimated values for 20152018 (Fig.2), which had an approximate variation of 10 mm/month, occurring in a 25 to 50% of the time, while the variance increased between 40 and 50 mm/month within any month located in the rainy season for the period 2015-2018.
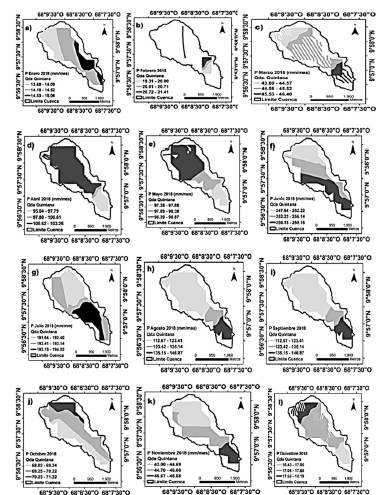
Source: Own elaboration
Figure 2 Spatio-temporal prediction of precipitation (P) in the Quintana creek's micro-basin for TS-2.
In the data sample between 2015 and 2018, the maximum and minimum values were closer to the interquartile range. As well as it was observed that there were no extreme values (values with more than 1.5 standard deviations with respect to the interquartile range) or atypical (values with more than 3 standard deviations of the interquartile range) [33].
Regarding evapotranspiration (ET) (Fig. 3), it was found that it takes the highest values and the greatest variance (100180 mm/month) for the dry season (January-April), varying between 100 and 120 mm/month during the rainy season (Fig. 3a-3d). During the rainy period, the ET tends to be stable during the months where the maximum precipitation occurs (June-September), varying between 100 and 120 mm / month (Fig. 3e-3j), whose values are the lowest during each year. The interquartile range is small, varying between 10 and 20 mm/month.
3.2.2.2 Validation of the monthly precipitation prediction during TS-2
A comparison of the monthly precipitation estimated by the Ordinary Krigging method derived from the INAMEH stations for the Quintana and Cantilote creeks's microbasins in the period 2015-2018 was carried out with the monthly precipitation observed in a meteorological station by HIDROCENTRO in the Pao Cachinche water reservoir, for the period 2015-2018 [21-22], where it was found that there was a high proportion of observations overlap with the estimates in both the dry and rainy seasons. The behavior was similar throughout the measurement period. Therefore the Ordinary Kriging method led to estimate in a satisfactory approximation, the Ordinary Kriging method led to a satisfactory approximation of the deterministic (monthly mean value) and stochastic components through a J-Bessel function [4]. Precipitation increased from less than 50 mm/month during the dry months (January - March) to 250 mm/month during June to August 2015-2016.
3.2.2.3 Validation of the monthly evaporation prediction during TS-2
A comparison of the monthly evaporation estimated by the Ordinary Kriging method derived from 15 INAMEH stations for the micro-basins of Quebradas Quintana and Cantilote in the period 2015-2018 was applied with the monthly evaporation observed in a meteorological station by HIDROCENTRO in the Pao Cachinche water reservoir, for the period 2015-2016 [21-22], where it was found that the values of evaporation (E) measured in the Pao Cachinche water reservoir were higher in the order of 1.4-1.5 times with respect to evapotranspiration (ET) during the dry season, which was possibly due to an increased potentiality of the occurrence of a greater mass of evaporated water from the Pao Cachinche water reservoir with respect to the ET measurement made in airports of urban areas, this fact could be also explained due to El Niño-related droughts, which are typically more extensive than wetter-than-normal weather conditions associated with La Niña [34]. In the rainy season, it was found that the E and ET approach significantly, which was due to the influence of the increase in the intensities, duration and frequencies of the occurrence of rains in this annual season (Fig. 4).
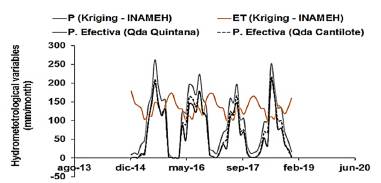
Source: Own elaboration
Figure 4 Time series of precipitation (P), evapotranspiration (ET) and effective precipitation (PE) in the period 2015-2018 estimated from records of INAMEH stations for the micro-basins of the Quintana and Cantilote creeks, Carabobo State, Venezuela
Fig. 4 compares the monthly evapotranspiration estimated by the Ordinary Kriging method derived from the INAMEH stations for the Quintana and Cantilote creeks in the 2015-2018 period and the monthly evapotranspiration estimated by the Krigging method. Ordinary derived from the INAMEH stations for the San Diego river basin, Carabobo State according to [10], for the period 2015-2017, where it is observed that there was a high approximation between the values in the annual dry and rainy seasons, confirming a trend towards spatial homogeneity in the measurement of automated sensors (solar radiation, temperature and wind) in an area where the stations were located between the states of Carabobo, Aragua, Guárico, Capital District and Miranda.
3.2.2.4 Estimation of the monthly water balance for TS-2
The representation of the time series of precipitation (P), evapotranspiration (ET), effective precipitation (PE) in the of Quintana and Cantilote creek's micro-basins in the period 2015-2018 is shown in Fig. 4, where the following aspects are observed:
The effective precipitation corresponding to Quintana and Cantilote creeks's micro-basins was obtained as the weighted average of the spatial prediction obtained from the adaptation to two dimensions of the US-SCS method. The components were made up of maps of LULC, soil type, runoff coefficients and effective precipitation during 2015-2018. The Quintana creek micro-basin presented agricultural use between 5 and 10%, and covers based on vegetation (75-80%) and degraded soil (20-25%), referred as a consequence of the denudation of the soil because of the natural phenomena of precipitation and runoff inherent to the hydrological cycle [11]. As for the Cantilote creek's micro-basin was characterized by containing only covers of vegetal types (75-85%) and degraded soil (20-25%). For both micro-basins, the soil was found within the inceptisol class [23]. From the LULC maps as well as the soil classification, three runoff coefficients were assigned according to the delimitation of the land use and cover maps, associated with agricultural lands without treatment, prairie or pasture in poor condition, and sparse or poor cover forests. On this basis, effective precipitation resulted in behavior similar to and below total precipitation.
Precipitation and effective precipitation were found in a close relationship varying in the order from 0.52 to 0.87 in the rainy season.
The effective precipitation of the Quintana creek's micro-basin was similar to the values estimated for Cantilote creek's micro-basin, being the latter slightly higher in some periods.
Both precipitation and effective precipitation were higher than evaporation in the rainy season of each year, which supports the monthly water production of each micro-basin.
3.3 Estimation of the water production of the Quintana and Cantilote creeks's micro-basins
The water production was estimated by combining the results of the surface component with the underground one. The surface drained volume component was obtained from the monthly water balance (PE-ET), (Fig. 4). Using the equation associated with Darcy's Law [11], the base flow component was estimated, implemented through the groundwater flow module in the ArcGIS 10.0 computational tool. The ArcGIS 10.0 work environment tool required input of static water level maps, and physical properties, such as effective porosity, saturated thickness, permeability, and transmissivity, of the aquifer obtained from lithological profiles.
The static level of groundwater in the Quintana creek's micro-basin was higher in the upper zone of the micro-basin (476.72 masl) and decreased towards the mouth (454.35 masl). The static level was estimated through the difference between the ground level, extracted from the ALOS-PALSAR DEM, and the decrease in water level into the wells.
As a sample, the lithological profile of a groundwater well registered with MARN with the code N ° CA6061001A, is described. Additionally, in 2012, INAMEH together with CIHAM-UC carried out a geoelectric prospecting study in the Palmar de Paya community, Carabobo State [35], close to the Quintana and Cantilote micro-basins, finding the first stratum up to 8 m below the ground, consisted of gneiss, weathered feldspathic micaceous quartz. As well as in a second stratum between 9.5 and 17 m, contained layers of fractured weathered feldspathic schist and quartz phyllites. And finally, a third stratum between 18 and 26 m was constituted by weathered feldspathic micaceous quartz horblendic Gneiss. According to this lithological profile, the accumulation and storage of water occurs through the sediments and by the different planes of fracturing, faults and foliation, a product of the dynamics of regional tectonics that allows secondary porosity for the groundwater accumulation.
The effective porosity for foliated rock varied in the order of 10 to 30% [29-32,35]. The effective porosity values reported in the maps resulted from spatial prediction using the Ordinary Kriging method applied to a MARN database of 235 groundwater wells for the Carabobo state [21-22].
The permeability of the foliated rock was of the order of 0.3 - 2.5 m/day [29-32,35]
The type of aquifer was confined. According to [11], a confined aquifer is delimited from above and below by impermeable formations. In the particular case of well N ° CA6061001A, the confinement of the aquifer was since there is a layer at the upper end close to the ground surface of 3 m of clay and a layer at the lower back of the well, between 42 and 45 m below the surface of the rocky terrain.
According to [11], in a confined aquifer, the transmissibility coefficient (T) is the product of the permeability (K) and the thickness of the aquifer (m) and has the dimensions of m3/ day/m. The saturated thickness was determined from information extracted from 235 MARN's groundwater wells and the spatial prediction using the Ordinary Kriging method was applied to obtain the saturated thickness map for the Carabobo State. From the permeability and saturated thickness maps of the aquifer, T was obtained in the Quintana and Cantilote creek's micro-basins, being 11 m2/day, as well as the groundwater flow for the micro-basins was 34 m3/day (1000 m3/month) (Quintana creek) and 11 m3/day (500 m3/month) (Cantilote creek).
3.3.1 Analysis of the monthly water balance occurrence frequency of Quintana and Cantilote creeks' micro-basins for TS-2
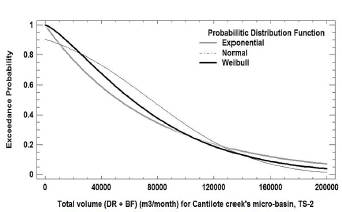
The occurrence frequency analysis of the monthly water balance including surface and groundwater flows of Quintana and Cantilote creeks's micro-basins for the TS-2 was made, finding that there was a satisfactory graphical fit of the function of the positive monthly volumes derived from the superposition of the monthly water balance (PE-ET) and the monthly groundwater flow to the Weibull probabilistic distribution function when compared with the Normal and Exponential distribution functions.
Fig. 5-6 show the exceedance probability of the total volumes in TS-2 produced for the Quintana and Cantilote creek'ss micro-basin (QM) (Fig. 5-6), which groundwater runoff (base flow) was 100 times smaller than the monthly direct runoff (DR) values, resulting in a flow predominantly defined by direct or surface runoff rather than groundwater runoff.
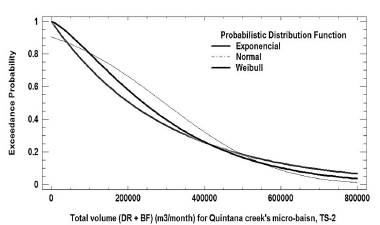
Source: Own elaboration
Figure 5 Total volume (direct runoff + base flow) for Quintana creek's micro-basin for TS-2.
4. Conclusions
The geomorphological and water network characteristics of the Quintana and Cantilote creeks's micro-basins were obtained from the processing of a digital elevation model of the terrain with high spatial resolution as one of the products of the ALOS PALSAR satellite. With respect to the water network, the micro-basins of Quintana and Cantilote creeks gave orders of medium to high streams, representing a predominant drainage of surface waters and influenced by a soil type with a tendency to be impermeable. The highest proportion of the micro-basin area was found between medium to low slopes. The hypsometric curves of both micro-basins showed that about 80% of the basin area is experiencing gradual changes in terrain elevation, presenting a concave shape that suggests the occurrence of antecedent processes of erosion and sediment transport from the highlands to the lower zones. In both micro-basins, with a frequency greater than 50%, terrain slopes of less than 20% were obtained, evidencing the trend towards plains formation. The abrupt changes of terrain slopes between the upper and middle basins can cause changes from supercritical to subcritical regime causing backwaters or potential flooding in the transition, giving rise to possible highly erosive events in the terrain and accumulation sediments in the plain.
The ordinary Kriging method was validated by comparing the spatial predictions of precipitation and evaporation for the time series N ° 1 (1980-1999) with observations in the Pao Cachinche water reservoir collected through a meteorological station controlled by the Hydrological Central Company (HIDROCENTRO) obtaining a gradient approximate to unity in a simple linear relationship whose determination coefficient ranged from high to very high. In the first time series, the results gave a medium to high autocorrelation of 0.6 for a lag coefficient between 12 and 24 months.
Likewise, in the second time series of data that covered the period 2015-2018, the Ordinary Kriging method was found to estimate precipitation and evapotranspiration values in a high approximation to the observations in the Pao Cachinche water reservoir and those of other INAMEH stations in neighboring watersheds. In the specific case of the evapotranspiration reported by the INAMEH stations and the evaporation measured with a tub in the Pao Cachinche water reservoir, the evaporation was higher than the ET due to the influence of the mass fluxes of water vapor emitted from the Pao Cachinche water reservoir by comparing with the measurements in stations located in metropolitan airports from which the INAMEH database was generated.
In both TS-1 and TS-2, precipitation, evaporation and evapotranspiration reproduced the annual trend-cycle. Precipitation remained low in the dry seasons (<30 mm / month) and increased by approximately 5 to 6 times the regular rate in the dry season that occurred during the rainy season. The difference between evapotranspiration in the dry season was around twice that occurred during the rainy season.
From the processing and analysis of 59 images from the Landsat 8OLI satellite in the period 2015-2018, it was possible to estimate the land use and land cover of the Quintana and Cantilote creeks's micro-basins, finding in the first a monthly average of around 5-10 % for agricultural use, 75-80% for vegetation cover and 20-25% for degraded soil. Likewise, for the Cantilote creek's micro-basin, a vegetation coverage proportion of 75-80% and degraded soil of 20-25% was found. The soil of the micro-basins was inceptisol and the combination of uses and covers, as well as the soil type yielded runoff coefficients between 80% and 90%, close to 100%, considering cultivated lands without treatment, meadows and pastures in poor condition, which produced runoff levels varying between 50 and 85% of the total precipitation for the rainy season.
The monthly water production estimated through a monthly surface water balance was similar both in the TS-1 for a difference (P-E) and in the TS-2 for a difference (PE-ET). The reduction was due to the fact that considering the losses due to infiltration, PE/P ratio varied between 0.50 and 0.85 for the rainy season, resulting in a surface flow that ranged between 100,000 and 120,000 m3/month for the Quintana stream micro-basin and 25,000 to 30,000 m3/month for the Cantilote creek, both for an exceedance probability of 80%. When considering the inclusion of the groundwater flow component, which was up to 100 times less than the surface flow, the total contributed the surface flow defined volume.

