


 Inglés (pdf)
 Articulo en XML
 Referencias del artículo
 Enviar articulo por email
 Citado por SciELO
  Citado por Google
  Similares en
SciELO
Similares en
SciELO  Similares en Google
 Permalink
1. Introduction
The design of experiments (DoE) is a widely used technique for optimizing fabrication processes in the design and development of products and processes. [1]. This Technique hasn't been used prominently in the betterment of services or processes unrelated to fabrication (not tangible), having high potential for optimizing such processes. [2].
This document explores the benefits and challenges posed by the implementation of DoE in a context outside of manufacturing, specifically in the health industry. This document also attempts to demystify the notion that DoE isn't just applicable in the manufacturing industry and processes inside every organization not linked to manufacturing. For this to occur, the following scenario is presented [3].
Nowadays, the health industry is confronted by a series of issues with users who miss their appointments without canceling them, directly affecting the quality of the services being offered, raising the prices, and taking away the opportunity for other users to receive the service promptly [4]. The industry is aware that between 15% and 20% of healthcare appointments are unattended by patients. Fabían Cardona, vice-president of Acemi (a guild consisting of the principal Healthcare Providers (HCP's) involved in the contributory regime and prepaid medicine), stated in 2017: "This is necessarily the fault of the user, rather than a challenge we have as a system" [5].
The intervals between appointments are extended due to a lack of foresight in their culture. Medtronic [6] (a healthcare company working at an international level) showcased that many times the appointments are missed due to the patient misremembering the date or irresponsibility in the preparations needed beforehand (such as when eating hours before surgery). These causes could be avoided easily with something as simple as ensuring they understood the instructions and reviewed the date [5].
The present article develops an experimental design allowing us to create six stages to understand the effects some monitoring and control strategies by health institutions have in maximizing the number of appointments while also minimizing costs involved in reprocessing and subpar used and unused resources.
In the first chapter, the author will develop a contextualization of the problem, which originated this investigation, affecting the general health system and impacting many involved and interested parties.
In the second chapter, the author presents the derived question of the problem, including the objectives sought after during this research. Before choosing the model of experimentation, the author will review the thematic state of the art, focused mainly on the use of Doe in service enterprises, considering the handling of data related to the health services, and medical and hospitality issues found and further explored in the third chapter.
The fourth chapter presents the research methodology used for the design formulation and development. For the fifth chapter, the gathered data is analyzed to better understand the process and services.
In the sixth chapter, the development of the experiment is presented, where the factors and levels are determined, a variable serving as an answer is selected, and the experimental design is selected. Finally, it showcases the results from the experiment, highlighting certain factors that result from missing appointments, such as convent type, and others that are irrelevant such as the strategies for recording appointments with patients.
2. Justification
The health ministry stated as mandatory for the different parties of the health system, the use of an obligatory system that provides quality [8] for the service, including security, pertinence, and continuity, among other criteria.
Additionally, it regulated the health service by levels [9], the first one being the least complex, with the participation of basic teams; the second level is focused on special treatments, and finally, the third level consisting of the most complex services, with the participation of various specialist and subspecialties, and with up-to-date technology, all in the effort to better treat the patients who require it [10].
In 2016, there were 3,253,172 medical appointments booked in Bogota, from which a total of 422.971 (l3%) were missed by patients [11]. Throughout 2017, patients who stopped attending the scheduled medical appointments on the public web cost the city around 21.900 million dollars; about 569,044 missed appointments or 8.7% of the 6,508.497 booked appointments that same year [12]. The administration warned that, compared to 2016, the amount of missed appointments increased by 34,5%. It's estimated that, on average, every missed appointment has a net value of $38,591.
Fig. 1. showcases the statistics brought by the new EPS (an HCP) concerning the number of appointments missed by affiliates.
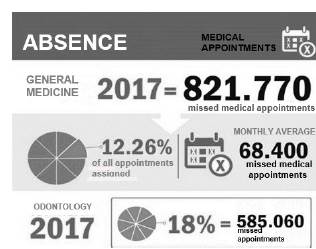
"Appointments missed from general medical consultation, infirmary, psychology, and special treatment, among others, imply the booking of a specialist and medical staff," explained the district, highlighting that, seeking to diminish the amount of missed appointments, it has implemented strategies such as a unique local line of medical appointments [12]. This service allows patients to book or cancel appointments quickly, additionally with messages and confirmation/review calls.
By 2018, the figures had increased. Until the month of May, there was a nonattendance of 361,613 medical appointments or 12,3%; basically, every month, 72,322 appointments were missed (see Fig. 2.). The country's regions with most appointments missed are the north with 16,8%, the capital with 12,9%, the central east region with 12,1%, and southwest of the country with 10,7/ [13].
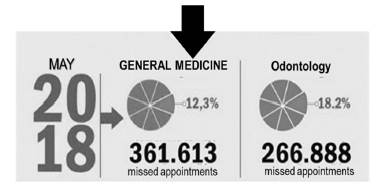
The main reasons for the number of users missing their appointments are: First, they cannot attend the initial appointment due to personal activities. Second, the users forget the appointment. Third, the lack of penalty fees, and lastly problems with public transport.
3. Research question and objectives
Considering the recent issues, the Colombian health system faces, mainly the high costs and/or economic losses due to the misuse of resources in the system, caused by the lack of commitment by patients, the following design formulates the research question and objectives, these being:
3.1 Question
What factor(s) in the provision of health-related services will allow a decrease in the percentage of missed medical appointments?
3.2 Objectives
Determine the factor influencing the moment a person decides not to attend previously booked medical appointments.
Explore the data to find possible groups of people who miss medical appointments.
Find possible correlations between the factors being studied.
Propose strategies for health entities, following the design results, which might decrease the percentage of missed medical appointments.
4. Theoretical frameworks
4.1 Experimental Design for service enterprises
In literature [14] concerning the use of experimental design in enterprises, there are a lot of information and cases where the said theme was used for manufacturing enterprises. However, checking the methodology used in service enterprises, literature was scarce, although, with the information gathered, we could see significant difficulties for service enterprises. These issues are due to subjective aspects involved in collecting data because if it is biased, it will be harder to choose the appropriate variable for the research.
In accordance with [15], in Table 1, from a review of the literature used, a critical summary is presented that reveals the challenges various authors believe affect the usage of experiment design in service enterprises, which is the objective of the current research.
4.2 Missing appointments in Colombian health entities
The study about missing specialized appointments of high resolution and economic repercussion by Aragon sanitary consortium reported that out of the total appointments, 10% did not attend, the failure to attend being higher for women's first consultation in the morning without any difference regarding the weekday, being one of the most jeopardized services: rehabilitation (17.3%), gynecology (13%), traumatology (11%) and ophthalmology (10.3%) [16].
According to a 2018-2020 study, the nonattendance of patients to specialized consultations was 16.1%, the data was taken using statistics from attention centers. The most frequent failure to attend comes from children (mostly in dermatology and nutrition) and in places with a high density of indigenous people, less diversity, and specialists, and for February, July, November, and December. The biggest motivator for nonattendance was forgetting the appointment, weather, and transport problems.
4.3 The completely random design
The completely random design (DCA) is a statistical method normally used in experiments with only one factor, where it looks to compare two or more treatments through a variance analysis (ANOVA), where it formulates a model with the structure of (1).
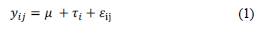
Where:
y iJ is the j observation of the i of the factor
μ is the global mean
Ti is the treatment's effect
εij is the error associated with observation y iJ
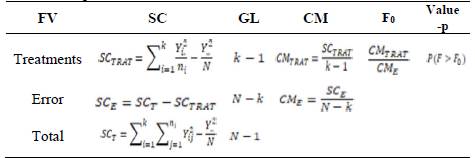
With this, we wish to validate the significance of each factor. After defining the model, we create the ANOVA, as shown in Table 1.
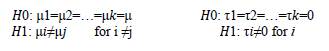
We verify the hypothesis using the statistic F0 and the value -p.
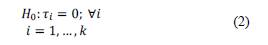
In other words, if the proof of the hypothesis H0 (equation (2)) is rejected (any t is different from 0), we can say the associated factor of this t influences the experiment.
4.3.1 Factorial Design 2k
The objective of a factorial design [17] can be seen as an extension of DCA. Its objective is to study the effect of various factors over one or many answers, unlike DCA, which observes the effect of a single factor. In this case, we handle two or more factors with three levels each. Thus, the model is similar to DCA only that it has k factors, and its proof for the hypothesis is the same for each one of the interactions.
4.4 Mixed factorial design
The objective of a factorial design is to study the effect of various factors over one or multiple answers, where it has the same interest over all the factors.
This design is a modification of the 3K factorial design. It is restricted to all factors having three levels. Meanwhile, the mixed variation can have distinct levels; for example, in a 4x4x3 design, the first factor has four levels, the second has four levels, and the last has three levels.
The model and the proof of the hypothesis are the same as the 3k design, making sure the subscript corresponds to the factors and levels.
5. Materials and methods
The investigation of this article is experimental in nature, through a logical, systematic, and methodological process of sequential treatments, where every factor of the study will be manipulated to determine how the answer variable of the experimental design is affected.
Problem definition and objectives.
Descriptive and explorative analysis.
Preparation of the database, reclassifying the numerical variables to categories.
Experiments are designed.
Determining the factors and levels maintaining a balanced base.
Determining the experiments according to the factors.
Evaluating and analyzing the results given by the experiments.
Proposing a strategy to diminish the percentage of patients failing to attend appointments.
6. Result: data analysis
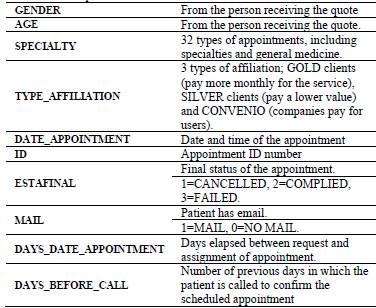
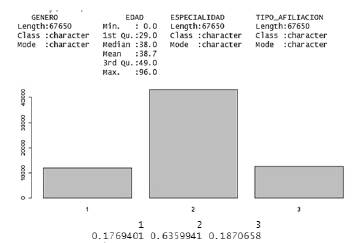
A database with 67,650 id clients is available, containing 974,100 registers. For the formulation of the experiment and based on the data recompiled over five months, the following variables were obtained (Table 2).
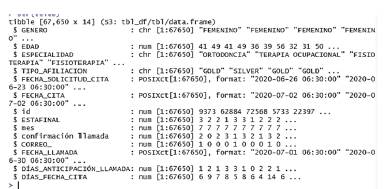
The database contains three categorical and eight numerical. Variables. The variable finds its final phase through a transformation, from numerical to a factor (Fig. 3).
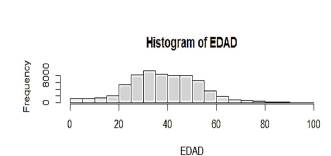
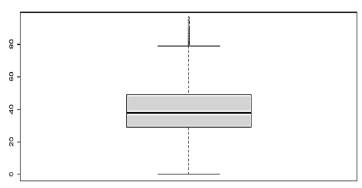
From the summary of the variables, we can tell that the average age of people who book medical appointments is 39 years, though there are some atypical data of patients older than 80 years. Considering that the majority of data is found in the age range of 20 to 50, this will be a criterion for the screening of the database (see Figs. 4 and 5).
In terms of the "final stage" variable, 18% of appointments were canceled (stage 1), 64% attended (stage 2), and 19% missed (stage 3), as can be seen in Fig. 6.
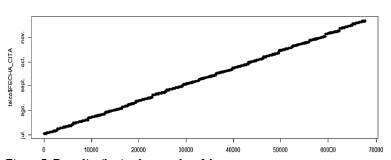
Regarding the months, we have information for the second semester (from July to the month of December). At the same time, the ID variables can be established to be in sequential numerical order. The lower numbers correspond to the first months of the second semester, and the larger id corresponds to the last months of the year (Fig. 7).
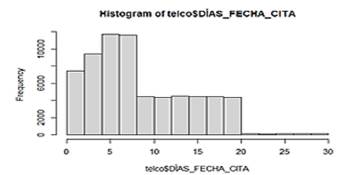
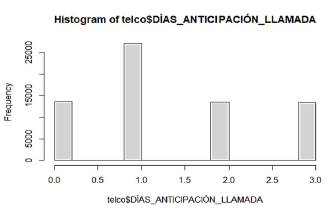
Regarding the days between the booking and the conclusion of the appointment, it can be observed that the times concentrate between 1 and 20 days (Figs. 8-9), and in a lesser proportion, the days where the appointment is assigned surpasses the 20-day mark shown by the dispersion diagram. Concerning the anticipation days for calls to confirm the appointment, it can be observed in the graph that the health institution makes calls in the majority of cases, one day before the booked appointment.
From the next graphic (Fig. 10), it can be observed that women cancel appointments more often than men. The customers failing to attend the most are in the gold category; this might be due to the lack of penalty fees if they cancel or miss the appointment. Conversely, the users in the silver category are the likeliest to attend their appointment.
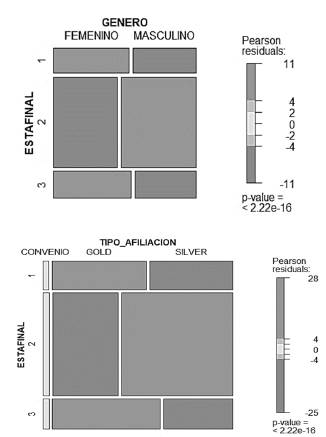
Source: The authors
Figure 10 Behavior by gender and type of affiliation Vs. Cancellation or fulfillment of appointments.
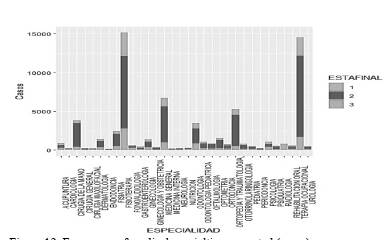
By making a graph showing the relation between specialties and final stages, it is possible to see the heterogeneity in every category's contributions in counting cases 1, 2, or 3. Subcategories such as occupational therapy inside the variable of specialty concentrate the largest number of cases, independent of the subcategory. At the same time, it is important to highlight that the largest quantity of information regarding the cases of cancelations and absences is in the same subcategories previously mentioned.
Regarding the specialties, it is noted (Fig. 12) that the specialties with the most significant influx of users are physiotherapy, occupational therapy, and gynecology.
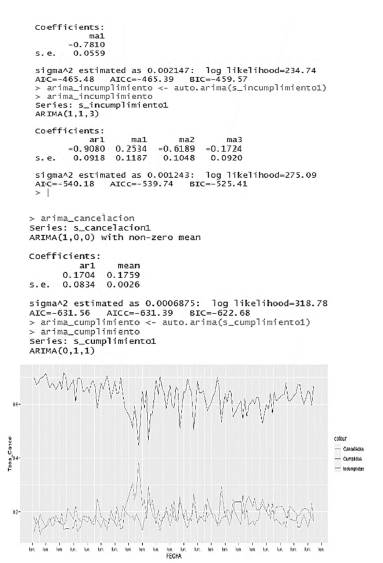
When analyzing the series of times of each case, we can appreciate that there exist clear differences concerning the level of canceled and absences in regard to attended appointments. At the same time, it can be seen that certain types of factors exist which points in the direction of the seasonality of the series, something being present in the valleys that appear periodically in the series.
At the same time, by making an auto-Arima to the series of cancelations, attendances, and absences, we find that the series have different characteristics. It is possible to notice that, for example, the series of accumulated cancelations by day have an autoregressive relation with the cancelations of the previous day. This situation might be explained by the effects of a group tendency, where the patients respond to certain conjectures maintaining themselves throughout time, at the time of canceling their appointment.
Similarly, it is possible to appreciate that there is an MA factor for the series of attendances, thus having a significative partial autocorrelation for the previous period, independent of other periods. This finding could be linked to patients who have appointments for one month and usually have checkups the following month.
Concerning failure to attend, it is possible to appreciate an important complexity in the series (Fig. 13) which leads us to think about aspects other than seasonal ones. This series has factors that are not being modeled in the correct manner; thus, we could conclude it is the hardest series to predict.
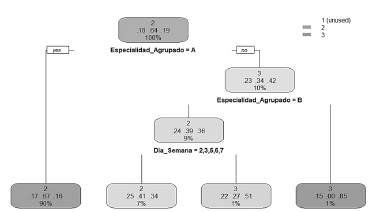
By making a classification tree, it can be noted that the prediction for the final stage of the appointment is based on the specialty (an aggrupation of specialties was made) and the day of the week. Thus, we understand that a factor of a particular weekly season must exist affecting the probability of having a state of cancelation or absence.
At the same time, in concordance with the previous graph, we can appreciate that the types of specialties affect the probabilities of having a different ESTAFINAL for the subcategories (Fig. 14).
7. Formulating the experiment
We have access to a database with 67,650 registers of medical appointments, from which 14 variables are taken, such as age, gender, specialty, type of affiliation, date, among others, which will be redefined later on for the study, due to the need to categorize some of the variables.
7.1 Selection of factors and levels
For the formulation of the experiment and based on the recompiled data of the last four months of the studied hospital, in regard to the percentage of unattended appointments, out of the total programmed appointments, we propose to evaluate the reasons behind patients missing their appointments. For this task, we define the following factors and their respective levels (Table 3). These factors are based on previous studies, which present some plausible reasons causing the problem and have large implications regarding the economy of the Colombian health system.
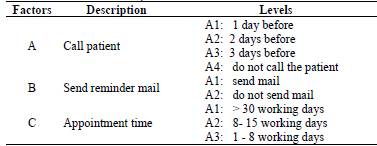
To analyze every factor, we decided to make a previous analysis for factor A, calling the patient, with its respective three levels, obtaining an analysis for the factor variance.
7.2 Selection of the answer variable
The selection of the answer variable, or dependent variable, must ensure the measurement's effectiveness in showing information regarding the study being made. In accordance with the given information and the need to generate better service times and treatments; we formulate the answer variable as follows:
7.3 Selection of the experimental design
7.3.1 Analysis of the unifactorial variance
We formulate a completely random design, given that it only considers two sources of variability: the treatments and random errors. In this case, we discuss a balanced design because we have done the same number of repetitions (5) for every single one of the treatments (Call time).
The formulated model is:
Where:
7.3.2 Experimental design 3k
Given that we have already defined the variables, we select the experimental units. In this case, 180 medical appointments assigned to people between the ages of 20 and 50 because people younger or older than the given age range might not be responsible for booking the appointment themselves. Afterward, to have homogenic units, we use the following restriction (3). The formulated model is:

Where:
7.4 Development of the experimental design
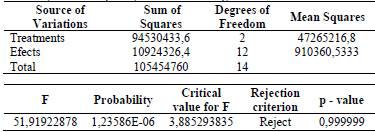
We used the analysis of variance (ANOVA) (Table 4) to determine if there were any differences in the measurements of the treatments. Fundamentally, this analysis separates the contribution of each source of variance in the total variance observed. To note normality, constant variance (equal variance in the treatments), and independence.
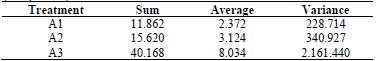
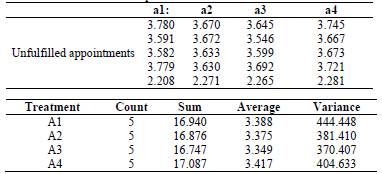
The ANOVA is made for factor A: Call the patient for the appointment, obtaining the information shown in Tables 5 and 6.
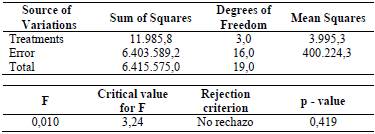
It can be observed (Table 6) that it does not reject the null hypothesis, which indicates that there are no differences between the times of review calls and missing the appointment.
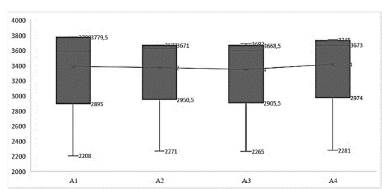
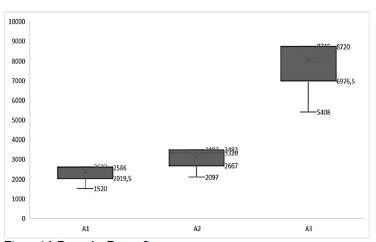
In graph form (Fig. 15), after making the diagram, it is noted that the values of the means between all the treatments are similar and that all appear to have considerable dispersion.
The analysis for factor B is made, and it does not reject the null hypothesis, which means this factor doesn't have an effect on the nonattendance of appointments. However, after checking Factor C, the following results are shown (Table 7).
By rejecting the uniformity of the treatment's mean, it indicates that at least one of the measurements is different from the rest and has an effect on the answer variable. Next, we seek to establish the treatment that has a different behavior from the others through the calculation for the treatment effect I, τi=μi-μ, by calculating the distance between the treatment mean and the global mean.
A box diagram is made, seeking to compare the means between treatments.
The LSD methods (Table 8): Least significant difference and turkey (also known as HSD, honestly significant difference) were used to compare the measurements, obtaining that it rejects H0: μ𝑖=μ𝑗, for the comparison between treatments A1-A3 and A2-A3, as previously visualized in Fig. 16.
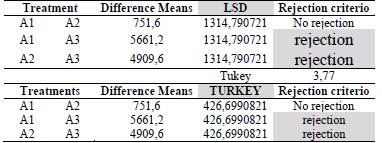
Therefore, it can be concluded that it is more beneficial for hospitals to generate appointment-reminding strategies with a maximum of eight (8) days before the scheduled appointment.
8. Conclusions
Through the design of the experiment, specific causes could be found explaining the failure to attend medical appointments, which in recent times are increasingly costly to the health system, thus decreasing the quality of service. From the analysis of the data, the following conclusions were reached:
Nonattendance was less present in people in the gold level and those who could be assumed to have a higher pay grade, which indicates that the strategies for bettering medical care should be targeted towards this population.
Considering that nonattendance is more present in members outside the gold level, it could be avoided through a message or email confirming the appointment. Also, people in line could have the option to be notified when an appointment has been canceled (thus being able to arrange an earlier new appointment). In any case, the people who access this service are people in the range of 39 years old, in which case they should be held accountable for any nonattendance reason.
Men appear to be the ones with fewer absences; however, this is linked to the fact they also book them the least. On the other hand, women are the ones who miss the largest number of appointments. Thus, specialties for women are expected to have a large number of absences, and therefore higher costs due to nonattendance (gynecology, obstetrics, etc.)
The time that takes place between the scheduling of the appointment and the date of its execution is a factor that impacts the nonattendance to medical appointments. The longer it takes, the higher the probability of failure to attend, whether the patient is forgetful or no longer requires the appointment.
There is no difference between patient-reminding call times versus appointment attendance, so it is not a determining factor for patients to attend medical appointments, so previously calling patients would not add value to the service.
For further study, it is suggested to explore other factors to be determined, such as gender, that might have a variable influence on the answer.

