


 Inglés (pdf)
 Articulo en XML
 Referencias del artículo
 Enviar articulo por email
 Citado por SciELO
  Citado por Google
  Similares en
SciELO
Similares en
SciELO  Similares en Google
 Permalink
1. Introduction
Over the last years, processing seismic noise signals has gained greater significance as it has allowed not only to estimate seismic noise levels and their impact on seismic records- depending on noise sources- but also to assess broadband seismic stations performance in several local and regional networks.
In addition, noise models have been central for evaluating seismic station sites characteristics and design, as well as instrument design [1].
Up to date, no noise studies have been conducted for the Cuban seismic network, mainly because the network was initially composed of just a few broadband sensors after digital migration and real-time transmission in 2010 [2].
Following that date, and considering that over the last five years the spatial coverage of the network has been expanded with additional broadband seismic stations, it has been deemed necessary to conduct a seismic noise study given the high sensitivity of seismometers over a broad frequency range and also because, in some cases, these instruments have been deployed at locations that had been selected for the installation of short-period sensors. This has resulted in noisy data thus hampering earthquake analyses and affecting seismic data quality, mainly for theoretical and applied studies.
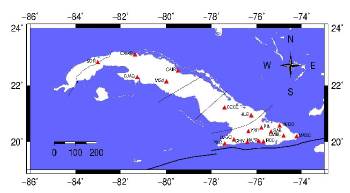
At present, the Cuban seismic network operated by CENAIS is made up of 19 stations equipped with short-period and broadband seismometers, the majority of which have been deployed in the eastern part of the island owing to the high seismicity of this region [3]. Given the proximity to the main Cuban fault system, commonly known as the Septentrional-Oriente Fault Zone, accelerometers have also been installed in some of the stations to monitor strong earthquakes.
For this study, a set of seismic stations has been chosen for the analysis of 2016 and 2018 available data. Stations are geographically located as shown in Fig. 1. Two full years data recording helped characterize seismic noise level and compare seismic station performances during both years. Only 11 stations were included in the study for both years (2016 and 2018). Short-period stations as well as some broadband stations have been ruled out of this study due to the unavailability of data resulting from communication issues or because instruments were out of order.
All 11 seismic recording stations are surface stations which have been installed on shallow concrete slab vaults and built on different types of soils, depending on each location's geological features. Table 1 shows soil characteristics for each station.
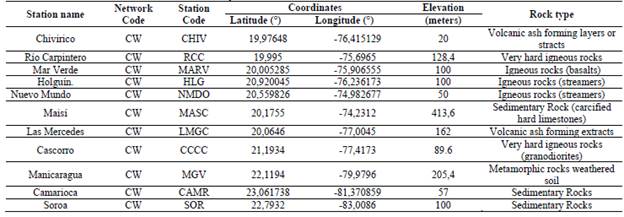
Deployed equipment includes broadband sensors, namely, BBVS-60s and BBVS-120s seismometers (Chinese technology, Geodevice), [4] and Trillium Compact 120s, Trillium 120PA, and Trillium 120P seismometers (Canadian technology, Nanometrics) [5]. Data were recorded using 24-bit resolution digital converters EDAS-24IP (Geodevice) [4], Taurus, and Centaur (Nanometrics) [5] with 100 Hz sampling frequency.
Data selection criteria for noise level analysis included seismic signals of 3-components (vertical, north-south, east-west) sensors installed in all seismic stations included in the study for the year 2016. More specifically, signal data associated to the two weather seasons in Cuba (dry and rainy season) were used to estimate seismic noise levels during both weather seasons. Additionally, 24-hr daily time series were divided into 12 hrs to calculate noise levels considering variations between day and night time. Finally, signals of the two days when two weather events hit Cuba in 2016 were also taken into consideration to assess their impact on seismic records. Besides, uncalibrated sensors affected some stations' performance.
Signal processing followed McNamara and Buland's approach for noise studies [6], and the PQLX software (PASSCAL Quick Look eXtended) [7] was employed for noise power quantification and calculation of noise probability density for different band frequencies. Other researchers in earlier noise studies for regional and global networks [8-13] have successfully used this method to estimate ambient seismic noise. Therefore, this signal processing method is considered most suitable for this study.
An earlier study for the Southern Alaska Lithosphere and Mantle Observation Network [14] used McNamara and Buland's methodology for spectral analysis, using Modular Utility for STAtistical kNowledge Gathering (MUSTANG) to assess quality of seismic data through the Incorporated Research Institutions for Seismology (IRIS) website [15].
A similar process was conducted with seismic data from all 11 stations of the Cuban network for the year 2018.
2. Observational data
First, 1-yr seismic traces for each station and their corresponding frequency responses by the measuring channel were selected. Second, data were processed using PQLX software for the calculation of the Power Spectral Density (PSD) and the Probability Density Function (PDF) for a statistical analysis of noise levels.
Resulting seismic noise power levels were graphically plotted using the software. Peterson's NLNM (New Low Noise Model) and NHNM (New High Noise Model) standard models [16] were used for comparison of the records to these standards in order to assess noise signals at different period intervals during which seismic signal is recorded.
Also, with the plotted graph it was possible to estimate the noise probability occurrence through the calculation of the Probability Density Function. In addition, for a broader analysis, other parameters such as the statistical mode and curves representing the minimum tenth and ninetieth percentiles of noise occurrence are also plotted in the graphs.
Recorded signals of earthquakes, power glitches and/or power consumption peaks are included in our processing because they are considered low-probability occurrence events. These signals are shown in the graphs as power spectral density curves with low probability of occurrence. Such events have no negative impact on noise levels [6].
3. Results and discussion
3.1. Annual noise behavior
Datasets relevant for this study were selected and processed using the PQLX software. PSD and PDF curves were obtained for a 1-yr period at each station to determine period intervals with higher noise levels and probability levels of occurrence in time.
It is important to note that data recorded at MARV (Mar Verde) station only include the months from September to December, provided that it was not previously installed.
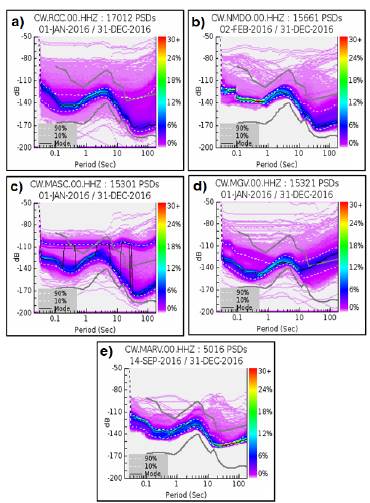
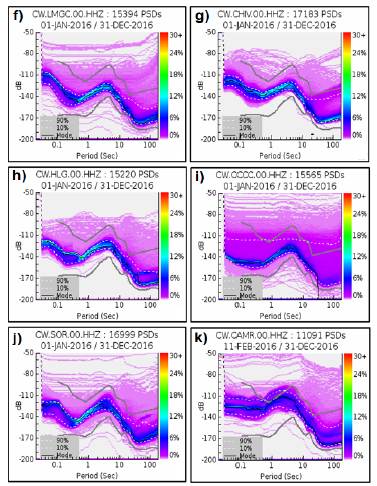
Figs. 2 and 3 show 2016 PSD curves for vertical components at 11 stations within the Cuban National Seismic Network (CW code), namely, RCC (Río Carpintero), NMDO (Nuevo Mundo), MGV (Manicaragua), MASC (Maisi), MARV (Mar Verde), LMGC (Las Mercedes), CHIV (Chivirico), HLG (Holguin), CCCC (Cascorro), SOR (Soroa) and CAMR (Camarioca) stations. As shown in Figs. 2 and 3, every station shows noise levels with low probability of occurrence during most of the time interval of interest, except for NMDO for periods < 1 s, MARV for periods >10 s, and LMGC, CHIV, HLG for periods <4 s, where the probability of occurrence of noise throughout the year is remarkably higher as compared to other band periods. However, seismic noise level is above -140 dB of acceleration power in almost all stations.
Source: The authors.
Figure 2 PSD acceleration curves (Y axis) and PDF (color scale) for the vertical component of a) RCC, b) NMDO, c) MGV, d) MASC and e) MARV stations (annual variation).
Source: The authors.
Figure 3 PSD acceleration curves (Y axis) and PDF (color scale) to the vertical component f) LMGC, g) CHIV, h) HLG, i) CCCC, j) SOR and k) CAMR stations (annual variation).
This is influenced by anthropic noise in the areas surrounding the stations. Additionally, the action of the wind over the abundant vegetation together with terrain irregularities of Cuban topography, also cause high-frequency noise which, added to cultural noise, result in high noise power levels at short periods.
Seismic noise generated by the action of the ocean is present all over the globe, although it is observed most strongly along the coast and is weaker near the middle of continents [17], and it is known as marine microseism noise. There are to two types of marine microseisms: primary microseisms and secondary microseisms.
Primary ocean microseisms are generated in shallow waters or shallow waters in coastal regions, where wave energy is converted directly into seismic energy either through variations in vertical pressure or smashing surf on the shores [18].
Primary ocean microseisms have a period of about 10 to 16 s, just as the water waves. Secondary microseisms, on the other hand, are generated by the superposition of ocean waves of equal period travelling in opposite directions, thus generating standing gravity waves of half the period [18].
In the intermediate period interval, marine microseisms occur mainly in the secondary peak, also with a high probability of occurrence. This is due to the influence of ocean waves affecting the entire Cuban archipelago. In addition, this is reported, to a greater or lesser extent, for all stations, except for MGV and CCCC stations. This may be associated with the geographical distribution of these stations, which are the most distant from the coast as compared to the rest of the stations studied.
Furthermore, for the CAMR station, noise power levels are high at the period band when noise is produced by marine microseisms. Noise behavior at this station will be discussed further on.
At long-period intervals (>20 s) PSD vertical components reach values similar to the NLNM standard in all stations, except for MGV and MARV stations. Particularly interesting are high values found for the MGV station which are above NHNM levels, thus confirming the behavior of signal recordings in the station. These records show a high low-frequency component, possibly resulting from the presence of tunnels, or the functioning of some equipment in a military area very close to the station.
Of all stations examined, CCCC stands out as a station with a good performance in terms of seismic noise level. Over the entire period range, a very low probability of occurrence of noise power distribution was observed. In addition, mode curve values were close to the NLNM standard, mostly below -140 dB.
This may be explained by the fact that CCCC station was built inside a tunnel, thus reducing background noise levels and protecting it from the effect of cultural noise, as the location is far away from human settlements, roads or industries. Unlike the rest of seismic stations, CCCC is the one located more distant from the coastline, which reduces ocean microseisms noise levels.
After making this analysis and to determine average noise power levels for each station, monthly average power spectral density was estimated and plotted. Fig. 4 shows that these values are approximately between -120 dB and -145 dB, except for SOR station in December, where PSD average value decreases drastically.
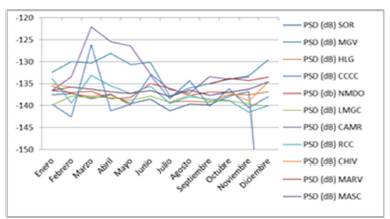
As shown in Fig. 4, most of the stations' PSD values ranged between -135 dB and -140 dB (about 5 dB of difference), which suggests that yearly average power variation is not significant. However, this is not the case for CAMR and MGV stations. MGV exhibited values of -135 dB for the months from March to June. CCCC station showed values above -130 dB in March.
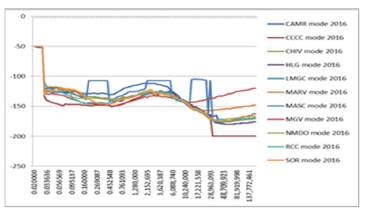
Furthermore, PSD mode estimates for each station over the entire frequency band range were plotted, showing a similar behavior in almost all stations (Fig. 5).
3.2 Diurnal and nocturnal variations of PSDs
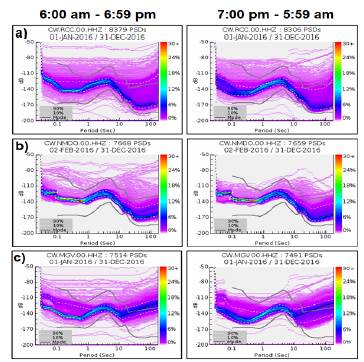
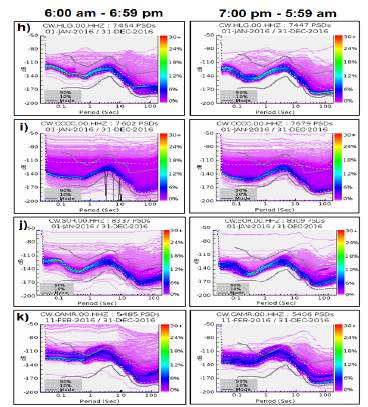
In this section, we analyze how day and night time variations affect noise levels at each seismic station during 2016. Figs 6, 7, and 8, show power values for noise signals obtained from the data representing day time hours (6:00 am - 6:59 pm). Graphs on the right represent night hours (7:00 pm - 5:59 am).
Source: The authors.
Figure 6 PSD acceleration curves (Y axis) and PDF (color scale) for the vertical component of a) RCC, b) NMDO and c) MGV stations (day/night variation).
Source: The authors.
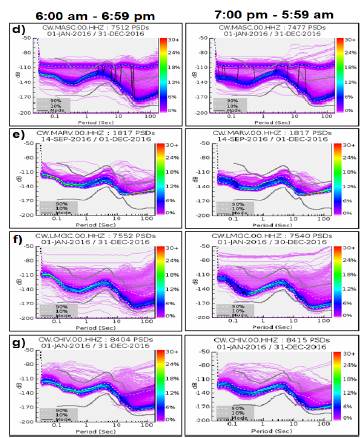
Figure 7 PSD acceleration curves (Y axis) and PDF (color scale) for the vertical component of the d) MASC, e) MARV, f) LMGC, and h) CHIV stations (day/night variation).
Data suggest, as is the usual case, that anthropic activity generates noise peaks during daytime hours for high-frequency components in the frequency band of interest.
This is not the case of NMDO station, which did not show significant day/night variations of noise power, precisely because the station is located near Nuevo Mundo dam, just 5 km from a large area where mining is carried out 24 hours a day.
It can also be concluded that during the night, short period noise is less likely to occur as compared to day time for the same period band (<1 s).
In contrast, marine microseisms and low frequencies bands show no significant day/night variation. Microseism peaks keep almost the same amplitude and probability of occurrence because they depend on atmospheric conditions on the sea and the natural movement of the Earth.
At long-period bands, HLG and CAMR are the only stations showing some kind of variation between both schedules (daytime and night time), probably due to specific local conditions. The other stations exhibit little variation.
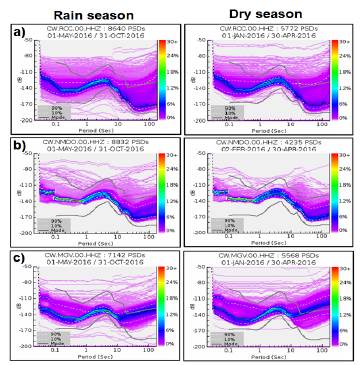
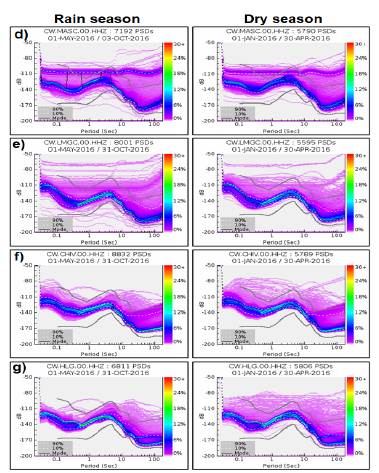
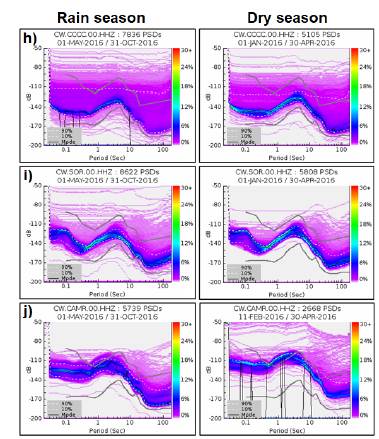
3.3. Effect of seasonal changes (rain and dry periods)
According to the Instituto Meteorológico de Cuba (Cuban Meteorology Institute), Cuba has a warm tropical climate with average annual temperatures ranging 22-28 degrees Celsius for most of the country.
Seasons can be broadly divided into a dry season (from November to April) and a wet season (from May to October) [19].
During the dry season, completely clear days are more frequent, although average temperature is slightly lower. Due to Cuba's proximity to North America, cold fronts with heavy rains, rough seas, and gusts are not unusual in this season, although they are not as frequent [19].
In the rainy season, average temperatures, rainfall and humidity rates rise. Precipitations (1,400 - 1,600 mm) might seem high, but they are only the result of strong and short-lived showers [19].
Based on these characteristics of Cuban climate, PSD and PDF values for the stations in this study in both seasons were computed to observe the impact of seasonal variations on noise levels behaviors for each case.
Analysis of PSD values (Figs 9, 10, and 11) for the stations evaluated in this study, suggest that seasonal variations do not significantly affect noise power levels. PSDs showed similar values both for the dry and the rainy season. Only MGV station exhibits a slight difference during long-period bands, but it remains practically the same. There are also some non-relevant differences in the probability of occurrence of noise, as shown in the graphs between both times of the year.
Source: The authors.
Figure 8 PSD acceleration curves (Y axis) and PDF (color scale) for 1he vertical component ofthe h) HLG, i) CCCC, j) SOR, and k) CAMR stations (day/night variation).
Source: The authors
Figure 9 PSD acceleration curves (Y axis) and PDF (color scale) for the vertical component of a) RCC, b) NMDO and c) MGV stations (seasonal variation).
Source: The authors.
Figure 10 PSD acceleration curves (Y axis) and PDF (color scale) for the vertical component of d) MASC, e) LMGC, f) CHIV and g) HLG stations (seasonal variation).
Source: The authors.
Figure 11 PSD acceleration curves (Y axis) and PDF (color scale) for the vertical component of h) CCCC, i) SOR and j) CAMR stations (seasonal variation)
3.3.1. Impact of extreme weather events on seasonal noise level (Mathew Tropical Storm)
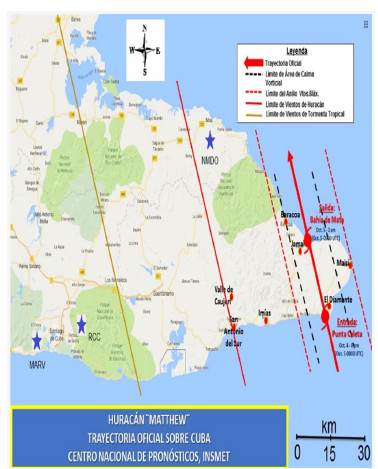
Hurricane Matthew was the only tropical storm that directly impacted Cuba in 2016. This tropical storm made landfall in Eastern Cuba on October 4, during evening hours (7 pm - 8 pm), near Punta Caleta, Guantanamo province, as strong category 4 hurricane in the Saffir-Simpson scale. It had sustained winds of 220-230 km per hour and heavy rainfalls, according to the Cuban Meteorology Institute reports [16].
The map on Fig. 12 shows Matthew's path map. Represented with blue stars are the seismic stations closest to Mathew's route (RCC, MARV and NMDO), which were operating that night and of which there is available data.
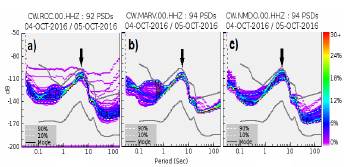
Hurricane Matthew impacted these stations by increasing noise power levels above -140 dB between the periods 0.1 -20 s. In addition, marine microseisms noise power climbed primarily due to rising waves and sea levels throughout the south and northwest coast of Cuba's eastern region, resulting in PSDs that reached Peterson's NHNM standard curve.
Fig. 13 is a plot of PSDs and probability estimates (PDFs) for the vertical component of RCC, NMDO, and MARV stations during October 4 and 5, 2016. The arrows indicate the peak of noise power observed.
Source: The authors.
Figure 13 PSD acceleration curves (Y axis) and PDF (color scale) for the vertical component of a) RCC, b) MARV and c) NMDO stations affected by hurricane Matthew (black arrows indicate maximum noise peaks due to marine microseisms).
Likewise, Fig.13 shows a high noise probability of occurrence (over 30% for MARV at longer range of periods) and PSDs close or equal to Peterson's NHNM.
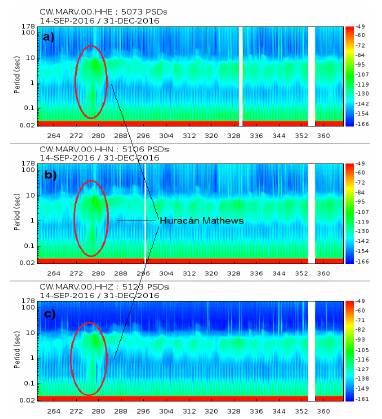
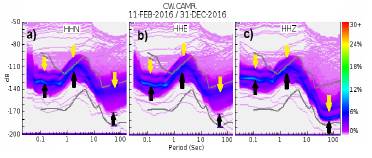
Similarly, Fig. 14 is a spectrogram of the 3-component signals (HHN, HHE, and HHZ) for the MARV station. Graphs clearly show an increase of noise levels between 0.1s -10s on Julian day 280, which corresponds to October 4, 2016.
Source: The authors.
Figure 14 Spectrogram for MARV station during Matthew hurricane, from top to bottom, a) HHE (East/West component), b) HHN (North/South component) and c) HHZ (Vertical Z component). PSD of acceleration (color scale), Julian days (X axis).
In the area indicated with a red oval, an increase in PSD level is observed at night and early in the morning when the Matthew hurricane occurred. This result is consistent with previous estimates of noise probability occurrence.
3.3.2. Influence of cold fronts on seasonal noise levels
On a synoptic scale, major weather events during the first months of 2016 included the presence of winter weather systems, such as cold fronts, the emergence of cold air at low latitudes and short-wave troughs in the lower and middle troposphere [16].
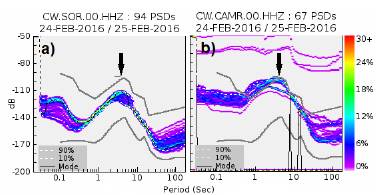
The influence of cold fronts on seismic noise was similar to that observed for the tropical storm referred to above, as in the case of a cold front that affected western Cuba on February 24, 2016. Fig. 15 plots PDFs for SOR and CAMR stations located nearest the western tip of the country.
Source: The authors.
Figure 15 PSD acceleration curves (Y axis) and PDF (color scale) for the vertical component of a) SOR and b) CAMR stations affected by a cold front. (Black arrows indicate maximum noise peaks due to marine microseisms).
In both cases, PSD levels and noise probability occurrence increase, not only at microseism peak but also at periods in the range of 20 - 100 s, when noise is likely to occur due to abrupt temperature and atmospheric pressure variations that generate thermal disturbances and sensors drifts, in addition to the tilt effect caused by an additional signal component defined by trigonometric relationships.
3.3.3 Instrumental variations
Analysis of seismic noise recorded in the stations is useful for detecting and evaluating signal changes caused, among other factors, by glitches and incorrect configuration of the equipment. Signal processing before and after such changes allowed to determine whether deployed sensors and digitizers had been selected optimally; if there were no errors in their frequency response, to check if the installation of instruments was correct; and to check that there were no excessive deviations due to the tilt effect or other technical issues.
Fig. 16 is a plot of PSD values for CAMR station. It shows high noise levels after station installation with some gain in the digitizer and considering the sensitivity of the installed seismometer. The yellow arrows indicate the corresponding PSD values where an increase of up to about 15 dB in noise level was observed (above Peterson's NHNM standard curve), thus being inadmissible from the seismological point of view. The black arrows indicate PSD values associated with a subsequent decrease in the gain of the Centaur digitizer.
3.3.4 PSD Statistical Mode for 2018
For every station horizontal component during 2018, we computed statistical mode of PSD of acceleration. The result showed similar behavior in almost every station, except for CCCC station. At high frequencies, the behavior of the mode reaches the lowest PSD values at CCCC station. In the range of marine microseisms almost all stations exhibited the same noise level, although the highest values were obtained for CAMR station for the period band 0.9-2.2 s. In the low-frequency range, the station with the highest noise level is MARV, above -155 dB. Low PSD mode values are found for HLG, LMGC, NMDO, CAMR, and RCC stations.
Also, 2016 and 2018 mode values for the vertical component for all seismic station were compared. The analysis suggests that almost every station exhibited the same noise level behavior in both years for the entire frequency range where seismic signals are registered. However, MGV station shows a better performance at the low-frequency band in 2018. By contrast, MARV and CHIV stations had a noise level increase at low frequencies for that same year.
4. Conclusions
Noise occurrence probabilities vary distinctively across the range of period bands for each station, due to noise characteristics at different frequency bands. Overall, however, probability of occurrence is not too high at almost all stations over the entire period studied.
In addition, despite the high values of noise power spectral density, the curves obtained in all stations fall within the range established by Peterson's models, hence it can be concluded that all the sites exhibit an acceptable noise level in compliance with seismology permissible standards.
However, practice has shown that daily earthquakes analysis, like in the case of MARV and CAMR stations, might be cumbersome if low-energy earthquakes are analyzed.
It was found that marine microseisms peaks are clearly observed in PSD curves at all stations included in the study, provided that Cuba is an archipelago and all seismic station sites are relatively close to the coast. For the Cuban seismic network, the values obtained are in the range of about 2 - 20 seconds.
The study confirmed that cultural noise for periods shorter than 1 s at the seismic stations, is produced by man activity in the surrounding areas and by the influence of the wind over the vegetation and topographic irregularities.
It was found that cultural noise is the type of noise that most negatively affects earthquake analysis in the Cuban seismic network, since low-magnitude local earthquakes signals occur in the period band 0.05 - 1 s. The network detects mainly this type of earthquakes.
Similarly, this research concluded that highest noise power level variations occur during daytime as human activity is more frequent during daylight hours.
It was found that seasonal variations (rainy and dry seasons) do not significantly affect changes in noise power signals and that weather events (hurricane and cold fronts) increase noise levels, mainly in marine microseisms.
Noise power of acceleration levels were similar for 2016 and 2018, for most stations.

