


 English (pdf)
 Article in xml format
 Article references
 Send this article by e-mail
 Cited by SciELO
  Cited by Google
  Similars in
SciELO
Similars in
SciELO  Similars in Google
 Permalink
1. Introduction
For decades, small and medium-sized industries in Latin America in general and in Peru in particular, have not taken advantage of the large amount of data generated by their operations. A large amount of data is simply stored without any further use. As of 2010, it is known that there are processes, architectures, and technologies capable of transforming this data into relevant data that can enable them to make profitable business operational and commercial decisions.
This set of processes, architectures, and technologies is known as Business Intelligence (BI) [1,2].
With BI, the closely related concept of data mining (DM) arises. It is a subdomain of the concept of artificial intelligence, which refers to the process aimed at generating knowledge from data and providing users with comprehensive findings [3,4].
Generation of knowledge in the context of DM can be regarded as the finding of patterns, relationships and trends relevant to the user. As a process, DM mainly involves the collection, selection, pre-processing, and analysis of data (visualization of results included), interpretation of findings and application of the resulting knowledge. Machine learning (ML) and statistical methods are implemented to pre-process and analyze the data. The type of analysis depends on the business context and type of problem to be solved [5]. With this approach, we present the following types of analyses, summarized in Table 1.
Table 1 Types of Data Analysis.
| Type of analysis | Question to answer | Result |
|---|---|---|
| Descriptive | What happened? | Information |
| Diagnostic | Why did it happen? | Knowledge |
| Predictive | What is going to happen? | Knowledge |
| Prescriptive | What should I do? | Decision |
Source: Adapted from Upadhyay, 2018.
In practice and in numerous articles, the use of BI and DM tools has yielded good results for the improvement of the commercial management of companies that have already implemented adequate management of their data. Our study presents an application in an industry where BI is not being exploited. Next, we describe the development of this study. In section 2.1, we present the statement of the problem and provide justification. In section 2.2, we present three methods that have been used by specialists for the implementation of DM, BI and Data Analysis solutions. We evaluate them and choose one of them as a reference. In section 2.3 we present our methodology for the management of electrical data in a company. In section 3, we apply the methodology and present the results. Finally, the conclusions of the study are presented in section 4.
2. Methods and materials
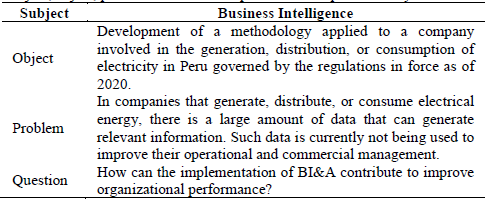
2.1 Problem Statement
We can summarize our approach as follows. In companies that generate, distribute, or consume electrical energy, there is a large volume of data resulting from their operations that can generate relevant information. Currently, such data is not being used to improve their operational and commercial management.
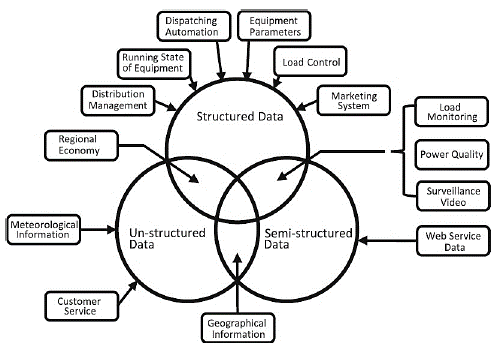
For example, to support our approach, ref. [6] showed different data sources in an electrical network that indicate the existence of a large amount of data that can be used for decision making.
Fig. 1 shows that there exists data from the monitoring of electrical load and energy quality within the group of structured and unstructured information. These data are relevant for adequate management of the electricity supply, both for generators and distributors as well as for consumers of electricity. This is because it has an impact on the economic aspect and on the adequate use of the equipment.
Likewise, in [7], it was stated that the latest generation power systems require the implementation of smart grids (SG) at all levels (generation, distribution, and consumption). These networks have high device connectivity owing to the increasingly accepted use of the Internet of Things (IoT). Such high availability of connections and the permanent exchange of data generates a large volume of data that requires techniques to help conduct adequate analysis for making timely decisions [8].
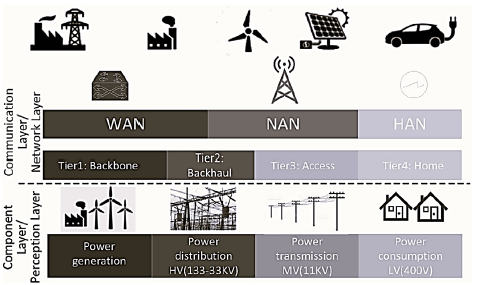
In [9], it was shown that from the point of view of telecommunications, all the data of an electrical system are derived from three communication networks and "can be mapped into Home Area Network (HAN), Neighborhood Area Network (NAN), and Wide Area Network (WAN)" [9], as shown in Fig. 2. The HAN includes wireless devices, electronic meters, gateways of homes or medium and small industries. The NAN includes the parts of the distribution networks: disconnectors and totalizing meters. The WAN includes gateways between networks of generator control centers, main transmitters, and electronic meters of large industries.
The development of smart grids in Peru has been linked to improvements in energy efficiency. This is evident from the improvements in terms of energy efficiency and from legal initiatives that have been proposed. For instance, in 2010, initiative 4335 proposed the promotion of smart electricity grids as a method to increase efficiency in the electricity system. This was intended to optimize the monitoring and control of electricity consumption, promote greater use of renewable energies and distributed generation, and grant users' greater benefits for lower or equal cost [10].
There is an interactive energy efficiency system (SiEE) in Peru, where it has been reported that since 2017, public electricity distribution companies (EDES) must develop investment plans in innovative technologies that improve the efficiency of distribution networks and implement pilot plans for the installation of smart meters. Additionally, transition proposals from traditional grid architectures to smart grids have been shown [11].
In [12], the authors stated that the challenge for Peru is to propose the inclusion of smart grids as an important objective for the competent authorities of the electricity sector, change the regulatory framework, promote research, and include consumers in the development of knowledge regarding the benefits of smart grids. In this paper, we adhere to these ideas.
The inclusion of IoT in the industry, has been explained in [13] and mentioned in [14]. It involves interaction or communication among devices that generate massive data, thus requiring control and management strategies to derive greater benefit from them. Such strategies can be implemented and a large amount of data can be processed and used quickly and efficiently.
The aforementioned statements support our assertion of the existence of a large amount of data (big data) at all levels of the electricity business. Next, we present some solutions related to data analysis in companies in the electricity sector that highlight the importance of these applications.
In [15], the relevance of data analysis and machine learning for non-intrusive load monitoring (NILM) has been discussed, allowing adequate control of the electrical energy consumption of critical equipment in residential, commercial, and industrial facilities.
In [16], the use of data analysis for the management of a photovoltaic system was shown. Using advanced data analysis applications (machine learning and statistical techniques), the authors have obtained important conclusions.
In [17], experts from all relevant organizations and institutions, including academia and industry, met to discuss big data analysis applications for energy systems. They concurred that becoming a data-based electrical company is inevitable in the era of the internet, cloud storage, smartphones, and distributed resources. Furthermore, the analysis of advanced data involves ongoing innovation, which is plausible by unlocking information that has not yet been processed, while advanced big data analysis results in the conclusions of estimation, prediction, diagnosis, and forecasting of historical and real-time data flows. This can provide more refined information on planning network operations.
Along the same lines as stated in the previous paragraph, energy monitoring systems have achieved savings in energy billing between 15% and 35% according to feedback (visualization is indirect or direct), as shown in [18]. In energy monitoring systems, energy consumption is visualized and data analysis algorithms are used to examine the behavior of different devices in a residence,
Hence, it is evident that in electricity generation, transmission, and among distribution companies and electricity users (residential, commercial, and industrial), there is a large amount of data with the potential to generate valuable information for decision-making. Therefore, developing solutions in this area of research is a current trend that can also generate significant savings in maintenance and operation management for all companies in the sector, from generation to end users.
BI is a system that allows users the possibility of converting data into information. As defined by the Data-Warehousing Institute, business intelligence or BI includes "tools, technologies, and processes required to turn data into information and information into knowledge and plans that optimize business actions" [19].
The extraction of valuable information and discovery of underlying data patterns allows BI to make fast and effective decisions for different organizations [20]. Therefore, companies that manage electricity should not be an exception.
A very interesting issue is presented in [21], stating that Business Intelligence and Analytics (BI&A) is mainly a subfield of decision support systems (DSS), which aims at converting more data into a thorough vision but by severing its link with the founding literature by DSS.
DSS are information systems that aim to improve decision-making based on data analysis [18]. The interesting aspect of such an approach is the fact that, by regarding BI&A as a subfield of DSS, gaps and research opportunities in the field of BI&A arise, which can utilize the foundational concepts of DSS.
For this reason, in this study, we propose a methodology to develop a BI solution in a Peruvian electricity generation, distribution, or consumption company that can help improve its operational and commercial management by considering the regulations in force in 2020.
In Table 2, we show the summary of our approach.
2.2 Existing methodologies - background
In this section, we present four methodological antecedents available for the final deployment of a solution that fits our requirements.
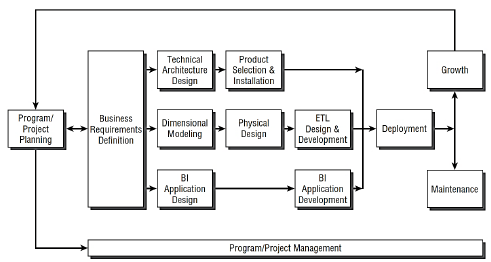
The first methodology, generally accepted in the industry as one of the best practices, is the Kimball life cycle raised in [22], which follows a general doctrine to focus on business value, collaborate with the company and develop incrementally.
The roadmap of this methodology is shown in Fig. 3. The first step is the definition of business requirements, followed by parallel developments. On one hand, the design, development and deployment of the BI application must be supported in an adequate dimensional modeling of the data. On the other hand, a physical design as well as design and development of an ETL solution (data extraction, transformation, and loading) is required. Kimball's approach is very robust, but in our opinion, it can be simplified depending on the characteristics of the solution we are looking for, even more so when it is applied to a small or medium-sized company.
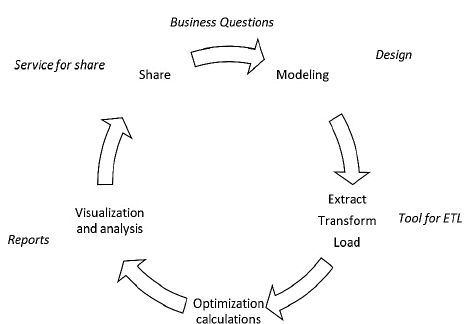
Another methodological alternative is the one proposed by Ramos in [23]. The steps outlined in Fig. 4 are logical and are in accordance with our objectives. These coincide with the first methodology regarding defining the business questions and as they are exclusive steps for the deployment of BI solutions, there are no parallel processes. We must specify that in the "modeling" step, the method refers to the modeling of the data.
Another methodology introduces two additional closely related concepts: business analytics (BA) and data mining (DM).
The subtle difference between BI and BA is stated in [19]. Both terms are used interchangeably because they provide similar challenges in terms of implementation and adoption. In addition, the same article regards business intelligence as an umbrella field covered by business analytics, such that business analytics results in an important aspect of business intelligence, as stated in [24].
Also, in ref. [24], data mining (DM) is regarded as the process of "knowledge discovery", which exists in the data base and can be of used in decision making. Thus, data mining provides insight into past and present scenarios and helps comprehend possible future results that can supply effective outcomes and assist in discovering unknown facts present in the database.
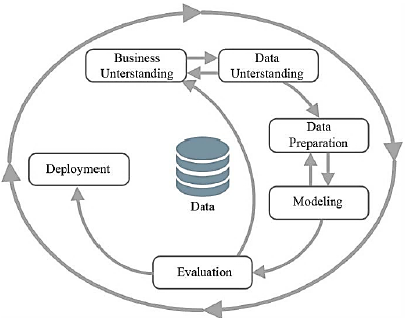
In 1996, for the development of a DM solution, four leaders of the emerging DM market conceived the "CRISP-DM (Cross-Industry Standard Process for Data Mining)" [27] model, as a generic, documented and free access model that allowed organizations to achieve better data mining results and promote best practices in the industry [25,26].
Fig. 5 shows the phases of a DM process, proposed by CRISP-DM, in which the six phases are as follows: "understanding the business, understanding the data, data preparation, modeling, evaluation, and deployment" [27].
The authors in Ref. [26] have provided an explanation for Fig. 5, in which the sequence of steps and the interrelation between them can be observed. Additionally, the cyclical nature of the process is represented by the large ellipse. This indicates that after some solutions have been identified based on the knowledge found, new solutions can be generated from the previous discoveries.
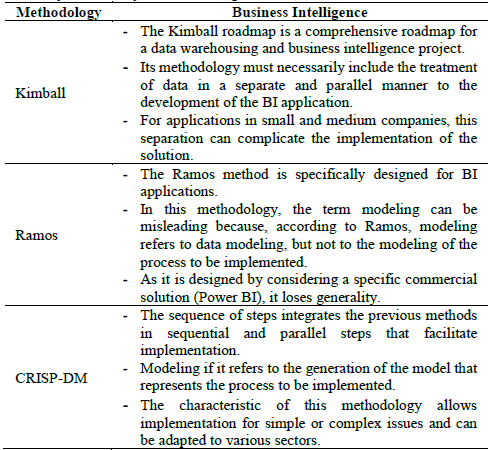
The objective of our study is to find a method to implement a business intelligence framework that can be applied to electricity companies or electricity users, especially for small or medium-sized companies. Using this criterion, we have evaluated the three methodologies, as shown in Table 3.
2.3 Methodology used
Considering the CRISP-DM method as a reference, we have included an additional step prior to preparing the data. This is because it is useful for the target companies to be informed about this type of analysis and to define the data model prior to finding the process model to be applied. The following is a methodology based on [26].
2.3.1 Step One: understanding the business
In this step, it is necessary to understand the objectives of the project from the perspective of the company. It is then necessary to translate these objectives into data-mining objectives and develop a preliminary plan or strategy to be used.
The results of this phase can be used to clarify the objectives, define the problem, the preliminary plan and the strategy to be followed.
2.3.2 Step Two: understanding the data
In step two, we start with acquisition and familiarization with the available data. We must detect data aligned with our initial objectives and identify poor-quality or irrelevant data. "The data understanding phase involves four steps, including the collection of initial data, description of data, exploration of data, and verification of data quality" [25].
2.3.3 Step three: defining the type of analysis
This step is the contribution of our original methodology. In this step, we understand the business through the questions that we intend to solve and understand the data (describe, explore, and verify). We must define the type of analysis to be applied to solve the issues raised.
By explicitly defining the type of analysis, we adequately prepare the data in the next stage.
According to [28], the following types of analysis can be performed:
Descriptive: Usually performed in the beginning phase of the analysis to achieve a thorough comprehension of the shape and patterns of the data. It focuses on discovering "what has happened". The typical processes include segmentation, clustering, and classification. Descriptive analysis is widely used in analysis of the behavior of parameters or variables, supplying an efficient means of comprehending the behavior of several variables and creating specific actions for each segment of variables rather than for the entire system. Regarding the accuracy and performance, descriptive analysis algorithms are the most natural.
Diagnostics: Diagnostic analysis, which is sometimes combined with descriptive analysis, evaluates correlations. Diagnostic tests are often complex, resulting in more valuable information. However, the correspondences are not successful at convincingly demonstrating causality by machine learning algorithms because the correspondence is only based on the limited learning dataset used. Information resulting from descriptive and diagnostic analyses is commonly regarded as retrospective, as it mainly pertains to past occurrences. Unlike descriptive analysis, diagnostic analysis attempts to answer, "Why did it happen?"
Predictive: Predictive analysis uses past information to comprehend the probable incidence of the future and focuses on answering the question: "What will happen?". Complex models and machine learning are vital for performing inductive reasoning.
Prescriptive: Prescriptive analysis provides information regarding the steps that can be taken to intensify the probability that a desired result will occur, i.e., "what should I do?". However, this is the most difficult analysis. Predictive and descriptive analytics are now more frequent than they were previously. Technological advances in software and hardware allow for more elaborate analysis. There are also many highly digitized data sources around the world and with the advent of IoT. Such factors, together with expanding improvements in software and hardware, imply that significantly greater data is available for analysis than in the past.
2.3.4 Step Four: prepare the data
Once the type or types of analysis to be conducted have been defined, step four involves all the required actions to construct the final dataset or the dataset (that would enter the modeling tool) from the initial raw data. This step involves actions such as selecting tables, records, and attributes as well as the conversion and cleaning of data for the modeling tool. Normally, there are five steps in data preparation: data selection, cleansing, construction, integration, and formatting.
2.3.5 Step Five: modeling
Here, several modeling techniques are selected and applied and their corresponding parameters are calibrated to optimal values. Normally, several parameters exist for the same type of data-mining issue. Certain techniques present specific demands in the form of data. Thus, it may be necessary to return to the data-preparation stage. Modeling stages involve the selection of the modeling technique, generation of the test design, creation of models and evaluation of models.
2.3.6 Step Six: evaluation
When the final model is defined, prior to its implementation or deployment, further assessment of the model and a review of the building of the model must be executed to guarantee that the objectives stated are properly achieved. At this point, it is vital to establish whether significant collateral problems have been thoroughly addressed. The project manager can decide exactly how the results of the analysis will be used at the end of this step. The main steps include the evaluation of the results, review of the process, and determination of the next steps.
2.3.7 Step Seven: implementation
At this point, the knowledge acquired must be organized and presented in such a manner that it is useful to the end user. This frequently involves the application of "online" models in the decision-making process within an organization.
Based on the questions to be answered, the implementation phase could be as simple as generating a report, or as intricate as implementing a repeatable data analysis process throughout the company. It is crucial that the end user has a prior understanding of the actions that need to be taken to use the created models. Key steps within this phase are the implementation of the plan, the monitoring and maintenance of the plan, the issuing of the final report and the revision of the project.
2.4 Application of the methodology.
To apply this methodology to a specific case study, we have adopted the following steps:
Raw data were obtained from the production files of the generating company for one plant and the data were reviewed and pre-processed to select an adequate model. In this case, the methodology was applied to specific objectives, but the objective was to validate whether the steps could be followed.
• The methodology was applied to the company's available data, using Power BI for the data modeling, extraction, transformation, and loading phases.
For the transformations, the M language was used (transparent when implemented from the application interface) and new measures or columns were generated in the DAX language.
• In Power BI, the prediction models were embedded in the platform and developed in R.
Visualization was also developed in Power BI. Evaluation of the results was performed.
• The hardware used for the development of this study had the following characteristics:
• Processor: Intel (R) Core (TM) i7-9750HF CPU @ 2.60GHz 2.59 GHz.
• Installed RAM: 16.0 GB.
• System type: 64-bit operating system, x64-based processor.
• Operating System: Windows 10 Home Single Language.
3. Results and discussion
As a case study, we have focused on an agro-industrial company that requested an analysis of the quality of electricity supply.
3.1 Step One: understanding the business
The company is a seed-processing plant that works 24 h a day. To manage its electricity supply, it operates with its own generator set during peak hours. The following objectives were set for this study:
3.2 Step Two: understanding the data
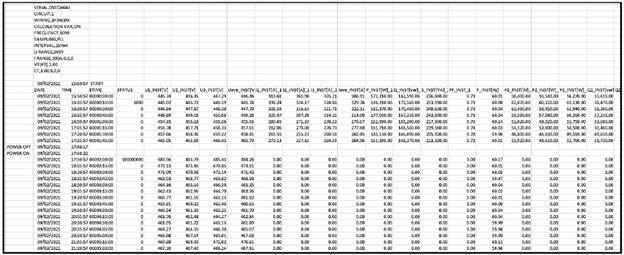
The data were obtained from a network analyzer that reported electrical parameters such as voltage, current, power, flickers, and harmonics. These parameters were measured every 15 minutes for 1 week. The data was in the source format. See Figure 5.
3.3 Step three: defining the type of analysis
According to the characteristics of the business and the objectives sought, two types of analysis were carried out: descriptive analysis and prescriptive analysis.
The description showed us the behavior of the main electrical parameters involved in the evaluation of the quality of the electrical supply.
The prescriptive analysis provided recommendations to improve behaviors that affected the quality of energy and raise the cost of energy billing.

Source: The authors.
Figure 6 Screenshot of data transformed after cleaning, ordering, transformations, and calculations.
Source: The authors.
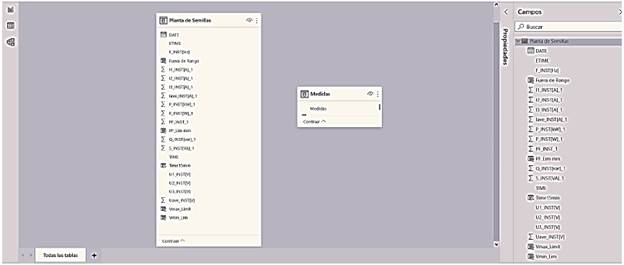
Figure 7 Screenshot of data model does not require relationship between tables - A measurement table was generated.
3.4 Step Four: prepare the data
Once the types of analyses to be applied were defined, the data required transformations (elimination of columns, creation of calculated columns, and combination of columns). A single-table data model was loaded, which was ultimately a time series. See Figure 6.
Modeling of the data in this case was not very complicated because it included a table with the measured parameters and tables of calculated measurements. This can be observed in Fig. 8.
3.5 Step Five: modeling the data
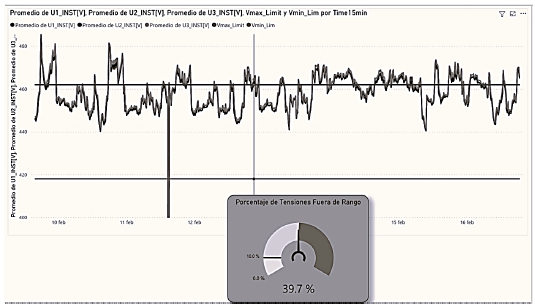
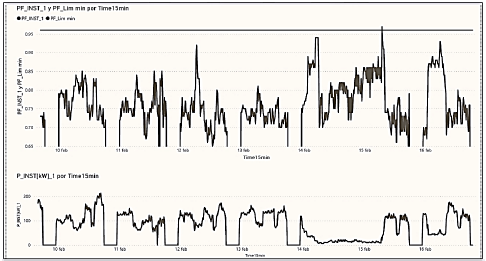
Descriptive analysis was carried out using diagrams such as those shown in Figs. 9 and 10.
Fig. 9 shows several instants of time with a voltage value above the maximum permissible limit by standard (+5% of the nominal voltage) plotted with the upper horizontal line. Likewise, the percentage of time intervals with voltage out of range is almost 40%, which is quite high.
Fig. 10 shows that the power factor in the whole measurement is below the minimum limit that avoids payment of compensation for reactive energy consumption.
Hence, descriptive analysis allowed the diagnosis of problems of poor voltage quality and inadequate reactive power consumption.
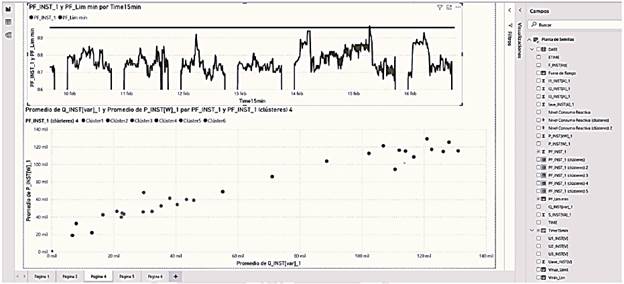
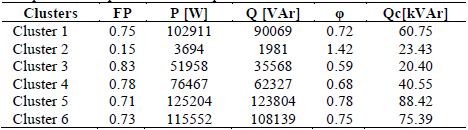
In these cases, the prescription is to verify positions of the transformer TAPs and calculate a bank of capacitors to compensate for the high consumption of reactive energy. A more in-depth prescriptive analysis, such as that used in [29], proposes a selection strategy for the steps in a capacitor bank. Fig. 11 shows the results of the description of the behavior of the power factor and, in the lower graph, the result of the application of a clustering model of the power factor with six clusters.
3.6 Step Six: evaluation
The visualizations generated using the processed data model for descriptive purposes allowed us to answer the initial questions. The quality of the electricity supply was unacceptable. It is shown that the tension has many values above the maximum limit of 5% required by the Peruvian quality standard. In addition to being out of range, these values may cause damage to electrical equipment. Therefore, immediate correction is required.
Likewise, it is shown that the power factor is below the economic operating limit (0.96), indicating that during the entire period analyzed, the reactive energy consumption has exceeded the limits, and therefore, they are being billed.
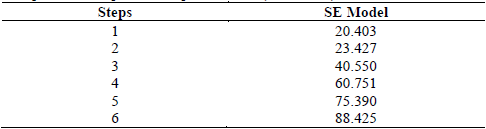
By applying a clustering model, we can prescribe a 6-step capacitor bank, which is more effective than a conventional one-step fixed bank. Observing Table 3 with the results, we can define a bank with the theoretical steps shown in Table 4.
Source: The authors.
Figure 11 Screenshot of the clustering of active and reactive power consumption according to the Power Factor to 6 Clusters.
3.7 Step Seven: implementation
The implementation in this case involves the presentation of these results in a report that shows the findings and implementation of the prescriptions made: movement of the TAPs of the transformer to adjust the voltage, as well as the installation of a bank of capacitors in six steps.
These steps must be adjusted to commercial steps. Through calculation using averages and maximum powers where a 120 kVAr capacitor bank is prescribed, the capacitor is inferred to be oversized and can cause overvoltage when operated in a single step.
4. Conclusions and recommendations
This study presents a framework based on business intelligence to solve the issues of an electricity business: an agro-industrial consumer of electricity.
The processing and analysis of available data generates useful and relevant information for decision-making.
This shows how the implementation of BI&A contributes to better management of the quality of the electricity supply and, therefore, better organizational performance.
This is accomplished by:
Visualization of the operating parameters. This allows us to control and adjust them to the correct parameters that do not cause damage to the equipment and operations.
Using clustering to determine the optimal bank of multistep capacitors that avoids overcosts and equipment damage due to high reactive power consumption.
The computational tools used can be developed with medium-cost desktop hardware and free software. Therefore, they can be implemented by both medium and small companies.
Likewise, conventional multitariff meters can provide this information online, allowing these tools to be applied in real time.
A minimum knowledge of modeling, data analysis and the sector is required to identify and transmit the findings and recommended prescriptions to management departments of the companies.
The contributions of our work may be summarized as:
Although the use of BI&A is widespread nowadays, the definitions, theoretical frameworks, and taxonomies do not exist with a solid and clear base as the DSS does, this study uses definitions from the current literature.
Although in most cases, BI tools are applied to commercial issues, the present work shows that they can also be applied to power supply management solutions.

