


 English (pdf)
 Article in xml format
 Article references
 Send this article by e-mail
 Cited by SciELO
  Cited by Google
  Similars in
SciELO
Similars in
SciELO  Similars in Google
 Permalink
1. Introduction
Today, it is urgent to mitigate the sustained growth of CO2 emissions in the atmosphere, which causes irreversible climate change. The limited consent for the community is 450 parts per million, which implies a temperature rise of 2°C above the pie-industrial temperature. For the concern in the medical field and the control of gas emissions (between CO2), as well as in the field of research, as well as in the study of energy and environmental sustainability. In this sense, different policies and agreements such as the Kyoto Protocol are proposed. Of the combination of methods available in the state of the art, the improvement of Energy Efficiency is the one that has the greatest impact in this context. This implies more progressives in manufacturing technology, and the efficient use of resources to guarantee the longest possible life and improvements in technical efficiency [1-4]. In this context, energy efficiency is understood from the supply side. Energy efficiency on the demand side implies a change in the consumption habits of users, which is difficult today [5-8]. For this reason, there is a sudden increase in the energy transition time that refers to the substitution of one type of source for another. However, the question arises: Is the massive insertion of renewable energies the most sustainable way? This work seeks to partially answer this question. To do this, if you present in this article a level of description and survey of the data of three types of renewable sources: Wind, Solar and Biomass. This is in order to use them in future work in relation to this problem, [9-11].
The work is presented as follows, in Section 2 the aim of the work are presented. In the Section 3 the main used variables and parameters are showed. Section 4 shows the definition of the Energy Returned On Investment and its calculation. In the Section 5 the present method is described. In the Section 6 the simulation of the model are presented and described. Finally, Section 5 presents the conclusions of the work.
2. Aim of this work
Firstly, a comparison of methodologies available in the 'state of the art' about the energetic evaluation profitability of renewable generation was presented. This was done in order to incentive the optimal exploitation, operation and expansion of systems distribution networks in medium and short term. In fact, the 'Energy Returned on Invested' (EROI) is the best estimator for measuring the obtained energy performance. Moreover, the difficulties for this determination to be solved were discussed. The work presented here seeks to emphasize, as a proposal, the advantages of dynamic systems analysis. A small development of mathematical model was made.
3. Used variables
k corresponding year [year].
PT [k] Total installed capacity of the system analyzed.
Psi [k] Installed power sector i.
Pg [k] Installed Power in Generation Industry [MVA].
ΔTSi [k] Production [TN] Materials Industry i.
NT k] Total population.
NSi [k] Assigned Population in Sector i.
tp [k] Overall growth rate of population.
tMyF [k] Growth in mining production and fossil.
Ipub/Priv [k] Investment growth rate in public or private sector.
IR [k] Growth rate of investment in renewable generation.
IA [k] Investment growth rate in remediation of environmental impact.
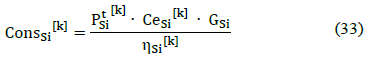
CISi [k] Energy consumption in production of sector i [MVA/Tn].
GSi [k] Consumption of materials in production of Sector i [MVA / TN materials].
FUGi [k] Utilization factor in generation i.
FUDi [k] Utilization factor in demand sector i.
ImpSi [k] Total imports in the sector i.
BalSF [k] Balance between extraction and consumption of materials.
Agi Allocation factor of the generation sector.
Asi Allocation factor of the sector i.
RPSi [k] Allocation factor of the Investments in the sector i.
RN si [k] Allocation factor of the operators in Si.
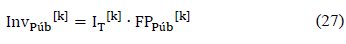
FP Pub [k] Participation Factor of Public Investment.
FP Priv [k] Participation Factor of Private Investment.
4. Energy returned on investment
According to thermodynamic laws, 'energy' cannot be created or destroyed, but will be able to be transformed. The transformation refers to generation energy conversion process performed by a machine, where the energy source of interest is transformed into another type of energy that is useful. In any energetic transformation, energy losses exist and they are associated to irreversible process as thermal, chemical, electromagnetic, etc. Thus, these energy losses are not considered as useful and do not provide to the obtained energy. In order to carry out and sustain the process of energy transformation it is necessary to invest energy to create and maintain their infrastructure, energy supply and inputs, plus the corresponding performance inefficiency. Considering the decline and eventual depletion of fossil resources, it is important to know the amount of useful energy obtained from a source of a certain generation and destined for investment, and the index that analyzes these aspects is called 'Energy Returned on Invested (EROI).
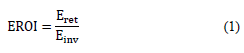
Where E ret is the net 'Returned Energy' and E inv is the energy invested in the process. In the state of art, the Availability of methods is extended; this works discussed some proposed models of index. Some of them are useful when it is required to make comparative studies of similar projects and assess the technological evolution of the resource in question. Nevertheless, they are inefficient to compare different categories of energy resources. Some generation types were discussed, developed and well-known belonging to the energy matrix: Hydropower, Nuclear Power Plants and Fossils [1-4].
4.1 Energy returned on investment estimation by life cycle assessment
In this section, the EROI estimation by direct analytical calculations will be exposed. This estimation consists in solve the equation from the definition, evaluating the energy invested in machinery Em and equipment Ee used to the exploitation of renewable resource:

In this equation two parameters are difficult to estimate, on the one hand the influence limits concerned to the energy invested, and on the other hand, the adopted criteria used to determine energy efficiency, social and environmental impact. Regarding the former, the calculation not only depends on construction and operation of various equipment used in the extraction and exploitation of the energy source, but from the production chain up to the mineral extraction. Also it refers to spending on transport and equipment and electrical thermal, hydraulic nature, etc., energy losses. At present, energy flow is dynamic; there is an increasing demand exponentially, technological advances at accelerated rates, and more rigorous regulations seeking to minimize environmental impact. This increases the difficulty of proposing a fixed rate and the same information about system parameters considered, requiring additional information. Consequently the discussions held so far are insufficient to draw conclusions to make satisfactory decisions that allow optimization of Energy and Environmental Sustainability. The 'Life Cycle Assessment' (LCA) allows a design, research and evaluation of a production process and associated environmental impact during the energy resource operation. The objective is to assess the potential environmental impact throughout their life cycle by quantifying the use of resources. The procedure is as follows: initially system limits are set, and then various subsystems losses are measured, making corrections in power quality. After that, the energy and monetary economic conversion is performed, and finally statistics obtained are analyzed. Inputs such as energy, raw materials, new machinery and the desired output are defined environmental emissions are, in this case the CO2 emissions [5-8].
5. Dynamic system modelation method
5.1 Energy returned on investment estimation by dynamic system modelation
It is considered how the system inverts without renewable source  and how it invests
  . Similarly, the demanded energy during the scenarios considered and for the resource in question was studied. Thus, the error was eliminated considerably, and then, the latent energy in the system was excluded, respect of the energy invested in renewable source production.
The biggest advantage of working with energy flows is the direct calculation of energy savings obtained, with the consequent reduction of emissions. By implementing this methodology, an incentive regulation scheme, you can set the sanctions to be applied by the regulator at the failure of the distribution company in concept of Energy Efficiency. Among the difficulties of this methodology, the distortion of the index due to the introduction of analysis of monetary flows can be mentioned. As a result of this aspect, the index obtained hinders the ability to compare to other economic areas and the possibility of referring to a standard index. Also it is difficult to contrast between different renewable sources, i.e. nuclear vs. solar, wind, etc. There is subjectivity in the environmental impact monetization caused by greenhouse emissions of CO2 and methane (referred to as gases in CO2 equivalents). There is a poor consideration of the Economic Costs of Electrical and Environmental Quality expansion plans and exploitation, on the basis of attributes that have no direct economic value, because there is no market associated with them. In addition, the competitive penetration of renewable generation is not permitted because of the high production costs required. Moreover, non-renewable depletion sources costs are not recognized. As a result of this analysis, it would make it impossible for the alternatives implementation to mitigate emissions, and encouraging the continuous search for technological innovations.
Fig. 1 shows the Life cycle of a system according to the various sectors.
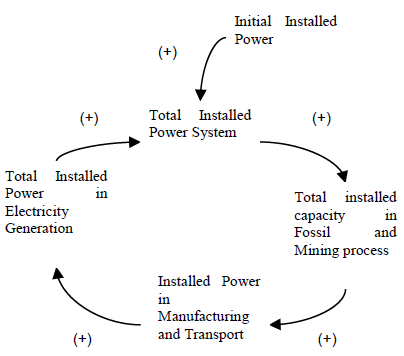
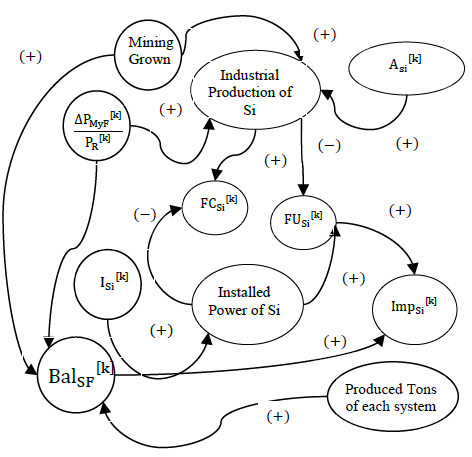
Fig. 2 shows the Causes Tree of Proposed Model.
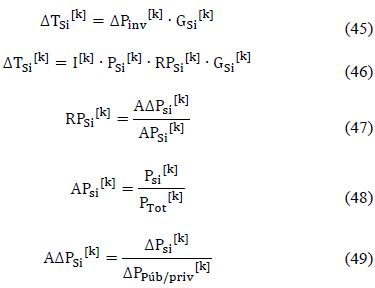
The technological renovation required in this case is high, and a low value of EROI decreases the incentive and produces uncertainty, hampering investments in technology. Considering factors which studies the reserve installed power designated to maintenance, reparation and emergencies backup, charge and use factors were analyzed:
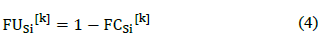
In this work, a reserve factor was considered: part of the installed capacity will be used to replace defective machinery, or may not be available for maintenance. From this expression, if the utilization factor is positive, we have an 'Idle Capacity'. If the idle capacity is high, this affects the deterioration of equipment and increased emissions at the time of 'Start Up'. Otherwise, there would be an overload which would cause premature aging of equipment, and reduced service life. Both effects involve an increase in net energy invested to obtain the desired useful energy in terms of maintenance and renovation of equipment that increase energy expenditure. Following this reasoning, it makes sense to translate all processes in electricity [MWh], which is the useful energy [2].
Then, the power system Ps [k], the installed power generation system P[k], Installed capacity of industrial demand Pi [k] and Industrial power demand Pdi [k] are [2]:
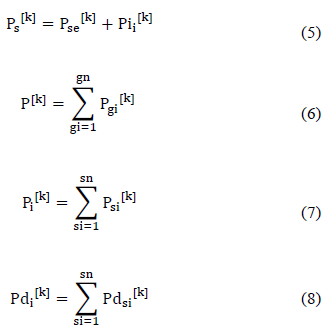
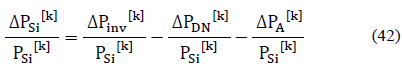
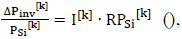
The installed capacity of the electrical system Pse [k] corresponds to the sum of stages of Generation, Transmission and Distribution; to avoid confusion not corresponding to this sum equation is written. Analyzing the distribution of installed capacity and demand, it is able to have an idea of the level of development of the system that influences the responsiveness to increases in long-term demand. The further the development, the greater the technological foundation for building a larger amount of renewable generators, otherwise energy costs caused by transport are increasing. The level of development in research is crucial because technological advances can reduce the number of intermediate steps to produce an intermediate input, replacing manageable materials more easily and therefore EROI will be higher. An increase in production from renewable sources and installed power has an impact on the involved sectors installed capacity, whose results will be affected by the level of development in technology of renewable generating interest as it is required to build technological base or a drastic increase in transport costs. The growth in installed capacity of the system will depend on increased investment, while growth in power demand is proportional to the extraction of mineral and fossil resources as will be seen later. For residential power demand exponential adjustment was made, considering the following trend:
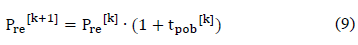
Where [k] is the corresponding month analyzed, Pre is the residential demand. It is considered that the growth of industrial demand depends largely on the growth of mining exploitation and fossil resources. The minning demand Pi[ +1] and total system power demand Pts [k] are:
While losses depend quadratically on the surrounding power lines, power system configuration and electrical equipment installed. Whereas the electrical system overload causes losses above the normalized values, and that their increase has a quadratic relationship, net losses will be. It can be approximated as follows.
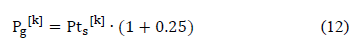
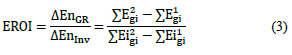
Analyzing two stages, the first with the current generation (6) of renewable energy and the second with a percentage increase, the EROI index will be obtained as follow:
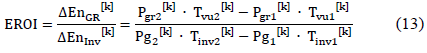
Where Tvu [k] and Tinv [k] are respectively the lifetime of the renewable resource and time investment in manufacturing this source, from extraction of resources to its operation. For their energy profitability, increasing renewable generation must exceed expenses generation, which is mainly influenced by lower electrical losses when performing a distributed generation [2].
5.2 Curve adjustment specific fuel consumption and performance
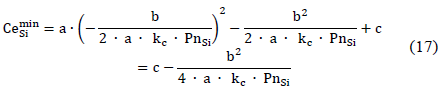
In order to estimate the tons of fuel used for generation based on fossil resources and thus estimate the demand growth thereof, an approximation of the characteristic curves of the same was done. The curve of specific fuel consumption for generators using fossil resources can be approximated by a parabola - shaped convex:
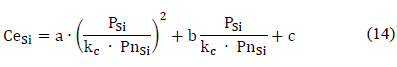
Where kc is a factor that takes into account the minimum specific consumption that occurs for lower installed power, according to this if PSi = kc * PnSi
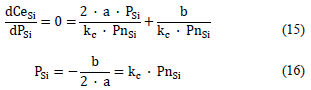
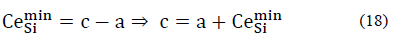
Replacing PSi in and solving the variable CeminSi:
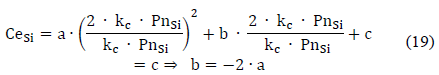
Solving for B and replacing
Whereas the curve is symmetrical, so PSi = 2 Kc Pnsi then CeSi = c.
Then replacing C and B (68)

Then CeSi is:
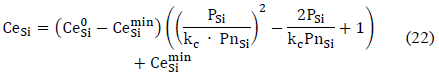
Similarly to the yield curve will be:
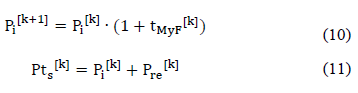
About these expressions, quadratic relationship between the specific consumption and total return energy  can be deduced, in terms of power. The minimum consumption for 80 % of the rated power of the piece of equipment, and if it is considered 10 % of rated power in reserve, the optimal FC is 0.72 for the fossil sector. The cost of materials installed 'Capacity i' consider the balance of extracted resources and materials used.
5.3 Population growth
For simplicity, it is considered that the population growth is not fed back by external variables such as industrial development relationship and the birth rate. The behavior of society has certain inertia and therefore trends would remain unchanged until decades after major changes in economic development. However, external factors, as the growth in the percentage of use of useful water available, would limit the residential and industrial growth. Today, water use in Argentina is about the 10%, it means that the population and industrial production could grow up around five or six times taking into consideration glaciers and nature reservoirs, and an excessive deterioration of water available. The population growth was adjusted exponentially according to the following expression:
Where the rate of population growth depends on the birth rate, mortality rate, immigration and emigration rate.
5.4 Growth technology investment total
Total investment in installed capacity is distributed in the public and private areas, and the development in the investment on renewable energy. [11]. Although companies may be public, private and mixed, in this work the private sector is considered as the extraction of mineral and fossil resources, manufacturing and transportation. In order to know the effects on the system to an increase in available capacity, the renewable sector is studied individually. The growth rate in total installed capacity is:
Growth in the Public Sector Investment Technology:
Growth in Private Sector Investment Technology:

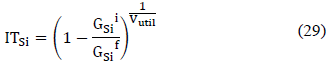
Whit the purpose of reduce the production chain or extend the life of the final product, the energy efficiency involves the continuous improvement in the production of machinery and equipment, requiring sustained investment in research and development. It seeks a reduction in spending of inputs Gsii to GSif and therefore is necessary technological research. G is the average expense ratio of materials concerning the installed power [TN / MW]. Then the technological innovation is as follow:
5.5 Investment power energy
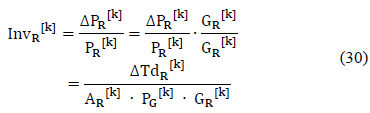
Investment in the sector of renewable generation is:
Therefore the necessary production demanded in [TN]:

Demand for materials necessary to expand the fossil generation will be:
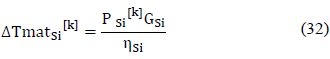
Where GmatSi in [Tn Materials / MW installed] are tons of materials needed for 1MW of installed capacity. Fuel consumption of fossil -based power plants, coal or nuclear resources depends on the total (thermal, mechanical, electrical) performance, effective power supply and the specific consumption. Tons of oil needed depends on the ratio of [Tn Oil / fuel Tn].
Where PSit[k] is the effective thermal power without considering heat loss, losses and mechanical CeSi in [𝑡/𝑀𝑀𝑀𝑀ℎ] is the specific consumption of fuel and GSi in [TEP/Tn] tons of oil are needed to produce one ton of fuel.
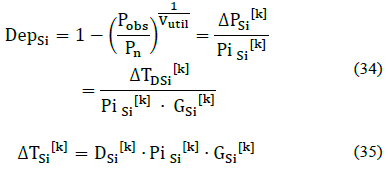
5.6 Depreciation of installed power sector i
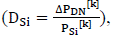
Every plant extraction, production or generation has a certain useful life and therefore a rapid deterioration which is accelerated in case of misuse of the equipment or lack of maintenance. Part of the installed power is used to replace obsolete machinery, the depreciation rate DSi and its tons, are determined as follows [5]:
The variable used to evaluate depreciation was the load factor, and depreciation would be minimal when the system is working with the nominal power of the machinery equipment, and this will increase when there is an overload or obsolete piece of equipment. Preventive and corrective maintenance of it helps to preserve them; replacing the defective or the ones with an advanced life would produce an extension of the life of the piece of equipment. After the life of the product, the piece of equipment is send to specialized companies to clearing and recycling. Therefore recovery rates and maintenance of installed power were determined. Recycling involves a decrease in demand for mining and fossil resources and an improvement in the balance of imports to equal increments of installed capacity. Therefore Depreciation Net Installed Power Sector i with maintenance and recycling of materials will be:

The factor FRes takes into account the reuse of machinery and pieces of equipment that have served part of their life, or recovery of such materials. The factor Fman takes into account the preventive and corrective maintenance. Both factors include the repaired or replaced equipment (depreciation of installed capacity) and materials used in the maintenance as each sector.
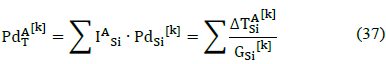
5.7 Installed power equipment and materials used in environmental impact remediation
It is the sum of the installed power equipment and materials used in the remediation of analyzed environmental impact in each sector. In the case of industries, this corresponds to effluent treatment, solid and dangerous waste and gaseous emissions [9].
Any technological investment required to comply with regulations and laws is taken into account for the environmental and social impact to be as small as possible. It is considered that the renewal and recycling of pieces of equipment are analyzed in the previous section.
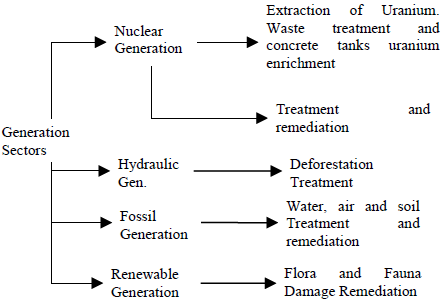
Fig. 3 shows the generation sectors: renewable, fossil, hydraulic and nuclear.
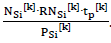
5.8 Equivalent installed power industry population i [MW]
The production may be faced by facilities operated by operators under review. This is possible in much of the industry that does not require great complexity in the management of its raw material, or products that are easy to manufacture. Automation has the advantage of greatly increasing the efficiency of the productive sector, but increases investment in pieces of equipment resulting in increased cost of materials. The allocation factor of operators in the ‘Sector i’ is:
The allocation factor increased operators to ‘Sector i’ is:
The growth of available operators in the ‘Sector i’ is:
If AΔNSi[k]=ANSi[k] then growth in staff available will be distributed in uniform manner across sectors analyzed. The power available in largely handled work by plant operators is:
Where the factor Peq is the operator equivalent power, it is considered a manual standard process.
5.9 Power Nominal growth of a sector i
The growth of the installed capacity of a given sector would depend on the allocation of the proposed investment as private or public. In this work, for the renewable generation, the growth rate is the same. In the proposed analysis, extraction sectors fossil resources, manufacturing and industrial trucks are associated with the private sector, while the sectors to the national grid and generation are linked to public investment. The growth of total investment in the ‘Sector i’ without considering the managed plants in their largely by operators:
Considering non-automated facilities, the growth of total investment in the ‘Sector i’ is:

The increase in installed capacity depends on investment in the ‘Sector i’
 net depreciation
 the investment in remediation of environmental impact
 and the workers intended Peq
5.10 Increased Installed capacity installed capacity growth allocated to the sector
The increase in installed capacity in a sector involves the manufacture of new equipment, planning and execution of new works of expansion or construction. The material flow [TON] is calculated as follows:
Where the conditionRPSi [k] = 1 if it is invested when the installed capacity increases. Else, the condition RPSi [k] = 0 if such investment is assigned to another sector. The criterion was defined as the overloaded sector, according to the type of investment. The sectors corresponding to extraction Mining and Fossil, manufacturing and transportation are considered in private investment, while the corresponding electrical system and transport investment is considered public investment. Investments in renewable generation and technological innovation are taken apart to simplify the analysis. The installed capacity corresponds to the industrial and civil transport, where the transport sector is responsible for 60 % of oil consumption in terms of tires and auto parts in turn 82% of the production of C0 2. Industrial and residential determines fleet transport capacity available, the first is determined by industrial growth, this is the mining and fossil growth, the second by population growth. The installed capacity in the automotive industry is proportional to the tons of materials used in the production and supply chain. Statistics indicate the trend of per capita car, so it is considered that the growth of this sector corresponds to population growth. The installed capacity in the automotive industry is proportional to the tons of materials used in the production and supply chain.
5.11 Growth of electric power sector mining and extraction of fossil
Mining and fossil production is adjusted by an exponential function Gaussian, as total reserves estimated T, deviation о years and period in which σ. peak production is reached [8].
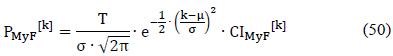
Therefore the growth of mining and production fossil is:
Faced with a decline in production system resources are saturated, being unable to meet demand and therefore some goods or equipment be excluded from the productive sector.
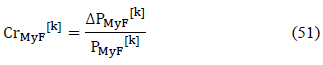
5.12 Growth of imports/exports:
It is the difference between the inputs growth from the exploitation of fossil resources and demanded production to sustain growth estimated

This term is referred to the difference between the growth of inputs from the exploitation of fossil resources and demanded production satisfied by the restrictions on installed capacity.
Where the variables PdsSi [k] and ΔPdsSi [k] take into consideration the demands of the sector i, considering the capacity installed in them. In order to avoid these oscillations gradual increases are recommended in the production of renewable energy and caution in anticipation.
5.13 Allocation of installed capacity in generation
The allocation of generators dispatch is performed according to the current energy matrix, the goal is to make a transition from fossil generation to renewable, this is to increase renewable allocation Agr and decrease the allocation of fossil generation Agf. The central dispatch is performed according to the proportion of demand that it faces, being centrals of base or peak, plus fixed and variable costs of generation.
It is easy to see that the sum of the allocations is unity.
Whereas Agn and Agh are constant, then we obtain:
The transition to renewable generation requires large-scale production and therefore an endorsement of the energy sector should be addressed. It becomes meaningless if the backup is the generation based on fossil resources and therefore it must be resorted to nuclear or hydroelectric generation. In the case of hydro generation should aspire to small plants in order to minimize environmental impact and construction. Although a dynamic model can be performed in order to analyze the influence of all the factors, there is a difficulty in accurately determining each, depending on the scenario that is envisaged. The knowledge of the system response to the massive penetration of renewable sources is uncertain; deterministic modeling is inefficient to this problem which can be solved using fuzzy dynamic modeling.
5.14 Growth model installed and production capacity
A causal diagram of the growth model is presented in the Fig. 4. Si is the sector i, depending on the item being analyzed. The main factor influencing the production system is the availability of fossil resources whose extraction curve follows a trend called 'Hubbert Peak Theory'. Therefore, it is acceptable to consider that the growth sectors of extraction of fossil resources and mining are the main factors that determine the growth of the system. No feedback on them is assigned as the currently available extension stocks are searched in order not to accelerate premature exhaustion.
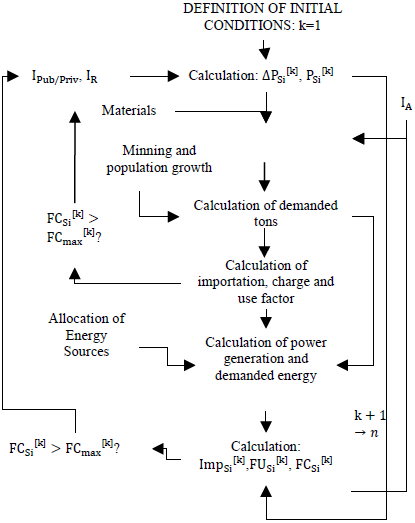
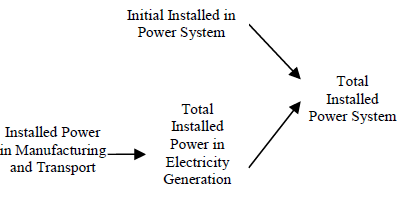
A flow chart of the model described below is presented in the Fig. 5, first the initial conditions [TN] production, installed power in [MW] defined initial population. Then it proceeds to calculate the increase in installed capacity by investments in each sector of the system, according to the criteria of load factor. It can be calculated production increase needed to cover the manufacture, installation, maintenance of new production facilities, expansion of power supply and generation. actual production in fossil resources system is calculated and extracted a balance between extracted resources, necessary resources is done to meet the demand and production capacity installed, thus determining the export / import of materials. From stage [k], the installed growth rates and demanded of the production sector are determined, thus obtaining the installed power, demanded and demanded satisfied. Defining a rate for excess or deficiency of demand, net imports are obtained. Residential energy consumption growth is determined. Power Demand Growth Power System (with losses).
6. Simulation and analysis
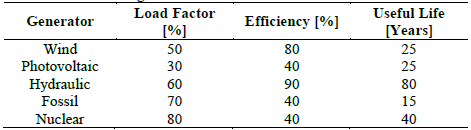
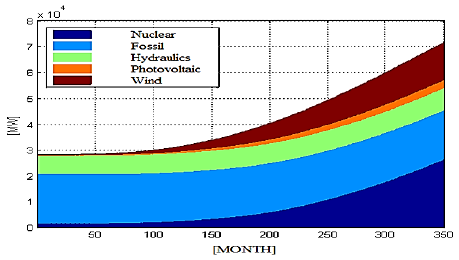
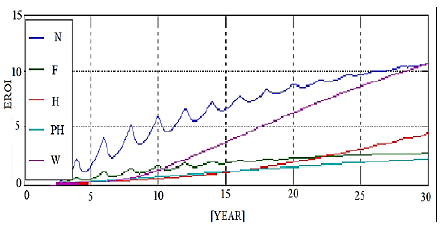
Table 1 shows the technical parameters of the generators used. Many additional parameters are used, which cannot be included in the present work. The load factor, efficiency and useful life are presented. It is observed that nuclear and wind generation have good values, which would justify a good EROI. In Fig. 6, the composition of the Argentine electrical matrix is presented, assigned by means of a multiobjective optimization model. It is observed that nuclear and wind generation were given priority, due to their good EROI. The growth of the installed powers is exponential, according to the dynamic models. The EROI values are graphed in Fig. 7, where the respective growths for each generation source are observed.
Source: The Authors.
Figure 7 Energy Returned On Investment by Nuclear (N), Fossil, Hydraulic, Photovoltaic, and Wind generation source.
It is observed that the best generation sources are nuclear and wind generation. Peaks are observed, a product of energy consumption in the different stages of the production system, which produces some noise in the EROI curves.
7. Conclusions
In order to know the impact produced by a 'large-scale renewable resource production' referred to energy / 'environmental sustainability' and 'continuous search technological renovation', some recommendations and improvements in the calculation methodology of the Energy Returned On Investment (EROI) were presented. In order to avoid subjectivity in the measurement criteria, this index must be based on energy flows and not on monetary flows. Therefore, the EROI is a technical and energy index and it is not associated to economical or financial character. The study by analysis of dynamical systems is appropriate because it allows interpreting the results; it carries out the necessary corrections, and therefore, it has enormous potential in this field. This work adds the urgency to make comparative studies related to nuclear energy, even though the high environmental impact associated. Actually, this energy source is the only potential replacement of fossil fuels to supply current demand, in case of an energy collapse. Beyond that, the aim is to boost public investment; the implementation of state policies for a transition to renewable has an indirect effect on private investment. This involves the continuous search for innovation and technological improvements that increase the energy efficiency of the energy system, resulting in reduced process energy, production and maintenance costs. These improvements may be related to the reduction of intermediate stages, local production of the raw material produced, correct allocation of idle capacity, etc. The EROI would be a good addition to the evaluation of a project, which would be supplemented with other economic and environmental indices for the evaluation of it. However, there are external factors that would limit the industrial development product of a transition to EROI. First the growth of the exploitation of fossil resources marking the growth trend of industrial production. Other factors impose saturation in the system, as the percentage of use of useful water available and population growth. Among the external factors, macroeconomic issues produce uncertainty and public and private divestitures, such as the fall in oil prices. Therefore, the pressure of public or private sectors, in addition to laws and environmental regulations are fundamental pillars in this model. Among the major drawbacks of the analysis of dynamical systems, the inherent instability of chaotic systems rigs errors and divergence in the outcome. Therefore, this model requires a lot of restrictions and good accuracy the survey. It should encourage research in this field, highlighting the improvements obtained projecting the economic analysis and provides competitiveness.

