SciELO - Scientific Electronic Library Online

 
vol.89 issue221Applying hydrological modeling to unravel the effects of land use change on the runoff of a paramo ecosystemComputational Fluid Dynamics (CFD) study to optimize the auxiliary ventilation system in an underground mine author indexsubject indexarticles search
Home Pagealphabetic serial listing  

Services on Demand

Journal

Article

Indicators

Related links

  • On index processCited by Google
  • Have no similar articlesSimilars in SciELO
  • On index processSimilars in Google

Share


DYNA

Print version ISSN 0012-7353On-line version ISSN 2346-2183

Dyna rev.fac.nac.minas vol.89 no.221 Medellín Apr./June 2022  Epub Sep 14, 2022

https://doi.org/10.15446/dyna.v89n221.97552 

Articles

Evaluation of losses in electrical subtransmission networks by neural network modeling

Modelación mediante red neuronal para la evaluación de pérdidas en redes eléctricas de subtransmisión

Álvaro Laurencio-Péreza 
http://orcid.org/0000-0002-1957-6822

Igor Pérez-Maliukb 
http://orcid.org/0000-0003-2350-9718

Olga Pérez-Maliukc 
http://orcid.org/0000-0001-9763-4605

aDepartamento de Electrica, Facultad de Ingeniería, Universidad de Holguín, Holguín, Cuba. alvarolaurencio040@gmail.com

bDepartamento de Mecánica, Facultad de Ingeniería, Universidad de Holguín, Holguín, Cuba. operezm@uho.edu.cu

cDepartamento de Redes y Sistemas, Empresa Eléctrica de Holguín, Holguín, Cuba. alaurenciop@uho.edu.cu


Abstract

Determining technical losses in an electrical system is highly complex due to the large amount of information required for its evaluation. A solution to this problem is the evaluation of losses using an artificial neural network. In this work, a model for evaluating technical losses in subtransmission electrical networks was obtained by using artificial neural networks. This model considers the effective length of the circuit, the maximum apparent and active power, the resistance in the conductors and the number of clients connected to the circuit. The simulation results established a mean square error of 0.0028 and a correlation coefficient between the variables involved of 0.980. The proposed artificial neural network model resulted satisfactory for evaluating technical losses in electrical subtransmission networks.

Keywords: electric losses; modeling; network

Resumen

La determinación de pérdidas técnicas en un sistema eléctrico es altamente compleja debido a la gran cantidad de información requerida para su evaluación. Una solución a este problema es la evaluación de pérdidas utilizando una red neuronal artificial. En este trabajo se obtuvo un modelo para evaluar pérdidas técnicas en redes eléctricas de subtransmisión mediante el uso de redes neuronales artificiales. Este modelo considera la longitud efectiva del circuito, la potencia máxima aparente y activa, la resistencia en los conductores y el número de clientes conectados al circuito. Los resultados de la simulación establecieron un error cuadrático medio de 0,0028 y un coeficiente de correlación entre las variables involucradas de 0,980. El modelo de red neuronal artificial propuesto es satisfactorio para evaluar pérdidas técnicas en redes de subtransmisión eléctrica.

Palabras clave: modelación; red; pérdidas eléctricas

1. Introduction

Electricity losses or operating expenses are a concern for electricity companies, since they constitute a segment of the production process that determines, among other things, quality, from the point of view of efficiency. In the case of technical losses, also called technological expenditure by some authors, their quantification attracts interest from scientists around the world due to the complexity associated with the need to process a large amount of information that is sometimes unreliable or inaccessible.

In transmission and sub-transmission networks, the economic effect of losses is extremely significant, while, in distribution networks, they hardly compensate for the expenses necessary to collect the information required for their evaluation [1,2].

In Cuba, the rate of losses fluctuates around 15%, of which 11% corresponds to technical losses, according to data provided by the Electric Union (UNE).

For the evaluation of technical losses, many researchers rely on calculation tools or computational software such as Matlab, DIgSILENT PowerFactory, among others [3-7]. These tools are mainly based on mathematical approaches such as Newton Raphson's method, Gauss Seidel or probabilistic methods for load estimates [8-11]. These methods require an accumulation of information characteristic of the system or circuit under study, which sometimes hinders or interferes with the veracity of the data, thus affecting the precision of the results. Specialists of electricity companies and some Cuban academics, dedicated to the analysis and estimation of technical losses, rely on the Radial tool, which has been implemented by a group of academics at the University of Las Villas for the studies of circuits with radial configuration. Although it is intended to change to more up-to-date tools, the Radial tool continues to be one of the most used by researchers [12,13].

Among the technical solutions that are commonly applied to improve loss rates, is the automation or placement of intelligent measurement equipment. However, given the economic conditions in Cuba, these technologies become difficult to reach, so alternatives are used that, although financing is sometimes required, may be cheaper. These include reconfiguration of circuits, gauge changes in conductors, among others [14,15].

One of the current techniques used both to predict and model a certain behavior of losses in electrical networks is the application of Artificial Intelligence (AI) [16-18]. Among its wide possibilities is the application of artificial neural networks, which are approaches that allow modeling the learning process in a way similar to the functioning of the human brain, in essence, the ability to learn from new experiences [19].

Power losses in distribution circuits vary proportionally with the resistance of their conductors, and this, in turn, depends on the material used in their construction, their section, length and other factors such as temperature, nonuniform current distribution, circuit load, etc. All of this makes the evaluation of power losses, using formal methods, very complex. A solution to this problem is their prediction using a neural network.

2. Materials and methods

Load flow studies are highly complex due to the volume of calculation required to carry them out; even the simplest case can be practically insoluble. Among the most used variables by traditional calculation methods is the power of each load. This can present serious difficulties, since it is not always possible to know it, mainly in the primary distribution, since it would not be economical or practical to place instruments permanently in each bank of transformers. To solve this problem, the proposed calculation model uses the magnitude of the total load delivered to it, which is known in the Network Management System (SIGERE). On the other hand, SIGERE is created in Sancti Spiritus, with the purpose of improving control of the country's transmission and distribution networks. It constitutes an evolution of the Distribution Management System (SIGEDI) whose initial scope was from the 33 kV bars and the Distribution Dispatches. Several authors carry out research based on the measurements contained in this platform, demonstrating that they can be a reliable source of data [20-22].

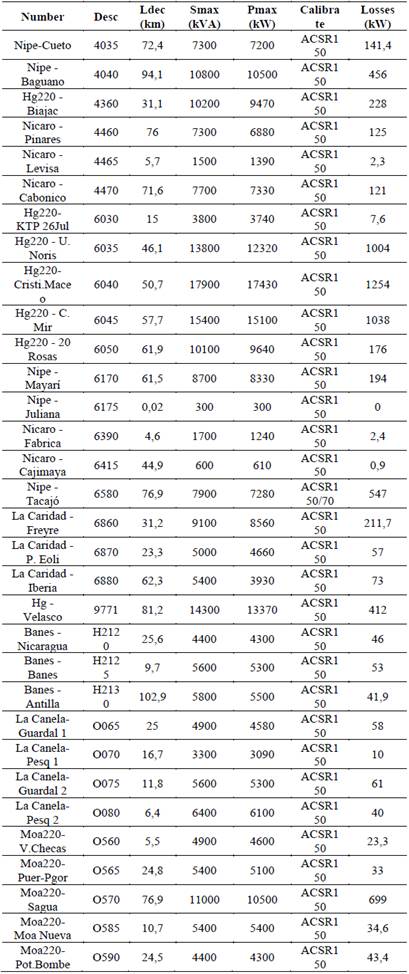
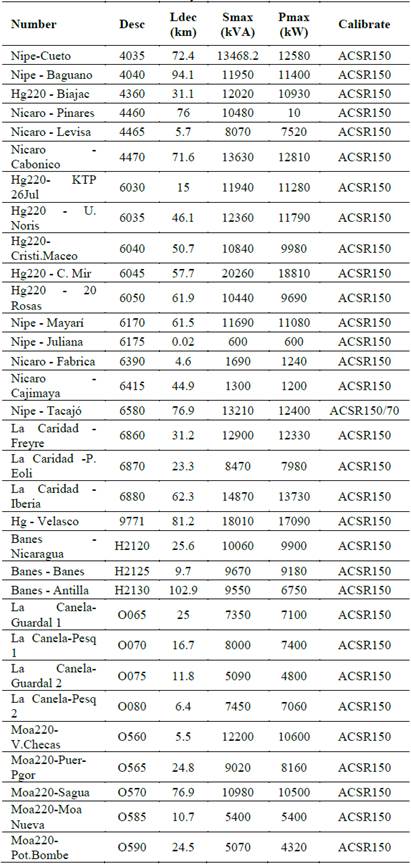
Table 1 Information of the circuits under consideration. 

Source: own elaboration.

Based on the information contained in the Network Management System, the main electrical variables involved in the field of technical losses are studied.

For this study, 32 subtransmission networks of the Holguin province are considered, whose characteristics are shown in Table 1.

The headings in Table 1 show, in the first column, the name of the circuit, while the second column shows the disconnect to which they are connected. Then, the third column to the last, correspond to the length of the circuit, the maximum apparent power, the maximum active power, the conductor size, the number of customers and the power losses, respectively, of each circuit. These values are representative for the year 2019.

The power losses, as an output variable, were taken from the information provided by the Provincial Electric Company.

2.1 Establishment of the artificial neural network

The determination of the type of neural network, the number of layers and the number of neurons in each layer that best characterizes the model, is carried out through a trial and error process in which the number of neurons, the linear regression of the variables involved and the maximum allowable error are analyzed

MATLAB makes easier for the user to develop applications using a graphical interface (GUI), through the nntool tool. The performance of the artificial neural models is evaluated using the mean square error and the correlation coefficient between the real values and those obtained by the neural network, with the idea of providing the network with an adequate number of neurons in the hidden layer, to learn the characteristics of the possible relationships between the sample data. Through the trial-and-error process and the literature consulted, the feed-forward backpropagation structure with the best results is identified [23-26].

The proposed network is made up of two layers: a hidden layer and an output layer. The output layer only has one unit, which indicates the value of the losses associated with each input vector presented to the network. The hidden layer has a variable number of neurons until the one that best fits the modeling is established. The transfer functions of the hidden layer and the output layer aie logarithmic sigmoid (logsig) and linear (pureline), respectively.

The learning method used in this work is Levenberg-Marquart.

3. Results

The constant growth in demand requires a continuous increase in generation and the construction of new lines that cause substantial changes in the configuration of the existing network. These new plants and lines are installed according to the results obtained from load flows for future needs and conditions. In this way, it is possible to see the importance of network analysis from this point of view.

This section presents the results of applying the artificial neural network model to the 32 subtransmission networks belonging to the Holguin province and demonstrating its effectiveness in evaluating technical losses in the system.

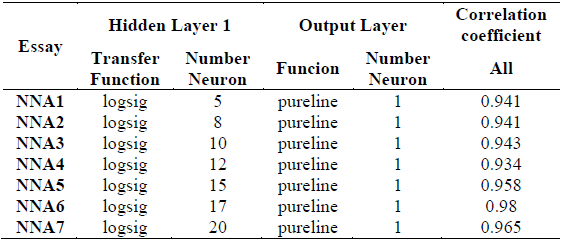
Table 2 Results of the tests carried out. 

Source: own elaboration.

Source: own elaboration.

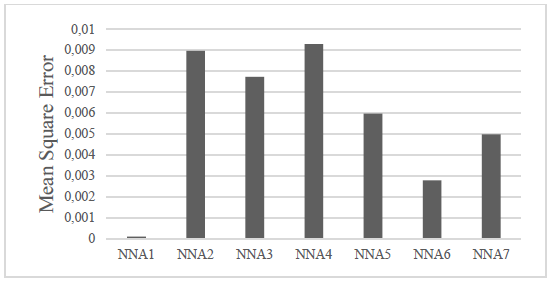
Figure 1 Mean square error of the tests performed. 

The data in Table 1 were established for the training of the neural network.

In addition, a simulation is carried out with the data of the respective circuits for the year 2020. In this way, the technical losses for this year are evaluated.

3.1 Neural network configuration and testing

For the configuration of the neural network, a series of tests were carried out in order to obtain the one with the best results.

Table 2 shows 10 of the tests carried out to obtain the network that best fits the system. The transfer functions and number of neurons of each layer are described, as well as the correlation coefficients obtained between the input variables and the output of the network.

From Table 2 it can be deduced that the NNA6 test presents the best results in terms of correlation coefficient.

The mean squared errors of the tests are shown in Fig. 1.

From Fig. 1 it can be deduced that in the NNA1 test a mean square error is obtained significantly lower than the rest of the tests carried out. Note, furthermore, that the error of the NNA6 experiment, although greater than the error of NNA1, could be considered an acceptable value.

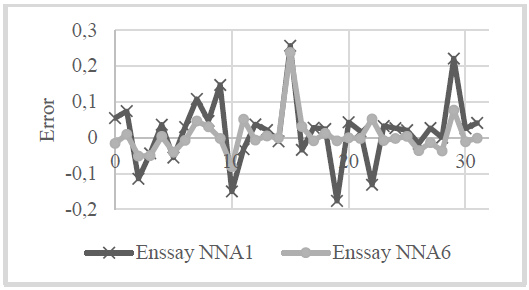
Fig. 2 describes the behavior of the root mean square errors of the NNA1 and NNA6 tests.
Source: own elaboration.

Figure 2 Behavior of the errors in the NNA1 and NNA2 tests for each circuit. 

From Fig. 2 it is inferred that the error of the NNA6 network presents a more stable behavior, so based on this and the correlation coefficient obtained, it is decided to choose the NNA network as the one that best adjusts to the data involved in the study.

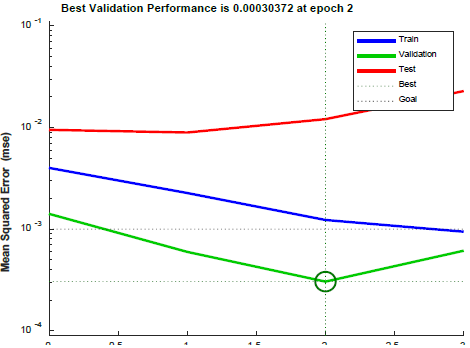
The behavior of the mean square error as a function of the epochs is shown in Fig. 3. Note that the validation obtained its best result in epoch two.

Source: own elaboration.

Figure 3 Behavior of the mean quare error as a function of the epochs. 

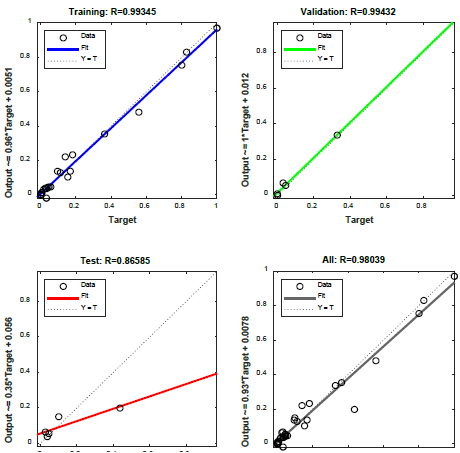
For learning the network, it chooses a set of data that is provided at each stage of learning. Fig. 4 shows the correlation coefficients obtained between the input and output variables, at each stage of network learning, belonging to the NNA6 experiment.
Source: own elaboration.

Figure 4 Correlation coefficient between input and output variables at each stage of network learning for the NNA6 experiment. 

Source: own elaboration.

Figure 5 Structure of the NNA3 neural network. 

Table 3 Variables used in the simulation for year 2020. 

Source: own elaboration.

Source: own elaboration.

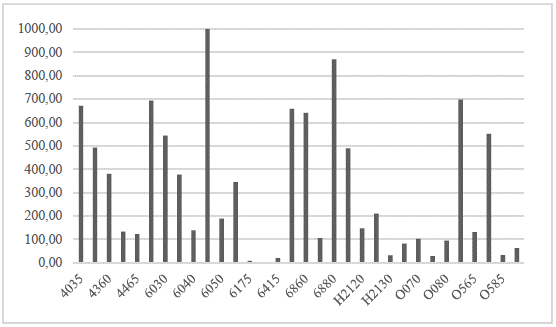
Figure 6 Power loss results for each circuit. 

Finally, it is established that the network adjusts to the information provided with a correlation coefficient of 0.980 and a mean square error of 0.0028, approximately. The established structure of the neural network is described in Fig. 5.

In this way, the network is formed with 17 neurons in the hidden layer with 4 inputs; while the output layer presents a single neuron in its corresponding output.

3.2 Simulation or testing of the neural network

After the training of the selected network based on the minimum error and the best correlation coefficient between the variables involved in the model, the circuits are tested according to the representative information for 2020. The values corresponding to this year or variables input into the simulation are shown in Table 3.

Loss results for each circuit are presented in Fig. 6, where the circuits are identified by their corresponding disconnects.

4. Conclusions

From the results obtained, experimentally, the potentiality of the proposed model in determining the losses in subtransmission networks is corroborated with a mean square error of 0.0028 and a correlation coefficient between the variables involved of 0.980.

The neural network that better adjusts to the variables implicated in this investigation is conformed by an occult layer with 17 neurons and show transference sigmoide logarithmic and a layer of linear exit.

The proposed artificial neural network model is satisfactory for evaluating technical losses in subtransmission electrical networks, and its use is fully identified with the availability of data under the conditions of the Cuban electrical system.

References

[1] Aguila, A. and Wilson, J., Technical and economic assessment of the implementation of measures for reducing energy losses in distribution systems. In: Proceedings of the International Conference on Sustainable Energy Engineering, 2017, pp. 1-9. [ Links ]

[2] Sadovskaia, K., Bogdanov, D. et al., Power transmission and distribution losses - A model based on available empirical data and future trends for all countries globally. International Journal of Electrical Power & Energy Systems, 107, pp. 98-109, 2019. DOI: https://doi.org/10.1016/j.ijepes.2018.11.012 Links ]

[3] Al-Akayshee, A.S., Kuznetsov, O.N. and Sultan, H.M., Modelling and performance evaluation of the 400kV national grid in Iraq in DigSILENT PowerFactory. In: Proceedings of the 2020 IEEE Conference of Russian Young Researchers in Electrical and Electronic Engineering (EIConRus), 2020, pp. 1151-1156. DOI http://10.1109/EIConRus49466.2020.9039271Links ]

[4] Celvakumaran, P., Ramachandaramurthy, V.K. and Ekanayake, J., Assessment of net energy metering on distribution network losses. In: Proceedings of the 2019 IEEE International Conference on Automatic Control and Intelligent Systems (I2CACIS), 2019, pp. 241-246. DOI: http://10.1109/I2CACIS.2019.8825071Links ]

[5] Gaur, B., Ucheniya, R. and Saraswat, A., Real power transmission loss minimization and bus voltage improvement using STATCOM. In: Proceedings of the 2019 3rd International Conference on Recent Developments in Control, Automation & Power Engineering (RDCAPE), 2019, pp. 236-241. DOI http://10.1109/RDCAPE47089.2019.8979110Links ]

[6] Kumar, S.I. and Kumar, V.T., Optimal integration of DGs into radial distribution network in the presence of plug-in electric vehicles to minimize daily active power losses and to improve the voltage profile of the system using bio-inspired optimization algorithms. Injeti and Thunuguntla Protection and Control of Modern Power Systems, 5, pp. 1-15, 2020. DOI: https://doi.org/10.1186/s41601-019-0149-xLinks ]

[7] Semenov, A.S., Semenova, M.N. and Bebikhov, Y.V., Development of universal mathematical model of electrical power supply system of area of industrial enterprise. In: Proceedings of the 2019 International Russian Automation Conference (RusAutoCon), 2019, pp. 1-5. DOI: http://10.1109/RUSAUTOCON.2019.8867704Links ]

[8] Korheeva, N.A., Lykin, A.V. and Atabaeva, L.S., Probabilistic and statistical method application for electric power losses calculation. In: Proceedings of the 2018 XIV International Scientific-Technical Conference on Actual Problems of Electronics Instrument Engineering (APEIE), 2018, pp. 164-167. DOI: http://10.1109/APEIE.2018.8545038Links ]

[9] Vasileva, V., Methodology of determining voltage, power and energy losses in the electrical Network. In: Proceedings of the 2019 11th Electrical Engineering Faculty Conference (BulEF), 2019, pp. 1-4. DOI: http://10.1109/BulEF48056.2019.9030758Links ]

[10] Ye, Z. ad Kim, M.K., Predicting electricity consumption in a building using an optimized back-propagation and Levenberg-Marquardt back-propagation neural network: case study of a shopping mall in China. Sustainable Cities and Society, 42, pp. 176-183, 2018. DOI: https://doi.org/10.1016/j.scs.2018.05.050Links ]

[11] Pequeno, E.D.S., Kobay, B. et al., Modified tensor method to power flow analysis. IET Digital Library, 13(17), pp. 3960-3967, 2019. DOI: http://10.1049/iet-gtd.2018.6187Links ]

[12] Medel, M. y Casas, L., Reconfiguración de la red de 33 kV para pérdidas mínimas con generación distribuida en Villa Clara. Ingeniería Energética, XXIX, pp. 62-67, 2008. [ Links ]

[13] Pérez-García, D., Garcia, F.R. y Hernández, D.E., Disminución de las pérdidas de energía eléctrica por distribución usando una tecnología novedosa de mediciones y control para la toma de decisiones. Revista Colombiana de Tecnologías de Avanzada, 2, pp. 144-150, 2019. [ Links ]

[14] Menéndez, J.R. y Iglesias, M.E.M., Disminución de las pérdidas técnicas en circuito secundario del JB-287. Avances, 21, pp. 193-207, 2019. [ Links ]

[15] Torres, W.D.J.T., Plata, G.O., et al., Reduction of electrical energy technical losses in the Metropolitan Area of Bucaramanga (AMB) using network reconfiguration based on exhaustive search. In: Proceedings of the 2019 FISE-IEEE/CIGRE Conference - Living the energy Transition (FISE/CIGRE), 2019, pp. 1-6. DOI: http://10.1109/FISECIGRE48012.2019.8984987Links ]

[16] Yinglong, D., Guodong, L. et al., A distribution Network identification of cause of line loss method based on Markov random field. In: Proceedings of the 2018 China International Conference on Electricity Distribution (CICED), 2018, pp. 2599-2603. DOI: http://10.1109/CICED.2018.8592109 Links ]

[17] Viegas, J.L.;Esteves, P.R. and Vieira, S.M., Clustering-based novelty detection for identification of non-technical losses. International Journal of Electrical Power & Energy Systems, 101, pp. 301-310, 2018. DOI: https://doi.org/10.1016/j.ijepes.2018.03.031. [ Links ]

[18] Shetty, V.J. and Ankaliki, S.G., Electrical distribution system power loss reduction and voltage profile enhancement by Network reconfiguration using PSO. In: Proceedings of the 2019 Fifth International Conference on Electrical Energy Systems (ICEES), 2019, pp. 1-4. DOI: http://10.1109/ICEES.2019.8719292Links ]

[19] Montero, D.G., Van, J.C. et al., Post-combustion artificial neural network modeling of nickel-producing multiple hearth furnace. Int. J. Chem. React. Eng., 18(7), pp. 1-14, 2020. DOI: https://doi.org/10.1515/ijcre-2019-0191Links ]

[20] De la Fé, S., Miraglia, D. et al., Empleo de redes neuronales artifciales en redes de distribución eléctrica. Revista Cubana de Ciencias Informáticas, 3, pp. 65-71, 2009. [ Links ]

[21] Dalmau, L.G. y Ríos, L.R.R., Sistema informático para la gestión la información de los esquemas secundarios en las subestaciones de transmisión. Universidad & Ciencia, 7, pp. 57-67, 2018. [ Links ]

[22] Sánchez, N.F., Comas, R.R. y Garcia, M.M.L., Sistema inteligente de información geográfica para las empresas eléctricas cubanas. Ingeniare. Revista Chilena de Ingeniería, 27, pp. 197-209, 2019. [ Links ]

[23] Sun, W. and Gao, Q., Exploration of energy saving potential in China power industry based on Adaboost back propagation neural network. Journal of Cleaner Production, 217, pp. 257-266, 2019. DOI: https://doi.org/10.1016/j.jclepro.2019.01.205Links ]

[24] Zeng, Y.-R., Zeng, Y. et al., Multifactor-influenced energy consumption forecasting using enhanced back-propagation neural network. Energy, 127, pp. 381-396, 2017. DOI https://doi.org/10.1016/j.energy.2017.03.094Links ]

[25] Thoeurn, M., Priyadi, A. et al., Overcurrent relay modeling using artificial neural network. In: Proceedings of the 2017 International Electrical Engineering Congress (IEECON), 2017, pp. 1-4. DOI: http://10.1109/IEECON.2017.8075794 Links ]

[26] Lima, M.A.F.B., Carvalho, P.C.M. et al., MLP back propagation artificial neural network for solar resource forecasting in equatorial areas. Renewable Energy and Power Quality Journal, 1, pp. 175-180, 2018. DOI: https://doi.org/10.24084/repqj16.253Links ]

How to cite: Laurencio-Pérez, A., Pérez-Maliuk, I. and Pérez-Maliuk, O., Evaluation of losses in electrical subtransmission networks by neural network modeling.. DYNA, 89(221), pp. 78-83, April - June, 2022.

Author contribution: All the authors have accepted responsibility for the entire content of this submitted manuscript and approved submission.

A. Laurencio-Pérez, is BSc. Eng. in Electrical Engineer, in 2018 and received in 2020 MSc. in Electromechanic, all of them from the Moa University, Moa, Cuba. His labor life has performed it like Electric professor of the Engineering Department of the one belonging to Moa's University, giving the subjects of study Solar Hydric Energy, Electrotechnics, Electronic Analogical and System Electric of Potency. He has accomplished investigations related with photovoltaic generation as to projection and technical cost-reducing studies between other ones, that way as in mathematical model for the evaluation of technical losses in subtransmission electrical networks. ORCID: 0000-0002-1957-6822

0. Pérez-Maliuk, is BSc. Eng. in Metallurgic Engineer in 1996, from the Moa's University, Cuba. For the year 2013 it attained MSc. in Electromechanic. Has been teacher of the Engineering Department of Moa's University. Her labor experience based on investigations in various areas of the metallurgic engineering, electromechanics and in the impartation of subjects of study like microeconomic, macroeconomic and economy cuban, bookkeeping and finance, business administration, behavior economic and entrepreneurial, between another one. ORCID: 0000-0003-2350-9718

I. R. Pérez-Maliuk, is BSc. Eng. in Electrification Industrial at Byelorussia's Technological University in 1990. In the 2000, accomplished a mastery in Systems Electric of Potency at Sao Paulo's university. Has collaborated like associate professor at Moa's University, although his bigger labor experience has acquired it at the Electric Company, performing like Principal Specialist in Engineering of Grid, Technical Adviser in Electrician's Society of Equatorial Guinea and Entrepreneurial Base's Director Unit in several municipalities belonging to the province Holguín. His scientific works fit to computational models, methodologies and optimization once different areas of the electricity like protections were applied for, the supply and energetic efficiency, between other ones. ORCID: 0000-0001-9763-4605

Received: July 30, 2021; Revised: March 15, 2022; Accepted: April 08, 2022

Creative Commons License This is an open-access article distributed under the terms of the Creative Commons Attribution License