


 English (pdf)
 Article in xml format
 Article references
 Send this article by e-mail
 Cited by SciELO
  Cited by Google
  Similars in
SciELO
Similars in
SciELO  Similars in Google
 Permalink
1. Introduction
The ventilation system is an essential part of any well-functioning underground mine, but sometimes it is difficult to manage and optimize the auxiliary circuit [1,2] due to the huge quantity of variables influencing the system. Besides this, every method of extraction and deposit has its particularities [3,4], with the evolution of the equipment having an important impact as well [5]. Therefore, it can be very difficult to determine the best option in terms of health and safety conditions in the drifts and working faces.
Computational fluid dynamics software (CFD) has been used in the last few years to determine, with high accuracy, the behavior of the underground environmental conditions, such as airflow [6], temperature [7,8] and pollutants [9,10], with the aim of optimizing and improving the working conditions in working faces [11-13] and reducing mine expenditures [14].
Moreover, the need for an optimized ventilation system has become imperative [15] due to energy costs [16], safety and health requirements [17], and recirculation [18]. The aim of this paper is to determine the best configurations in terms of duct position and auxiliary ventilation systems in working faces to remove pollutants and maintain acceptable temperatures, based on a case study; ultimately, this will help improve the environmental conditions and work efficiency.
1.1 Case study
We assessed an underground mine extracting potash and salt in the northeast of Spain. The resources are present in interlayers, at a thickness of several meters, and are extracted using a room and pillar method. The mine has a U-shape main ventilation system, with two shafts. There are also two levels, a lower one for the infrastructure and an upper extraction level. This latter has an auxiliary ventilation system with one or more fans installed in series, conducting air to each working face by means of ducts, with a total length of 200400 meters in each face. The diameter of the duct is 1 meter, and it is always placed on one side, 0.5 meters above the floor. The distance between the working face and the duct ranges between 3 and 8 meters, depending on operating conditions.
2. Model formulation
The behavior of airflow in the drift and around the equipment was simulated using the CFD software FLOW-3D to numerically solve the Navier-Stokes equations for solution domains. A standard K-Y epsilon model was used to estimate the turbulence flow in the drift.
2.1 Mathematical and numerical model
The Navier-Stokes equations are completed to study the airflow behavior. The differential mass conservation principle for stationary and three-dimensional forms at a given point is expressed in Eq. (1).
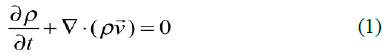
The air density is constant for the time and domain studied, giving rise to Eq. (2).
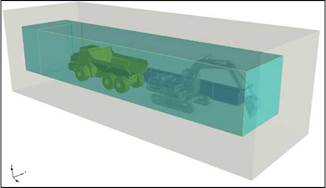
Eq. (3) represents the principle of movement quantity conservation, considering that the flow is incompressible and occurs at low velocity, and underestimating viscous dissipation. Subsequently, Eq. (4) expresses the energy in terms of specific enthalpy.

Source: Authors.
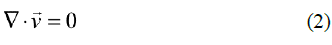
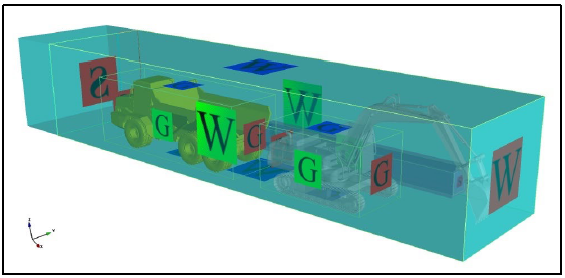
Figure 1 Global perspective of the working face model with the corresponding equipment.
Thus, the equations are discretized in an unstructured grid arranged by means of the finite volume method. Furthermore, a second-order conservative scheme is used for spatial discretization [19,20]. These schemes preserve the symmetrical properties of continuous differential operators and ensure both the conservation of kinetic-energetic equilibrium and the stability of the model of mining drift [21,22].
2.2 Geometries and computational domain
The drift model was created using a reference inertial system, wherein the x-axis represents the direction of airflow inside the ventilation duct, and the y-axis represents the normal cross-section of the flow, the normal bottom of the floor, and finally the direction of gravity, which follows the right-hand rule. Fig. 1 shows a view of the drift resulting from using typical equipment in a working face: an excavator, a truck, and the ventilation duct. A simple prismatic geometry was chosen for the modeling of the drift: a section of 6 m wide, 5 m high and 28 m long. The equipment was imported into the modeling from two files in the STL format, corresponding to a CAT excavator and an articulated dump truck, model Bell B30D.
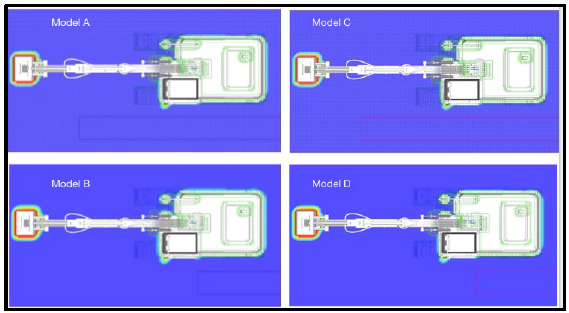
This study contemplates four different configurations regarding the location of the duct, which can give rise to significant differences in the underground environmental conditions. These configurations are shown in Fig. 2, along with the different possibilities based on the mine conditions:
a) Model A-Exhaust duct located 0.5 meters above the floor in the left side of the drift and 3 meters from the working face;
b) Model B-Exhaust duct located 0.5 meters above the floor in the left side of the drift and 8 meters from the working face;
c) Model C-Exhaust duct located 0.5 meters below the roof in the left side of the drift and 3 meters from the working face;
d) Model D-Exhaust duct located 0.5 meters below the roof in the left side of the drift and 8 meters from the working face.
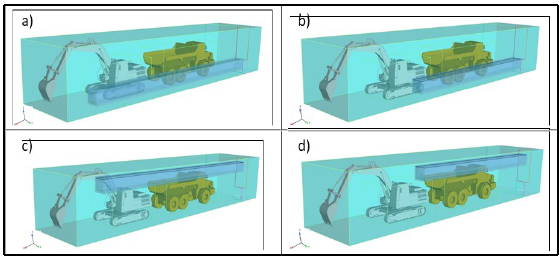
Source: Authors.
Figure 2 Possible configurations of the auxiliary ventilation system based on the mine conditions.
These scenarios were selected based on the case study. The duct could not be placed closer to the face due to operational conditions, and given recommendations found in the literature [23]. On the other hand, a layout with the duct further from the face was also difficult to apply in the mine due to operational restrictions. The swept of the working face was previously analyzed and found to be ineffective.
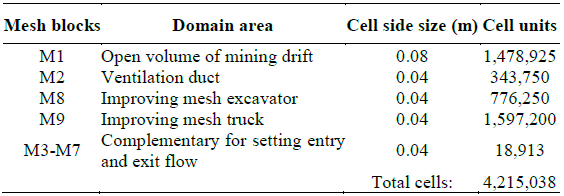
2.3 Meshing
A variable mesh density was applied in the model to solve the boundary layer and the associated physical phenomena in the most critical areas: the truck, the excavator, and the duct. In these places, it is necessary to have a fine mesh [24], and the full potential trajectory at the inlet region of the duct must be facilitated. Therefore, a prism layer is appropriate in this area due to the low non-orthogonal corrections required for these types of elements and given the relative simplicity of placing this type of control volume near the inlet and outlet regions. As the flow moves away from the inlet duct region, the relative importance of flow structures in force coefficients and velocity profiles decreases, as does the required mesh resolution.
A mesh with cubic cells of 0.08 m on each side was used for the main volume, while the surrounding volume of the equipment and the area inside the duct had a mesh with a cell size of 0.04 m, which enables a better description of the turbulent phenomena taking place inside. Table 1 summarizes the characteristics of the different meshes in the domain.
2.4 Boundary conditions
The limiting conditions were applied as shown in Fig. 3. The air that is let out through the duct is defined by the imposition of an outlet flow rate of 11 m3/s, as provided by in situ measurements. In order to set the limiting conditions, a constant speed input profile, u = (uref, 0, 0), was imposed. This was used as a limiting convective condition, setting the relative pressure at zero for the conditions of the model output domain. Symmetrical conditions without no slip were established for the walls, roof and floor. Roughness of 0.000015 m and 0.003 m was established for the ducts and the drift, respectively. Flow-Science's FLOW-3D commercially software was applied to calculate the simulations. Calculations were performed using an Intel Core 17 7700 s1151 CPU with 16 GB RAM.
2.5 Initial conditions
The initial conditions are based on data obtained from the case study. An initial temperature of 35 °C was defined for the walls of the drift and the equipment, truck and excavator. The air in the drift was also assumed to be at a temperature of 35 °C at the start. The initial pressure was assumed to be 1.013e+05 Pa. On the other hand, it was assumed that the power of the excavator is 200 kW, and that of the truck is 50 kW. The value of 50 kW was estimated based on the criterion that during the truck's loading, the engine is in a power regime below maximum power; specifically, the truck's power was assumed to be 20% of its maximum power, which is around 240 kW. The heat source is distributed around its surface in both cases. The head of the excavator is placed in the working face at Z = 2 meters, which is a very common placement.
3. Results and discussion
3.1 Graphical analysis
3.1.1 Air velocity
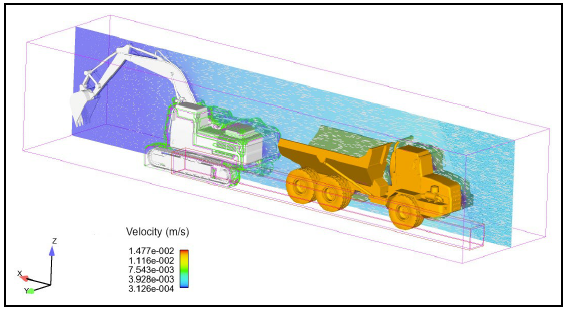
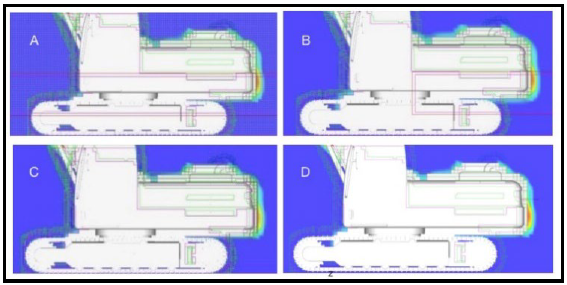
Despite the simulation running for t = 120 s, it shows the stabilization of the flow over structures and machines from t = 60 s onwards. Fig. 4 illustrates the velocities for an intermediate XZ plane (Y = 4.5 m for model B), when the flow is already stabilized.
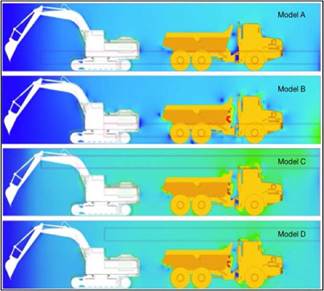
The air velocity behavior in the different scenarios is analyzed in Fig. 5, showing sections of models A, B, C and D, respectively, with the least favorable positioning of the equipment: the excavator working in the face and the truck ready to be loaded.
Models A and B show a larger region of the working face with low air velocity, and therefore less pollutant, dust and heat removal. This situation worsens as we place the duct entry point further away from the face; the case shown in Model B does not even allow the sweeping of the whole excavator. Other situations, such as positioning the duct closer to or further from the face, were not analyzed because less than 3 meters was technically impossible in reality and against the recommendations of the ventilation literature [23,25] or there was no removal in the face when there is more than 8 meters.
On the other hand, Models C and D show better conditions in both cases, especially at a distance of 3 meters. The models suggest that the height of the duct has a greater influence than the distance between the duct and the face within the range of 3 to 8 meters.
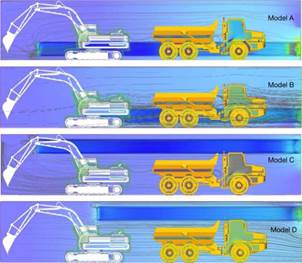
The visualization of the streamlines (Fig. 6) is very useful to determining the areas where at high/low velocity gradients are present [26]. Model A offers good air circulation around the mining equipment and the front region. However, the upper side of the face is not well ventilated, as it is a zone where heat load and pollutants can potentially accumulate. In the case of Model B, at either the equipment or the face, the ventilation performs poorly.
The ventilation conditions are better when the duct is placed in the upper side of the wall, and especially if it is closer to the working face. Model C shows a very good distribution of streamlines along the drift, and particularly around the equipment and the face. In the case of Model D, the streamline distributions are still better compared to the model with the ducts in a lower position, with a good sweep of the equipment area and the flow lines distributed throughout the entire section. However, the face is not properly ventilated due to this distance.
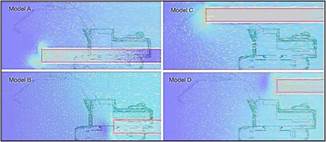
As can be seen in Fig. 6, the entry point of the duct and the interaction with the equipment, particularly the excavator, are the most critical factors. Therefore, this zone requires closer analysis. Fig. 7 displays the velocity vectors for an XZ plane located in the vertical middle plane of the ventilation duct axis, Y = 7 meters, where the maximum velocity gradients and vortices caused by turbulence can be observed.
Source: Authors.
Figure 7 Velocities for the XZ section passing through the midpoint of the ventilation duct. Own elaboration.
Source: Authors.
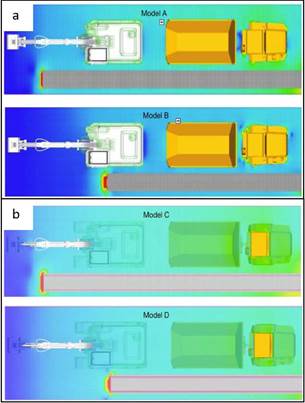
Figure 8a) Velocities for an intermediate XY plane, Z = 1.6 m. b) Velocities for an XY plane, Z = 3.5 meters.
The graphical analysis of the solutions suggests that Models C and D offer the best air circulation around the excavator. The most favorable alternative is C, which is in accordance with all the previous simulations. The fact that the air is extracted from the top, and that it is superheated, help the natural behavior of the air. The duct entry point was also analyzed on two horizontal XY planes; one for Z = 1.6 m above floor and the other for Z = 3.5 m, Fig. 8. It can be seen that the upper position of the duct yields much better conditions in terms of equipment and face swept, which is crucial to removing the heat load produced.
3.1.2 Temperatures
One of the main benefits of adequate ventilation, apart from adhering to the health and safety requirements of employees, is the cooling effect on the equipment, which is crucial for its performance and lifetime [23]. Therefore, the temperature gradients must be carefully analyzed.
Fig. 9 shows the temperatures in the XY plane for Z = 2 m. The whole system was analyzed, but only the most critical area is shown-the excavator body and its head. A heavy temperature gradient around the region of the excavator attack tool can be seen in all the cases. Besides this, another temperature gradient of less importance, around the excavator's main body, is also observed. The same analysis was performed in the main body of the excavator with an XZ plane, Y = 4.5 meters (Fig. 10). A critical point in all cases is the rear of the machine. However, the graphical analysis does not show a clear difference among the four models. It is necessary to perform a numerical analysis to give insight into the heat load around the equipment, and study which model gives rise to better conditions.
3.2 Numerical analysis
3.2.1 Air velocity
The air velocities were parameterized for different vertical heights at a horizontal distance along the X axis of 0.1 m from the face. This analysis will show the behavior of the air in the most adverse zone for ventilation. Fig. 11 displays the velocity distribution in the Y axis of the models, considering three different height scenarios: Z at 0.5, 2.5 and 4.5 meters.
In a position close to the floor, Z = 0.5 m, Model A works much better than the other scenarios, and the air velocity is higher when the duct is close to the working face. Models B, C and D show similar behaviors, while the velocity is very similar for different distances to the duct, between 3 and 8 meters, when it is placed in the roof of the drift (Models C and D).
When we analyze an intermediate height in the drift, 2.5 m, we see a velocity increase in the middle position of the Y axis due to the turbulence generated in the airflow for the head of the machine. The model that offers the best air circulation is also model A, as in the previous case, and the worst model is model B. Models C and D offer very similar speeds in the area studied.
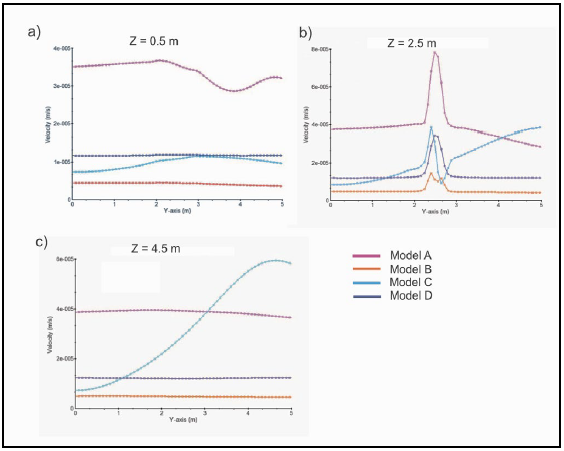
Source: Authors.
Figure 11 Velocity distribution along the Y axis in different scenarios. a) Z = 0.5 m, b) Z = 2.5m, c) Z = 4.5 m.
Source: Authors.
Figure 12 Temperature distribution in the upper region of the excavator. XY plane with Z = 2.5 m.
With a high position, 4.5 m, we observe that Model A offers higher air velocities than Models B and D, while Model C shows a huge difference along the Y axis, with a maximum at Y = 4.5 m, coinciding with the position of the duct.
Overall, the configurations with the entrance of the ventilation duct closest to the working face generally provide better ventilation in the area closest to the wall. In addition, Model C (duct in the upper side) shows increased velocity in the Y axis, which corresponds to the side of the duct. In Model D, using the same positioning but located further away, we do not see the same behavior as in Model C, as the distance to the face is too great.
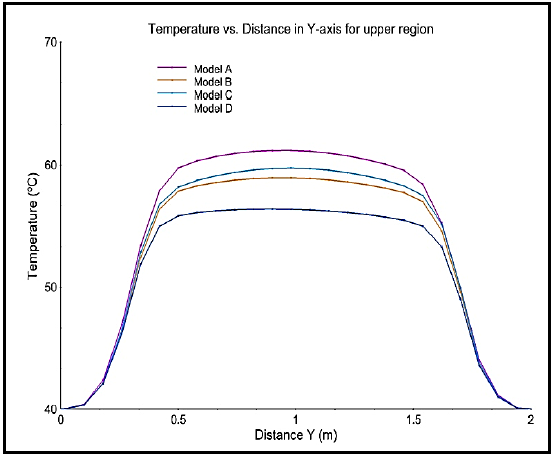
3.2.2 Temperatures
Four sensitive areas were studied to determine the dry temperature distribution, the first of which corresponds to the Y-axis distribution of temperatures in an upper region of the excavator, and a medium XY plane with an elevation of Z = 2.5 m, Fig. 12. Here, the temperatures range from a minimum value of 40 °C at the end to a maximum value of 61 °C at the central zone in model A.
Model D offers the lowest temperature in the central zone, at 56 °C. It can be seen that the two models with the ventilation duct 3 meters away from the wall, Cases A and C, reach higher temperatures than those achieved by the models with the ventilation duct 8 meters away from the wall, despite these differences not being very great. This is because having the intake of the ventilation duct near to the area studied, as in cases A and C, favors the heat transmission in the affected area. However, the lowest temperatures are achieved in case D, with the ventilation duct at the top of the drift.
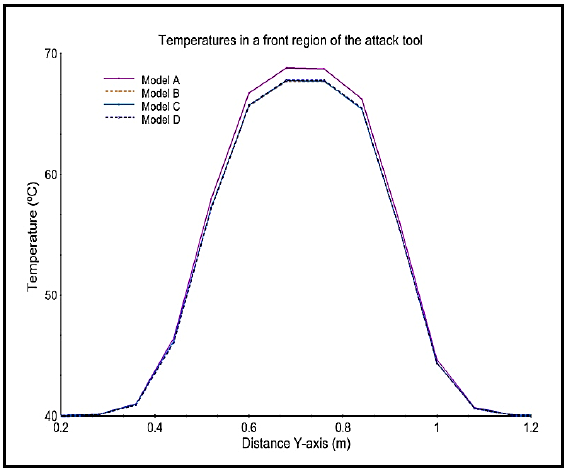
Fig. 13 shows the temperature distribution in the front region of the attack tool of the excavator along the Y-axis. In this case, the temperature range is 40 °C to 68.5 °C for model A. The other models have similar temperature distributions, all showing a maximum of around 67 °C.
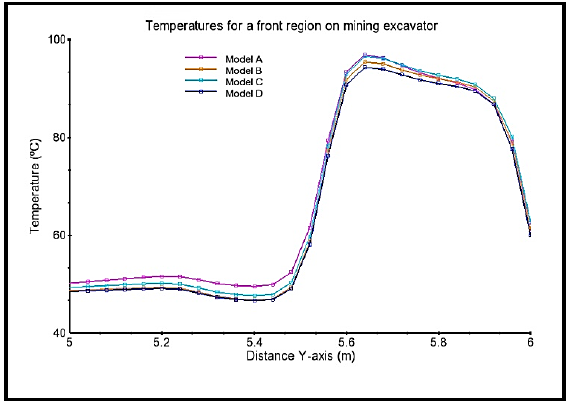
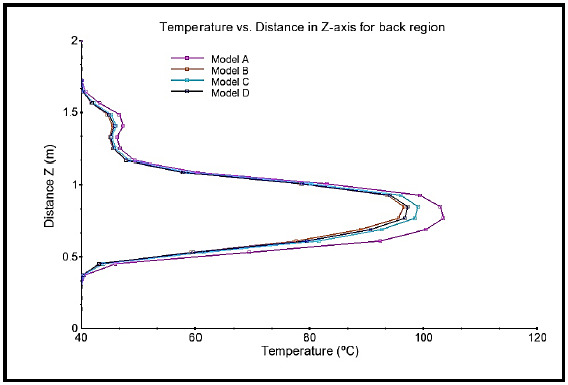
The temperature distribution in the front region of the excavator on the duct's side is shown on the Y-axis in Fig. 14. The temperatures range between 50 °C and 96 °C, this being one of the areas with the highest temperatures. The area near the ventilation duct shows significantly lower temperatures, with Model D being slightly more efficient than the others. On the other hand, the Z-axis of Fig. 15 displays the temperature distribution for the back region of the excavator on a medium XZ plane. As in the previous figure, this is one of the hottest areas of the excavator. In contrast to the upper part of the machine, which benefits from ventilation, the front and back parts reach higher temperatures due to the layout of the equipment and the airflow direction. As in the previous analysis, Model D has slightly better ventilation conditions.

4. Validation
Our results were validated with in situ measurements. Table 2 shows the modeled dry temperatures and the measurements taken in the case study for Models A and B, which are the two configurations currently found in the mine. The values were collected on the side where the workers operate and at a height of 1.5 meters. This choice was made to replicate the conditions of the workplace.
The real values were obtained by calculating the mean value measured over the last two years in all the workings faces of the mine (these data have only one decimal place). The comparison gives a good correlation between the real values and Models A and B. Therefore, Models C and D can be considered reliable when analyzing alternative scenarios.
5. Conclusions
All the feasible models were analyzed in the case study. Models A and B offer insights into the current situation of the working faces. These scenarios were validated with in situ data, showing sufficient correlations to identify the simulations as sound, and the models could therefore be used to analyze other alternative auxiliary ventilation systems, as was done with Models C and D. This information is useful in tackling the issues related to the pollutants, gasses or heat load present in each working face of the mine.
Among all the models analyzed, there is no single best scenario, but Model A and Model D together represent the best choice, with the duct at 3 meters from the face, on the lower and upper sides, respectively. Selection between A and B depends on the type of setback. If the main area of concern is the face, Model D provides better sweep, while Model A is more efficient in removing heat emitted from the equipment.

