


 Inglês (pdf)
 Artigo em XML
 Referências do artigo
 Enviar este artigo por email
 Citado por SciELO
  Citado por Google
  Similares em
SciELO
Similares em
SciELO  Similares em Google
 Permalink
1. Introduction
After the appearance of the epidemic caused by the SARSCov-2 virus, later named COVID-19 disease, at the end of 2019 in Wuhan, China, a great effort has been made to contain the contagion in the region where it first appeared.
That effort was fruitless, and the infections spread throughout the world. The World Health Organization (WHO) declared a pandemic on March 11, 2020. From that moment on, measures were taken in Colombia to reduce the effects of the epidemic, especially in terms of public health. The National University of Colombia suspended face-to-face classes as of March 15, 2020 and theretofore all classes were held remotely. All the tasks that required the presence of people one way or another, including all laboratory courses and practices, were suspended. At the national level, a generalized mandatory confinement was decreed, which accentuated the difficulties, especially for students with fewer resources.
The university temporarily modified the student statute to prevent students with little or no internet access from being harmed by this. As a result, the period to drop a registered course without penalty was extended to the very end of the semester. In practice, this meant that there would be no failing grades while the remote class regime lasted. In addition, several initiatives were organized in several schools to find sources of financial aid, mainly through voluntary faculty financial contributions, for those students from out of town without the means either to sustain themselves or participate in remote learning.
During the rest of the year 2020, it became evident that more students than usual were having academic difficulties. Nevertheless, the temporary relaxation of the student regulations avoided a major catastrophe in terms of failing courses and student outcomes. However, some program advisory committees reported higher dropout rates for reasons not directly associated with academic performance, which may be attributable to the pandemic. The increase in reported cases of emotional problems has also been notorious.
This situation reflects a trend detected worldwide that shows that many people, including students, have been affected in different ways during the months of the pandemic because of stress caused by fear of infection and mobility restrictions. Several publications have analyzed how different population groups have been differently affected. Reference [1], for example, emphasizes that the impacts can be very different, depending on social and economic conditions.
At an international level, numerous studies have been carried out on the impact experienced by students from different countries and educational levels. Most of the studies that have been undertaken on college students have focused on the psychological effects experienced as a consequence of the conditions derived from the pandemic [2-4].
Several studies have analyzed the effects of inequalities and social inequities in different contexts, especially among university students [2,5]. Flack [5], for instance, made an extensive analysis of the ways in which Australian students perceived the pandemic, controlling for socio-economic conditions, ethnicity, location, type of school (private, religious, public).
Another group of studies has been dedicated to evaluating conditions associated with delays in graduation and other conditions that lead to loss of income, due to lost wages, once students graduate [3].
All the studies that we have analyzed are based on surveys or interviews. At this time, we do not have any study where objective variables related to the direct effects of the pandemic on the academic performance of the student community are evaluated.
This project aims to estimate the effects that the pandemic and its treatment have had on the academic progress, grades and dropout rates of students from the School of Engineering of the National University of Colombia, campus Bogotá. We considered the two academic periods of 2020 and compared them to the previous ten semesters in order to gauge the effect that the new course drop policy has had.
2. Methods and data preparation
The main source of data was the University Registrar's official record files with all the information on courses registered by undergraduate students from the Bogota campus. Additional files containing data on courses that were dropped and, therefore, do not appear in students' transcripts were then added, to analyze changes in patterns of course completion and passing. This information was combined with personal and socioeconomic student information. All records were anonymized, to protect students' personal information prior to any processing or analysis. Records for students of the school of Engineering were then selected and studied as presented below.
2.1 Models and variables
This study of the pandemic on academic performance is focused on the analysis of the following variables: (i) grades, (ii) students' progress, (iii) dropped courses. In addition, these variables are treated following a descriptive and inferential statistics approach. In general, the descriptive approach is used to observe differences in terms of means and probability density functions during the pandemic and non-pandemic periods. In contrast, the inferential approach is used to model the effect of some other exogenous variables such as course typology, sex and family income. This inferential approach is mainly based on ordinary and logistic regression analysis following a causal Bayesian model.
2.2 Causal model
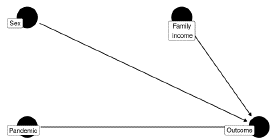
In order to establish causal links between the different variables, a causal model needs to be established. The usual representation of causal relationships is by means of a Directed Acyclical Graph (DAG). In this type of graphs, nodes represent variables and arrows represent causal influences. The effect of the pandemic can be thought of as a natural experiment since the apparition of this treatment is independent of all other variables. Therefore, a DAG representing the effect of the pandemic and two main additional variables (sex and family income) affecting a student's result (outcome) is shown in Fig.1 A causal model like this allows us to establish causal relationships from statistical estimands [6]. The only assumption that is necessary for this DAG is the fact that Sex and Family income are independent variables. Based on this graph, all impacts estimated in this work are, in fact, causal effects.
All statistical models featured from now on are presented in standard form, which makes explicit the assumptions made in the construction of the model. The ~ symbol indicates a distribution assumed for the data (a likelihood function) and an equal sign defines a parameter of the distribution in terms of other variables. In this work we only consider two types of models: linear regression models where residuals are normally distributed and logistic regressions with a Bernoulli distribution and a logistic link function. Bayesian goodness of fit tests were performed based on Bayesian factors. All were satisfactory, which was somehow expected, given the large sample size.
2.3 The data
The information used includes 329055 records of courses registered by 13617 students of Engineering at the National University of Colombia, Bogotá, during the period from 2015 to 2020. The records of 32240 courses that had been dropped from students' files, at the student's request or due to administrative procedures, were then added to the database.
2.4 Population characteristics
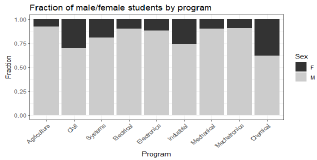
During the period being considered, a total of 13617 students were registered in engineering programs. A breakdown, by sex and curricular program, of the evaluated population is presented in Fig.2. It may be observed that the number of female students is relatively low in all engineering programs, as is common in Colombian schools of engineering.
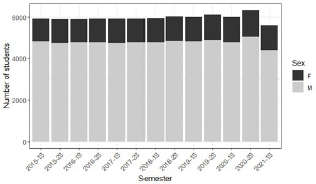
The current COVID-19 pandemic has forced many changes in the way of living of the population in general. We were interested in knowing how it affected the students in our school. A very important issue was the effects of the pandemic on the total number of attending or registered students each semester, since there were fears that many students would drop out because of the aggravation economic hardships that took place at the time for them. Fig. 3 shows the number of students registered each semester, divided by sex. It may be noticed that the number of students has, in fact, rose slightly during 2020, but decreased in 2021, for reasons to be discussed in the results section.
3. Academic performance
Being a public school, the university has a very diverse student population, in economic and social characteristics. One measure the university utilizes for summarizing the economic means of each student is what we call Basic Tuition Points (PBM, by its Spanish initials). It is used to decide the amount a student must pay each semester for tuition and other fees. For modeling purposes, we will use a centered version of this variable: PBMc is a normalized (zero mean, unitary standard deviation) PBM.
The project analyzed the impacts or effects of the COVID-19 pandemic from the point of view of the student's academic performance, as characterized by (i) the course grades and (ii) the progress in the program measured as the ratio between the approved and the total required credits to graduate in each semester. The analysis was performed for the whole Bogota campus, but we only present here the main results for the school of Engineering.
First, we considered the overall pattern of grade distributions in time, from 2015 to the second semester of 2020. Fig.4 shows the estimated probability density function of the grades awarded, for each semester and all courses taken and passed by engineering students during the period.
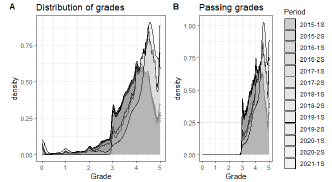
Source: Own work.
Figure 4 Probability density functions of the grades of courses taken and approved per semester.
The probability density functions of Fig. 5 show that the grading pattern drastically changed during the semesters of the pandemic. The density was quite stable from one semester to the next, before 2020. However, it is clear that faculty assigned the grade values differently during the pandemic period, compared to what they used to do before. To summarize this change, we considered the semester's average grade for all courses and all students. There were a substantial number of cases where a non-passing grade was given, therefore, the average grade is reduced by those grades. When comparing to the pandemic situation, where all non-passed courses were allowed to be dropped, of course, the average value was very different. In order to have a meaningful comparison, we considered only the grades of courses that were passed, i.e., all grades below 3.0 were removed for the comparison. By only comparing the passing grades, it is apparent that the average grade for the semesters during the pandemic are significantly higher than before (around 4%). This confirms the conclusion drawn from examining the density functions. See Fig. 5.
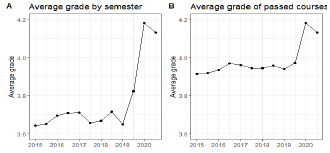
Source: Own work
Figure 5 Average grades per semester of courses taken and approved at the School of Engineering.
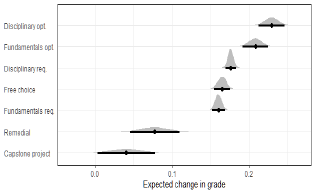
This raised the concern of whether different types of courses (according to an internal classification), were affected to different degrees. A simple regression model [6,7] was developed; its results are shown in Fig. 6. It shows that, in effect, a similar phenomenon occurred for all types of courses. The increase in the average grade was evident and significant for every type of course.
In order to see the effect, on the average grade in each typology of courses of the pandemic, we applied a simple regression model of the form:
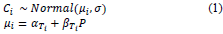
where Ci is the grade obtained in a course i, Ti is the type of course i and P is a binary variable ("dummy") that satisfies: P = 0 before the pandemic, and P = 1, during the pandemic. The coefficients α Ti quantify the average value of the grades in the courses of each type and fin represents the effect that the pandemic condition had on each type of course.
It may be observed that the variation in the average grade was not only due to the change in the regulation, but because of the pandemic, there was a positive effect in all cases and the greatest effect was in the fundamental area of each program. The smallest effect was observed in the capstone project group, followed by remedial courses. These are groups with fewer students. If the last two cases are excepted, the effect of the pandemic condition is very similar in the other five types. Fig. 6, in turn, shows that there is little uncertainty in the estimation of the average changes.
3.1 Effect of Sex and Income in studenfs grades
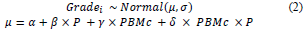
A linear regression model [6,7] was designed to analyze the effect of Sex and the income proxy -PBMc- on the academic performance. First, we studied the effect of family income on the grades, using a model of the form:
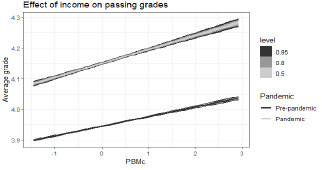
The results show that grades in passed courses directly depend on income, with an increase of 0.03 units per standard deviation of income before the pandemic. During the pandemic, the slope was increased a little, meaning that average grades for a student with a decreased income now increases 0.04 units per standard deviation of increased income (see Fig. 7). This is a negative outcome, resulting from the pandemic, since lower-income students are more likely to obtain lower grades in the courses they passed.
Next, we studied the effect of sex and the pandemic on the average grade obtained by students of engineering using a model of the form:
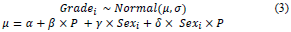
Fig. 8 shows that women customarily obtained better grades than men, with a difference of 0.14 units. The effect of the pandemic adaptation measures was to increase the average grade by 0.42 for females and 0.47 for male students.
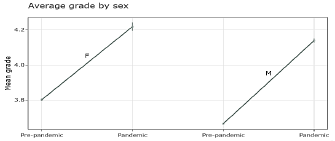
The increase in average grades was expected, given the changes in grading patterns described before. One possible explanation for the better adaptation of male students may be that they are more likely to drop a course that they might otherwise fail, as will be discussed later.
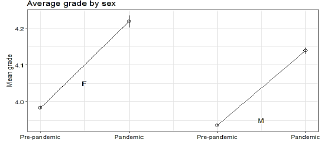
Restricting the analysis to the courses that were passed, in order to have a more balanced comparison with the pandemic situation, a regression model indicates that women still get higher grades and that this margin has widened (0.04 pre-pandemic vs 0.08 pandemic), a result that indicates that women are more likely to pass a course and by a higher gap, with respect to the minimum passing grade (see Fig. 9)
3.2 Students'progress in their curriculum
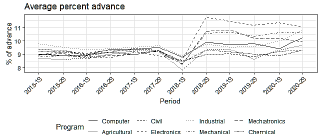
One of the main concerns about the effect of the pandemic on students was that their path to graduation may be delayed because of the pandemic. Since all our undergraduate programs have a nominal duration of five years, it is expected that each semester a student passes 10% of the required credits. We computed the percentage of the progress of each student for each semester. Fig. 10 shows the average percentage of advance per semester for students of the engineering programs, since 2015. One preliminary observation is that the average student advanced nearly 9% each semester, i.e., it took them approximately eleven semesters to graduate. In general, one can appreciate that there has been an appreciable tendency to increase the percentage of advance during the pandemic conditions as compared to pre-pandemic semesters. This increase was much more accentuated in Electronics Engineering, but it was noticeable also in Mechatronics, Mechanical, Systems and Computer and Industrial Engineering.
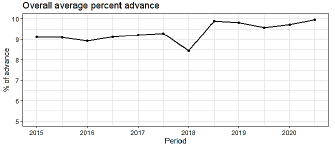
For the evaluation of the academic progress of the students, the number of credits passed each semester was evaluated, from 2015 to 2020, as a percentage of the total of the career, this intending to establish if the students have been harmed by a slowing down of their studies. We compared the semester percent progress for all students before and during the pandemic. The result, that surprised everyone, is that they are advancing faster during pandemic conditions: 10.6% (all our engineering programs have a nominal duration of ten semesters) compared to approximately 9%, before the pandemic. See the details in Fig. 11
4. Courses dropped
One of the measures the University's authorities adopted to counter the restrictions set forth by the epidemic, especially the strict confinement decreed by the government during the early stages of the pandemic, was the possibility of extending the period during which dropping a course (canceling the student's enrollment in the course) is admissible up to the end of the semester. This, of course, meant that all the courses that would have otherwise received non-passing grades were dropped. Basically, this means that during this period, there have been only two course results: either they are passed or dropped.
This policy change has been controversial, as a substantial part of the faculty members believe that students currently register for more courses than what they seriously plan to attend and that this results in an excessive number of students enrolled in many classes. They argue that this leads to a waste of teachers' efforts in serving students who do not plan to finish the course.
We, therefore, attempted to estimate the chances of a student dropping a course, as affected by the presence of the pandemic-induced change in regulations. We did an exploratory data analysis of courses being dropped during the period 2015 to 2020. The last two semesters were, of course, the ones affected by the change of regulation.
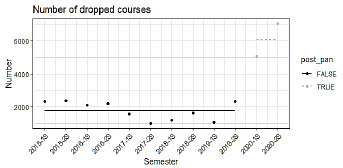
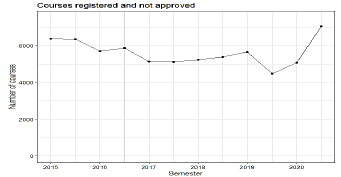
Fig. 12 shows that the number of dropped courses rose significantly, from an average number of 1703 before the pandemic to 6032 after the onset of the pandemic. This result appeared to agree with the faculty members criticizing the temporary dropping policy. However, a more careful look at the data shows that the actual number of dropped courses amounted to the sum of the number of courses that formerly received fail grades and the number of dropped courses. This may be seen in Fig. 13. The figure shows that students are not registering significantly more courses and later dropping them, as hypothesized by some at the university's administration.
4.1 Logistic model of dropping decision
We wanted to identify what factors weigh more in the decision of dropping a course or not. The variables more likely to affect this decision were identified as sex, and the income metric PBM. We added a dummy variable, P, which is one for year > 2019 and zero, otherwise.
We applied a logistic regression model [6,7] of the form:
where, p is the probability of registration in a course i being dropped, Drop i is one if registration for a course i was dropped zero otherwise, and
The results, presented in Fig. 14 show some surprising facts: before the pandemic, men were more likely (odds ratio 1.16:1) to drop a course than women. But the most important conclusion from the model is that during the pandemic, men have been affected more heavily than women (odds ratio 1.49:1). This means that women have used the option of dropping a course a lot less than their male classmates.
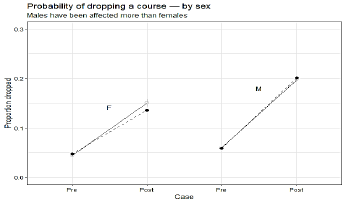
Source: Own work.
Figure 14 Probability of dropping a course, by sex. Continuous lines are the logistic model predictions; Black colored points represent observed frequencies.
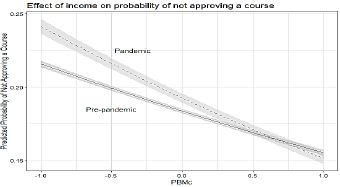
Another logistic regression model allows us to estimate the effect of the student's family economic situation on the chances of not completing a course (a decision that has an obvious deleterious effect on the student's academic progress) and the effect that the pandemic situation has had on this decision. To this end, a model of the form of equation (6) was fitted, where PBMc is a normalized PBM, as before.
The last term of this equation represents an interaction between the two variables; its purpose is to estimate the differential effect of PBMc on the probability of not finishing the course, during pandemic conditions.
The results of the model may be interpreted as follows:
The intercept shows that a student with an average PBM had a e a = 0.06 probability of dropping a course, before the pandemic.
The coefficient of P (Pandemic conditions) says that the probability of dropping a course increased e$ = 3.92 times with respect to the normal situation, as an effect of the pandemic.
The effect of one additional unit -a standard deviation- of PBM affects the probability by e Y = 0.83; i.e., a student with one standard deviation of PBM sees the probability of dropping from a course increase by 1/0.83 = 1.20, a 20% increase! This was perhaps to be expected since students with low-income are more likely to take a job during their studies. The magnitude of this variation was not accurately known.
Finally, as a result of the pandemic, students with PBM one standard deviation below the average have an additional factor of l/e s = 1/0.91 = 1.1 applied to the probability. In other words, the probability of this student dropping a course, during the pandemic conditions, is 1/ (0.83 x 0.91) = 1.32; i.e., 32% higher than his average-income classmate.
Fig. 15 shows the variation of predicted probabilities with varying income indicators -PBM c. As we can see, the effect of the pandemic has been to exacerbate the need to drop a course, especially for low-income students.
Source: Own work.
Figure 15 Probability of dropping a course, by family income (PBMc). Dashed lines are pandemic period predictions. Continuous lines are the pre-pandemic of the model.
As mentioned above, it was observed that the total number of courses being either dropped or failed remained approximately constant. Therefore, we wanted to model this number as affected by either sex or economic condition of the students. A logistic model similar to those described before was, then, used to model each of these effects. Only the results from the models will be discussed here.
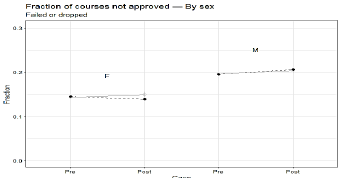
Fig. 16 summarizes the response of students to the pandemic by dropping the courses that they would otherwise fail. The graph shows that male students have not changed their probability of passing a course: the fraction of courses passed during the pandemic is almost identical to the fraction before. Female students, on the other hand, have reduced slightly the fraction of courses that were not passed, from 14.9% to 13.9%. As a result of the change of rules, the students have passed, basically, the same fraction of the courses they had registered as before the pandemic.
Source: Own work.
Figure 16 Probability of not passing a course, by sex. Gray lines are the logistic model predictions; black colored points represent observed frequencies.
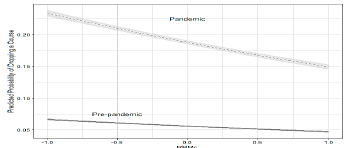
Finally, a model was developed to estimate the effect of income (as measured by the PBMc variable), on the probability of not passing a registered course. The results are summarized in Fig. 17. The figure shows that income has an inverse relationship to the probability of not passing a course. Before the pandemic, a reduction of one standard deviation with respect to the mean increases the probability from 0.18 to 0.22. The same difference in family income during pandemic conditions leads the probabilities from 0.19 for the average income to 0.24 for a student with income one standard deviation lower.
Source: Own work.
Figure 17 Probability of not passing a course, by income. Dashed lines are pandemic period predictions, continuous lines are pre-pandemic predictions of the model.
Since the probability we are dealing with is the one that leads in delays in the advance towards graduation, it becomes more dramatic the inequality reflected in Fig. 17. The increase in the slope of the lines that predict the probability of not passing the course is an additional differential effect affecting lower-income students. From the model parameters, this effect is estimated as 1/e-0.09 =1.094; i.e., a 9.4% increase for each standard deviation reduction.
5. A qualitative approach - Faculty survey
As a complementary analysis of the effects of the COVID-19 pandemic on the student's academic performance, a qualitative approach was adopted. In general, surveys had been widely conducted during the COVID-19 pandemic to assess the impact of school closures. One of the greatest efforts is the UNESCO, UNICEF, and the World Bank initiative [8-10] which launched a worldwide survey in three iterations during June and October in 2020 and June in 2021 with the participation of 118, 149 and 143 countries, respectively. Responses covered the impact on strategies and methods, education participants, and learning outcomes from pre-primary to upper secondary levels which are planned to be used in national educational policies for a future school's reopening. A similar worldwide survey regarding higher education has been reported in [11] with the participation of 424 universities based in 109 countries. In addition, some local surveys had been reported to assess the impact of the pandemic from the student's perspective in different areas such as online learning [12], life experiences [13] and expectations [14].
In this paper, a faculty survey was designed and conducted to explain, from the faculty's perspective, some of the results presented in the previous sections. Previously reported surveys [15] had already reported some challenges in faculty staff such as (i) computer literacy level, (ii) academic staff readiness and students' readiness for online learning and (iii) methodological challenges in digital educational environments.
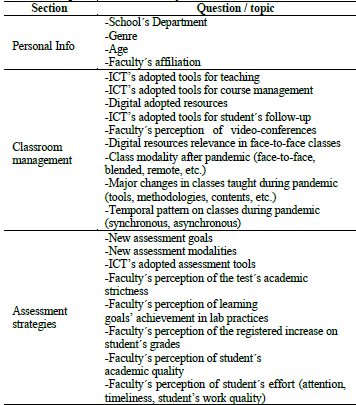
In general, the survey covered three main sections: (i) Faculty's Personal information, (ii) Classroom Management Strategies and (iii) Assessment Strategies. Details of the topics covered in each survey's section are shown in Table 1.
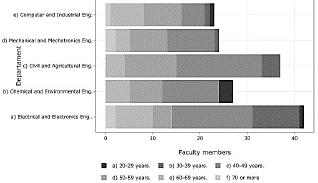
The survey was deployed among the participants using Google forms, to be voluntarily answered. Consequently, 153 out of 345 faculty members finally completed the form, being mostly in the age range between 40-60 years as is shown in Fig 18. Regarding sex, most of the faculty members are males in a large proportion (135 out of 153), which is coherent with the share by genre for the School of Engineering (87/13% male/female ratio).
To analyze the survey's internal consistency some statistical indicators were used such as Cronbach's alpha coefficient (probably the best-known indicator) and Mcdonald's Omega. In general, Cronbach' s alpha is easier to be assessed but may be troubled given that it underestimates questions' reliability and, especially, because of overestimation of the first factor's saturation [16]. This behavior becomes inconvenient in our survey's results given that some extreme answers ("much less" or "much more") had very few instances. On the contrary, Mcdonald's Omega is considered a better consistency measure. These statistical indicators were calculated using the 'scale Reliability ()', part of the 'user friendly science' package in R [17]. This indicator was calculated for the questions about faculty's perception of students' attention, punctuality and work quality (see table 1). The results show acceptable values for ordinal scales (recommended thresholds are > 0.7) and exhibit good reliability leveis ra = 0.72. The value of a = 0.68 is a little bit under the acceptable thresholds, which may be explained by the few numbers of instances for the extreme answers in our sample.
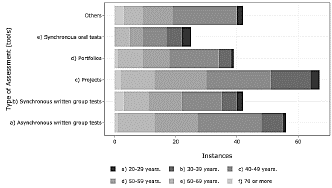
Given that most of the major reported changes were mainly methodological, we thought it adequate to deepen into methodological changes in terms of the assessment during the pandemic. In the third section of the survey, faculty members were asked about the new type of assessment and evaluation tools. Results show that most of the new strategies are focused on collective rather than individual work in both, projects and written tests, where asynchronous are preferred to synchronous tasks (see Fig. 19). In addition, the high preference for projects as an evaluation tool is more evident in younger faculty. Nevertheless, written tests (synchronous and asynchronous) are still not only the favorite tool but also are now collective. Accordingly, this new feature may explain the higher grades as well as the higher rate of progress in the study plan, being mindful that these types of academic tasks are, probably, closer to the student's future professional experiences.
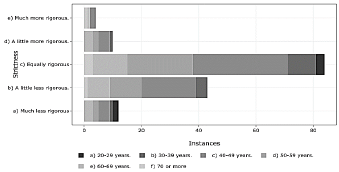
On the other hand, faculty were asked about their perception on evaluation's strictness during the pandemic. Results show that most of the faculty consider that rigorousness in the evaluation was maintained during the pandemic, followed by a smaller portion (almost a half) that considers that rigorousness slightly decreases during pandemic (see Fig. 20). In general, there is no strong evidence that the increase students' grades are explained by a lack of strictness in the assessment.
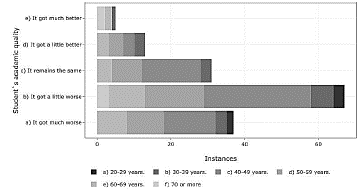
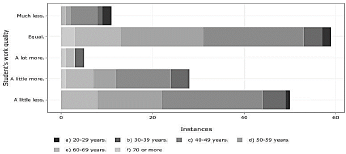
Finally, respondents were asked about (i) changes in students' academic quality and (ii) student's work quality. Despite grades' increase, most of the faculty tend to believe that student's academic quality was slightly deteriorated during the pandemic (see Fig. 21); however, this is not equally reflected in the student's work quality perception, where most of the faculty consider that its quality is maintained (see Fig. 22). In fact, the perception about maintaining the same academic quality and being strongly deteriorated is almost the same, but this is not the case for students' work quality, where the faculty's perception is a little bit more optimistic.
Source: Own work.
Figure 21 Faculty's perception of changes in student's academic quality during the pandemic.
Again, there seems to be a little counterintuitive perception given that, despite evaluation's tools being now mostly collective, just like the way it is in real work-experiences, there is still a belief that academic quality tends to deteriorate despite the increased grades. This may lead to the interesting perception that evaluation tools and grades are only accurate about academic quality when they are applied individually, even when real professional experiences are seldom as such.
6. Conclusions
A significant change in grading patterns was observed in courses taken by engineering students during the pandemic. Grades were, generally, higher than they used to be in pre-pandemic times. The average grade of approved subjects was 4 % higher during the pandemic. No explanation has been offered, for this behavior, so far.
Regarding the progress and performance of the students of engineering at our school, and contrary to what was expected, they progressed more than they did before the pandemic each semester, from a 9% progress per semester, they went to 10.6%. This behavior was not uniform for all curricular programs or in all types of courses, presenting a greater increase in the fundamental courses and less in the capstone project.
Despite the significant rise in the number of dropped courses (more than tripled) during the COVID-19 pandemic, this number is almost exactly the sum of failed courses and dropped courses before the pandemic. This behavior shows that students are not significantly registering more courses to be dropped lately and that the demand for teaching staff was not strongly compelled as it was hypothesized by faculty and university administration.
Regarding course-dropping decisions, the logistic model shows that men have been more heavily affected than women, given that the odds ratio increased from 1.16 to 1.49 during the pandemic. As to the student's family income (PBM c ), the implemented model shows that the effect of the pandemic has been to exacerbate the need to drop a course, especially for the low-income students.
When we consider the probability of not passing a course, male students have not changed their probability while female students slightly reduced it. This enforces the result that female students have coped more robustly with the pandemic. In addition, low-income students have an increased probability of not passing a course. And this was slightly exacerbated during the pandemic, passing from 22% to 24% when incomes are reduced by one standard deviation with respect to the mean.
According to the faculty's survey, results show that most of the new assessment strategies are focused on collective rather than individual work, in both projects and written tests, where asynchronous activities are preferred to synchronous tasks. In addition, there is no strong evidence that the increase in students' grades is explained by a lack of strictness in the assessment. Moreover, there is still a belief that academic quality during the pandemic has deteriorated, despite the grade's rise. This may lead to the interesting perception that evaluation tools and grades are only accurate about academic quality when they are applied individually, even when real professional experiences are seldom as such.

