


 English (pdf)
 Article in xml format
 Article references
 Send this article by e-mail
 Cited by SciELO
  Cited by Google
  Similars in
SciELO
Similars in
SciELO  Similars in Google
 Permalink
1. Introduction
The processes of colonization, human migration, and the globalization-driven trade of agricultural products are primarily responsible for the introduction of potentially invasive non-native species, which can lead to serious negative impacts on the conservation of ecosystems [1]. In most cases, anthropogenic climate change favors the rapid reproduction and adaptation of these species through the alteration of several factors including mechanisms of introduction and transport, climatic constraints, geographical distribution, impacts, and effectiveness of management strategies [2]. Moreover, invasive species are more likely to have a broad environmental tolerance, short juvenile periods, and long-distance dispersal [2], supposing an advantage over native species in a changing environment, and hence a possible global-scale risk to biodiversity.
Pontederia crassipes (water hyacinth) is a perennial, mat-forming, free-floating macrophyte inhabiting freshwater ecosystems. It is known as one of the most widespread weeds in tropical, subtropical, and warm temperate regions throughout the world [3], present in more than 50 countries and in every continent except Antarctica [4,5]. It began to spread in the late 1800s, as a consequence of the ornamental plant trade [5], leading to its export and cultivation in garden ponds, and then its invasion of local aquatic environments and rivers [4]. The main factors controlling P. crassipes proliferation are nutrient availability [5], water depth, turbidity, type of substrate, and exposure to wind [6]. Once established, it forms thick mats over the infested water body curtailing the penetration of light and decreasing dissolved oxygen, nitrogen and phosphorous [7]. This affects not only submerged native species, but also other organisms such as phytoplankton, zooplankton, and fish [6,8,9]. Furthermore, since P. crassipes is native to the Amazon basin [10], it evolved in areas subject to drastic water level fluctuations and seasonal changes in rainfall [5], granting the water hyacinth a potential advantage in the current changing-climate scenario.
The successful spread of water hyacinth can be attributed to two main characteristics: high mobility by air-filled tissue known as aerenchyma which gives the stems and leaves of the plant considerable buoyancy, and clonal propagation which contributes to its rapid growth over large areas [4], doubling the population in 15-18 days [11]. In its native range, P. crassipes usually occurs at relatively low densities, but it becomes a problem where the hydrological regime of a water body has been altered by human activities [5], as is the case for hydroelectric reservoirs. In these areas, increased agriculture, deforestation, and the general degradation of the basin can cause eutrophication, and the excessive abundance of water hyacinth exacerbates the problem [9]. To reach new places, P. crassipes takes advantage of the convergence of water currents, resulting in possible damage to turbines and the clogging of pipes if they reach hydraulic structures [5]. The hydrological balance of the ecosystem can also be affected by the great amount of water lost via evapotranspiration [8], which in turn, diminishes the lifetime of the reservoir [9].
Several strategies have been used to control water hyacinth populations, including the use of herbicides, physical/mechanical extraction, and biological control. Nevertheless, the first two mechanisms are costly and have been successful mainly in small areas (~ 1 ha), requiring long-term monitoring efforts, whereas biological control is cost effective, but requires a longer period (3-5 years) to exert an effect [5]. P. crassipes has aroused research interest as a tool for ex situ phytoremediation of water sources contaminated with heavy metals, pesticides and dyes spilled by industries, among various other uses [12]. However, the viability and potential conflicts of interests in its utilization have been questioned [5]. For these reasons, the timely detection and systematic monitoring of water hyacinth before excessive abundances are attained is of utmost importance. To this end, much effort has gone into preventing invasive species and to effectively control established invaders.
Structuring management plans for these species requires data on their spatial and temporal distribution, which locates populations and allows the evaluation of the appropriateness of regulatory methods. In large areas, this information can be acquired and monitored through the analysis of multi-temporal remote sensed data with Geographic Information Systems (GIS). We follow this approach in this study to analyze the spatio-temporal distribution patterns of P. crassipes in the reservoir of the Ituango Hydroelectric Project (IHP). The IHP is the largest infrastructure project currently underway in Colombia, with a reservoir consisting of 3812 [13] ha of flooded area, and a projected capacity of 2400 MW [13]. The results presented here are based on the analysis of multispectral data derived from Sentinel-2 MSI, including several Vegetation Indices (VIs) to evaluate their performance in the discrimination of P. crassipes, between September 2018 and March 2020. Therefore, this study contributes to the development of methodologies aimed at enhancing the monitoring of water hyacinth in large reservoirs, and to the formulation of better management strategies.
2. Materials and methods
2.1. Study area
The IHP is in northwestern Antioquia at 170 km by road from Medellín, and 8 km downstream of the Pescadero Bridge. The reservoir is situated within latitude 07° 08ʹ 10.00ʹʹ N to 06° 39ʹ 22.71ʹʹ N and longitude 75° 52ʹ 35.56ʹʹ to 75° 39ʹ 33.35ʹʹ W; it covers 3812 ha with a longitude of 77.1 km and occupies areas in municipalities situated on the left bank (Santa Fe de Antioquia, Buritica, Peque, and Ituango) and on the right bank (Liborina, Sabanalarga, Toledo and Briceño) of the Cauca River [14] (Fig. 1). The intra-annual (interannual) climatic variation in the study site is dominated by the dynamics of the Intertropical Convergence Zone - ITCZ (El Niño Southern Oscillation - ENSO). The ITCZ leads to increased (reduced) precipitation in June - July (November - March), whereas the ENSO warm (cold) phase results in decreased (increased) rainfall. The study site has an average annual precipitation of 1350 mm, and an average temperature of 26.7°C (based on several climate stations around the reservoir), whilst the water body has temperatures that range from 25.7 to 28.1°C [14]. Two life zones [15] converge in this area: tropical dry forest (bs-T) and tropical humid forest (bh-T).
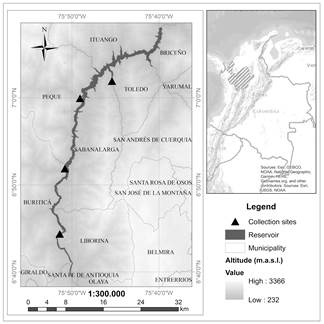
Source: Authors.
Figure 1 Location of the IHP reservoir along the municipalities mentioned in the text (a) and in the department of Antioquia - Colombia (b). The four collection sites of P. crassipes defined in the environmental license are indicated with black triangles.
The IHP’s buffer zone is mainly used for livestock and localized agriculture (small plots, less than 6.25 ha) consisting of coffee, banana, and sugar cane [14]. Other uses include fishing and artisanal mining, and some sugar and manufacturing industries [16]. Areas of dense forest, gallery forest, and pastures have decreased in recent years due to the filling of the reservoir and the built infrastructure, whilst the area encompassing secondary forests has increased as a result of reforestation implemented as part of the IHP compensation plan [17]. Though contamination by organic matter is not significant in the reservoir area, the Cauca River upstream receives important pollutant discharges due to industrial land uses, particularly in the Sabanalarga section where the average water temperature is 28.1°C, dissolved oxygen is low (1.9 mg/l) compared to the area near the dam (6.3 mg/l), and turbidity is high (142 NTU) [14] (EPM, 2011).
A contract was signed in 2010 by EPM and the Ituango Hydroelectric Society - Hydroituango to begin construction work on the reservoir. EPM was responsible for funding, building, maintaining, and operating the hydroelectric plant, with a projected lifespan of 50 years [14]. Operations at the power plant were expected to begin at the end of 2018. This was not possible given that one of its river diversion tunnels was blocked by landslides in April 2018, which negatively impacted the river, as well as the ecosystems and adjacent human communities. Since the reservoir was full, the speed of water flow has reduced, and only the surface water ran out of the spillway, while nutrients and sediments brought by the river were accumulated. Such conditions were favorable for the establishment and propagation of P. crassipes in the reservoir [17]. Following this contingency, two generation units were planned to enter operation each year, beginning in December 2021, and reaching the maximum capacity by the end of 2024.
2.2. Control of P. crassipes in the reservoir
Once the reservoir was filled, the macrophytes management program was activated in May 2018. Manual and mechanical controls began in September, with P. crassipes occupying 68 m3 of the reservoir in December. An increase to 1638 m3 was registered in April 2019 due to the river’s high discharge, which then returned to a decreasing trend at the beginning of May (1027 m3) (Alejandro Arias - IHP environmental professional, press communication). The presence of macrophytes has been monitored every 2 weeks to identify sites for its confinement and subsequent removal [14]. The objective is to keep the population below 20% occupancy in relation to the total area of the reservoir. Currently, there are four sites authorized by the project’s environmental license to dispose the removed material (see Fig. 1). The greatest difficulty in advancing this work is the limited road access to all the areas where the plant has been seen, and as a result, the work has concentrated on a site called El Ciruelar, located in the middle of the reservoir (municipality of Sabanalarga).
2.3. Spatial analysis
2.3.1. Data acquisition
Sentinel-2 is a European wide-swath (290 km), high-resolution (10m, 20m and 60 m), multi-spectral (13 bands) imaging mission (see Table 1 for detailed information). It comprises two polar-orbiting satellites placed in the same sun-synchronous orbit at a mean altitude of 786 km, phased at 180° to each other. Together (separated), the satellites have a revisit time of 5 (10) days at the Equator, at 10:30 LTDN. Sentinel-2 carries an optical instrument (MultiSpectral Instrument - MSI) which works passively by collecting sunlight reflected from the Earth. It has several practical applications including agriculture, land ecosystems monitoring, forest management, inland and coastal water quality monitoring, disaster mapping, and civil security. The first satellite (Sentinel-2A) was launched on June 23, 2015; the second (Sentinel-2B) on March 7, 2017 (https://sentinels.copernicus.eu/web/sentinel/missions/sentinel-2).
Table 1 Spatial and spectral resolutions of Sentinel-2A and Sentinel-2B images.
| Band number | Function in the electromagnetic spectrum | S-2A | S-2B | Spatial resolution (m) |
|---|---|---|---|---|
| Central wavelength (nm) | Central wavelength (nm) | |||
| B1 | Coastal aerosol | 442.7 | 442.2 | 60 |
| B2 | Blue | 492.4 | 492.1 | 10 |
| B3 | Green | 559.8 | 559.0 | 10 |
| B4 | Red | 664.6 | 664.9 | 10 |
| B5 | Vegetation red edge | 704.1 | 703.8 | 20 |
| B6 | Vegetation red edge | 740.5 | 739.1 | 20 |
| B7 | Vegetation red edge | 782.8 | 779.7 | 20 |
| B8 | NIR | 832.8 | 832.9 | 10 |
| B8A | Narrow NIR | 864.7 | 864.0 | 20 |
| B9 | Water vapor | 945.1 | 943.2 | 60 |
| B10 | SWIR- Cirrus | 1373.5 | 1376.9 | 60 |
| B11 | SWIR1 | 1613.7 | 1610.4 | 20 |
| B12 | SWIR2 | 2202.4 | 2185.7 | 20 |
Source: Adapted from European Space Agency - ESA (https://sentinel.esa.int/web/sentinel/technical-guides/sentinel-2-msi/msi-instrument)
In order to determine the spatial distribution of P. crassipes, images from both satellites were acquired freely and according to availability from the Earth Explorer USGS Server (https://earthexplorer.usgs.gov/). The images with the lowest percentage of cloudiness from September 2018 to March 2020 were selected and processed on Intel 5 computers with 8-GB RAM and 8 processing cores. ArcGis (ESRI, version 10.5) and Quantum GIS (OSGeo, version 3.8.1) software were used in the processing. The Geomatics Laboratory (Department of Forestry Sciences) at Universidad Nacional de Colombia, Medellín campus, provided full support.
2.3.2. Vegetation Indices (VIs) for P. crassipes
Sentinel 2A and 2B images were atmospherically corrected using the Dark Object Subtraction (DOS1) model embedded in Quantum GIS software. We excluded the months of September and December 2019 from the analysis due to the high cloudiness over the invaded area. Radiance was converted to reflectance, and all bands were resampled to a comparable spatial resolution of 10 m. Subsequently, images were clipped at the extremes of the reservoir. The polygons of the area covered by P. crassipes were delimited through visual interpretation of each monthly image from the compositions Shortwave Infrared (SWIR1-NIR-Red) and natural color (Red-Green-Blue). The natural color composite is natural to our eyes, but natural color images can be low in contrast and somewhat vague due to the scattering of blue light in the atmosphere. Hence, to improve visual interpretation, we used the Shortwave Infrared combination, which is useful for delimiting water bodies’ boundaries, while vegetation appears in shades of red.
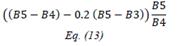
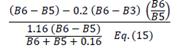
VIs for each monthly Sentinel image were calculated through arithmetical processes applied to the spectral bands in Table 1. The equation of each calculated index is shown in Table 2. The polygons of P. crassipes were then used to extract reflectance values from the images corresponding to each VI. Based on these reflectance values, we determined the suitability of each VI to be used in the detection of P. crassipes depending on their fit to a normal probability distribution (through the Kolmogorov-Smirnov test, α = 0.05), their coefficients of skewness and kurtosis, their precision (presence of outliers), and the consistency of their monthly time series (similar behavior of several VIs throughout the study period).
Table 2 Calculation of vegetation Indices based on Sentinel 2A and 2B images.
| Index | Equation | Ref* | |
|---|---|---|---|
| NDVI | Normalized Difference Vegetation Index |
|
[18] |
| NDVI2 | Normalized Difference Vegetation Index 2 |
|
[19] |
| EVI | Enhanced Vegetation Index |
|
[18] |
| SR | Simple Ratio |

|
[20] |
| GNDVI | Green Normalized Vegetation Index |

|
[20] |
| CIred edge | Chlorophyll Index red edge |

|
[18] |
| DVI | Difference Vegetation Index |
|
[20] |
| MSR | Modified Simple Ratio |
|
[25] |
| TCARI | Transformed Chlorophyll Absorption Reflectance Index |
|
[18] |
| OSAVI | Optimized Soil-adjusted Vegetation Index |
|
[18] |
| TCARI/OSAVI |
|
[18] | |
| TCARI/OSAVI [705,750] |

|
[21] | |
| MCARI | Modified Chlorophyll Absorption Ratio Index |
|
[34] |
| MCARI/OSAVI |
|
[30,34,35] | |
| MCARI/OSAVI [705,750] |
|
[21] | |
| NDRE1 | Normalized Difference Vegetation Index Red-edge 1 |
|
[36,37] |
Source: Authors
2.3.3. Changes of P. crassipes cover in the reservoir
The monthly delimited polygons of P. crassipes were used to estimate its multitemporal distribution in the IHP reservoir. This information allowed us to calculate the lagged monthly cross correlations between the water hyacinth cover and the monthly calculated VIs, as well as its correlation with monthly precipitation time series of the Sabanalarga station (29045000) provided by IDEAM. We chose this environmental variable for comparison since the floods of the Cauca River have been mentioned as the main cause for the increases in floating material. In addition, according to the monitoring of water quality in the river carried out by IHP since 2012, there have been no significant changes in the physical and chemical parameters of the water body or in the ecosystem resulting from the partial coverage of P. crassipes (EPM, press communication). Statistical tests and their respective graphs were drawn up in R software (R-project, version 4.0.3).
3. Results
3.1. Vegetation Indices (VIs) for P. crassipes
From the 16 indices calculated for the polygons containing P. crassipes in the monthly Sentinel images, TCARI/OSAVI, MCARI/OSAVI, TCARI/OSAVI [705,750], and MCARI/OSAVI [705,750] had a great number of outliers of several orders of magnitude. Due to this high variation, these indices were not included in further analysis. Although to a lesser degree of magnitude, NDRE, NDVI, NDVI2, and OSAVI also had a long tail of outliers compared to other VIs (Fig. 2, 3), as well as high skewness and kurtosis in comparison to a normal distribution (Table 3).
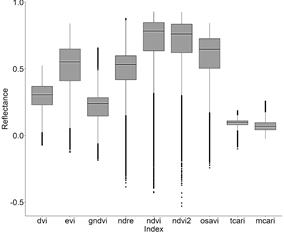
Source: Authors.
Figure 2 Boxplots for reflectance of small-scale VIs containing P. crassipes cover from monthly Sentinel images (September 2018 to March 2020) in the IHP.
Source: Authors.
Figure 3 Boxplots for reflectance of large-scale VIs containing P. crassipes cover from monthly Sentinel images (September 2018 to March 2020) in the IHP. ‘clred’ corresponds to Clred edge index.
Table 3 Statistical parameters for reflectance of VIs containing P. crassipes cover from monthly Sentinel images (September 2018 to March 2020) in the IHP. Rows with * correspond to versions of the original index but calculated with bands at 705 and 750 nm. Gray rows are for VIs removed for further analysis (see explanation in the text).
| Index | Mean | CV | Skewness | Kurtosis |
|---|---|---|---|---|
| Cl red edge | 2.30 | 49.07 | 0.35 | 2.90 |
| DVI | 0.30 | 34.49 | -0.41 | 3.09 |
| EVI | 0.53 | 32.44 | -0.66 | 3.31 |
| GNDVI | 0.21 | 58.88 | 0.12 | 4.91 |
| NDRE | 0.50 | 30.82 | -0.93 | 5.10 |
| NDVI | 0.73 | 24.16 | -1.70 | 6.67 |
| NDVI2 | 0.71 | 24.72 | -1.58 | 6.04 |
| OSAVI | 0.60 | 28.75 | -1.17 | 4.24 |
| SR | 8.57 | 61.17 | 0.96 | 3.55 |
| TCARI | 0.09 | 32.30 | -1.04 | 4.97 |
| TCARI/OSA | 0.16 | 374.82 | -24.56 | 18782.72 |
| TCARI/OSA* | 0.37 | 147.28 | -2.57 | 2298.32 |
| MCARI | 0.07 | 51.53 | 0.33 | 3.54 |
| MCARI/OSA | 0.11 | 198.83 | 2.76 | 17214.69 |
| MCARI/OSA* | 0.16 | 262.40 | 11.04 | 12901.70 |
| MSR | 2.35 | 45.22 | 0.13 | 2.51 |
Source: Authors.
After applying the Kolmogorov-Smirnov test (not shown due to no significance at α = 0.05), and according to the histograms of Fig. 4, the probability distributions of the indices were clearly not normal (P value < 0.05). Hence, we decided to determine the more appropriate indices for the detection of P. crassipes based on the following criteria: 1. their proximity to a normal distribution based on skewness (< |0.05|: highly symmetrical) and kurtosis (close to 3), and 2. the consistency in the behavior of their monthly time series.
3.2. Changes of P. crassipes cover in the reservoir
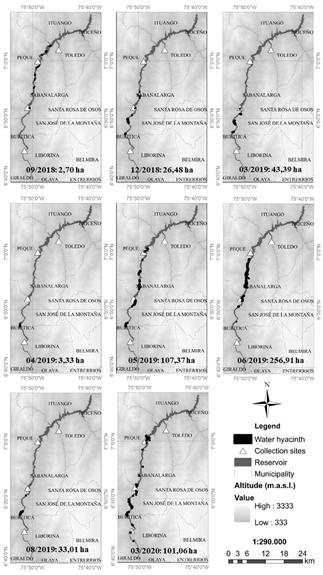
By September 19, 2018, P. crassipes was distributed in small patches located in the middle zone of the reservoir, along the municipalities of Peque and Sabanalarga, occupying a 0.07% (2.7 ha) of the water body (Fig. 5). By December 28, the infested area increased to a 0.70% (26.5 ha, a 10-fold increase in three months in Sabanalarga and Buritica. The previous patches located along Sabanalarga and Peque were probably collected in the two northernmost collection sites (black triangles in Fig. 5). Though a decrease was registered on January 1, 2019 (to 0.38% of reservoir’s area, 14.4 ha), P. crassipes then continued increasing until March 13 up to a 1.15% of the reservoir area (43.5 ha, a 3-fold increase in two months). On April 12, the infested area decreased to close to initial values (3.3 ha, 0.09% cover).
Source: Authors.
Figure 5 Multi-temporal distribution of P. crassipes coverage over the IHP reservoir. Borders of water hyacinth polygons (black) are exaggerated for a better display.
This reduction may be associated with extraction activities by EPM in the days prior to taking the image, with the remaining small infestations bordering the municipality of Buritica.
On May 22, the P. crassipes cover increased to up to 107.4 ha (2.8% cover, a 32-fold increase in one month), prior to a maximum covered area of 256.9 ha (6.8% cover) registered on June 26 in the municipalities of Buritica, Sabanalarga, and Peque. In the remaining months analyzed, a reduction trend was evinced until August 30, with water hyacinth occupying 33 ha of the reservoir (0.87% cover, an 8-fold reduction in two months after the maximum area), whereupon the water hyacinth cover oscillated around 100 ha (2.6% cover) until March 2020. This oscillation may have been due to EPM control activities through manual and mechanical extraction. In general, water hyacinth cover remained distributed throughout the municipalities of Peque, Buritica, and Sabanalarga.
Based on the multi-temporal distribution of P. crassipes (Fig. 6d), the largest infested area (6.8% of the reservoir) was recorded on June 26, 2019, after a 32-fold water hyacinth increase in May, evincing its propagation capacity. On average, the P. crassipes cover increased 6.2 ha/month, with a maximum increase of 149.6 ha registered in 2019 between May and June.
Source: Authors.
Figure 6 Monthly time series of small-scale VIs (a), large-scale VIs (b), precipitation (with daily values as gray bars, c), and cover of P. crassipes (d) from September 2018 to March 2020. Monthly precipitation was calculated from total daily ten-minute precipitation registered in Sabanalarga AUT IDEAM station [29045000].
Based on the previous section and Fig. 6, we can see that the more suitable indices which could potentially detect P. crassipes consistently, were Cl red edge, DVI, MCARI, and MSR according to the criteria of skewness, kurtosis, and consistency in their monthly time series. Together with NDVI, NDVI2, EVI, and TCARI, these indices showed consistent behavior throughout the study period, with reflectance increases occurring similarly to P. crassipes expansion periods. There were some exceptions in 2019 when decreases in water hyacinth coincided with increasing VIs (January and August), or vice versa (June).
The remaining indices: GNDVI, NDRE, OSAVI, and SR, had some reflectance peaks that were not observed in the other indices. In September 2018, GNDVI began to decrease, in contrast to the behavior exhibited by other VIs and to P. crassipes. On August 30, 2019, NDRE and GNDVI reflectance values peaked, in contrast to OSAVI which showed a marked decrease. In the case of SR, there was an atypical peak in October 2019.
P. crassipes cover was positively correlated with VIs (Table 4), with significant values mainly at 1 and 3-month lags. The higher correlations were obtained for 1-month lags with indices Cl red edge, MSR, NDVI, EVI, and NDVI2, with VIs leading water hyacinth behavior. Correlations for the same month were statistically significant only for NDVI and NDVI2. In Figs. 6c and 6d, the behavior of P. crassipes was similar to monthly precipitation time series, but it had an apparent delay, with increased water hyacinth cover occurring after periods of higher precipitation. This coincides with the correlation between precipitation and P. crassipes cover at a 1-month lag, with P. crassipes expansion periods occurring during months after increased monthly precipitation.
Table 4 Lagged cross correlations between P. crassipes cover and selected VIs. Precipitation is also included. Underlined numbers indicate the lag with higher correlation for each index. Only significant correlations at α = 0.05 have a number. Non-significant correlation values are indicated with ‘ns’.
| Monthly lagged correlations - P. crassipes area | ||||
|---|---|---|---|---|
| Index | No lag | 1 month | 3 months | 4 months |
| Cl red edge | ns | 0.60 | 0.50 | ns |
| MSR | ns | 0.60 | 0.49 | ns |
| NDVI | 0.49 | 0.59 | 0.53 | ns |
| EVI | ns | 0.59 | 0.55 | ns |
| NDVI2 | 0.51 | 0.58 | 0.53 | 0.49 |
| DVI | ns | 0.56 | 0.57 | ns |
| TCARI | ns | 0.48 | 0.51 | 0.54 |
| MCARI | ns | 0.51 | 0.51 | 0.52 |
| Precipitation | ns | 0.53 | ns | ns |
Source: Authors.
4. Discussion
4.1. Vegetation Indices for P. crassipes
16 VIs were evaluated for the detection of P. crassipes in the IHP reservoir (Antioquia, Colombia) based on their similarity to a normal distribution (skewness, kurtosis, presence of outliers) and the consistency in their monthly time series from September 2018 to March 2020. For the calculation of the studied indices, Sentinel-2 MSI bands within the range 559-832.9 nm were used, approximating to the more significant wavelengths for the detection of aquatic vegetation reported by Gaye et al. [22]. The improved accuracy of Sentinel-2 MSI for the detection of P. crassipes at river scale, compared to previous sensors, was studied by Thamaga et al. [23], resulting in even higher accuracies when using VIs instead of raw bands. The images resulting from VIs calculated in our study also evinced the usefulness of the Sentinel-2 sensor in the visual interpretation of water hyacinth invaded areas.
Cl red edge, DVI, and MSR probability density distributions were closer to a normal distribution and had a consistent time series when compared to other VIs. Additionally, Cl red edge and MSR monthly time series had the highest lagged correlations with the P. crassipes cover (0.60), leading increases or decreases in water hyacinth at 1 month lag. Though correlation does not imply causality, the increase in VIs reflectance values could improve the identification of water hyacinth cover that is more prone to rapid infestation in upcoming periods by detecting the physiological status of plants in a timely manner. Cl red edge and MSR have been related to chlorophyll concentration (Cl red edge [24]) and Fraction of Absorbed Photosynthetically Active Radiation - FAPAR (MSR [25]), both of which exert an influence in the primary productivity of ecosystems. DVI, on the other hand, is more closely related to biomass and LAI [26], thus being more (less) sensitive to the vegetation cover (physiological status). Hence, among the 16 indices analyzed, the combined analysis of Cl red edge, MSR and DVI is considered a good option for the timely detection of P. crassipes in the IHP reservoir.
NDRE, NDVI, and NDVI2 were characterized by probability density functions with negative asymmetry and high kurtosis, due, in part, to a clear separation between two reflectance ranges. The first range goes from 0 to 0.3 and can be related to several reflectance sources including sparse or senescing vegetation, soil in P. crassipes patches near the reservoir banks, or water turbidity [27]. The second range goes from 0.5 to 1 (except for NDRE where limits were lower) and corresponds to vegetation cover. In the case of EVI, although to a lesser extent, a negative asymmetry in reflectance values persists. The NDVI index has been widely applied, as it is simple to use and has shown good results in the detection of floating aquatic plants such as water hyacinth [28]. Nevertheless, the ambiguity of low NDVI values, and its high sensitivity to water quality parameters (e.g., turbidity, phytoplankton blooms), could underestimate the presence of water hyacinth or indicate its presence when it is absent [27]. These disadvantages make NDVI and related indices (NDRE, NDVI2) unsuitable for the accurate detection of water hyacinth in the IHP reservoir under the influence of the sediment-rich waters from the Cauca River.
In previous studies, the performance of MCARI was good compared to other VIs for the detection of floating macrophytes thanks to its relation with LAI [29]. In the IHP reservoir, both TCARI and MCARI had a consistent monthly behavior when compared to other VIs. However, the relatively low signal evinced in their monthly time series led to a weaker detection of changes in water hyacinth cover, and hence a lower capacity to identify areas more prone to rapid expansion. The low values of these indices in the IHP reservoir are caused by the spectral behavior of P. crassipes in the study site. Throughout the study period, changes in reflectance values of water hyacinth occurred mostly in bands 6 to 8A, TCARI and MCARI being the only VIs not considering these bands for calculation. The lack of significant changes in bands 3 to 5 could be related to the influence of water spectral signature, whose reflectance lowers with turbidity.
When TCARI and MCARI indices are combined with soil-line vegetation indices (OSAVI in this case), the ratios TCARI/OSAVI, MCARI/OSAVI, and their variations (with Sentinel-2 bands 5 and 6), became highly variable for the detection of P. crassipes. In previous studies, these combinations have been useful for increasing the sensitivity to chlorophyll content of vegetation even at low LAI values, and hence to improve the detection of vegetation during early growth stages considering the effects of soil reflectance [30]. For P. crassipes cover of the IHP, TCARI/OSAVI and MCARI/OSAVI resulted in relatively high reflectance values during periods of reduced water hyacinth cover (not shown), which are not consistent with the behavior of other VIs. In the case of TCARI/OSAVI [705, 750] and MCARI/OSAVI [705, 750], an apparently opposite behavior was recorded, with high values in one index occurring at low values of the other. The inconsistency of VIs involving soil-line VI for detecting P. crassipes in the reservoir could be related to the differences between water and soil reflectance spectra, exacerbated during periods of low vegetation cover. Additionally, the ratios with OSAVI drastically reduce the sensitivity of VIs to LAI effects [30], which is not desirable for the specific purpose of this study and evinces the limitations of these indices for detecting the spread of free-floating plants in the IHP reservoir.
The capability of the Sentinel-2 MSI multispectral satellite data to detect the spatial distribution of P. crassipes at reservoir scale was demonstrated. Sentinel-2 data were previously found to accurately detect and map seasonal water hyacinth distribution patterns in narrow river channels [31], thanks to the increased spatial resolution and the presence of unique and strategically positioned spectral bands [23,31,32]. However, further research is needed, first, to understand the VIs derived from the new generation of satellite sensors and to improve their results, and second, to fully explore the robustness of remote sensing in sustenance to water hyacinth management [23].
4.2. Multi-temporal distribution of P. crassipes
On average, the increases and decreases of water hyacinth cover per month from September 2018 to March 2020 varied by around 2.2 orders of magnitude (i.e., 2-fold increases or 50% decreases), meaning that control activities have been effective in reducing the P. crassipes cover at the same rate as its growth. The exception was the 32-fold increase from April 12 to May 22, 2019. This rise coincided with an upward trend in monthly precipitation during April and June. The atypical increase in P. crassipes cover in April was probably due to a river flood, which contributed to the spread of floating material. Although this was not detected by EPM control in its monthly Sentinel images, the control may have been effective for a short period between the dates of the images (between April 12 and May 22) but was not enough to avoid the increasing dispersion of water hyacinth under heavy rainfall, which continued until the end of July. Overall, even during periods of water hyacinth spread, the floating plants were prevented almost entirely from advancing further north from the municipality of Sabanalarga (i.e., towards Ituago, Toledo, and Briceño). Hence, the collection sites authorized in the environmental license have been able to control the expansion of P. crassipes to the area near the dam.
The relation between P. crassipes and precipitation was also evinced through the lagged correlation analysis, with precipitation leading water hyacinth behavior at 1-month lag (correlation = 0.53). Similar results were obtained in Lake Tana (Ethiopia) and the Greater Letaba river system (South Africa) [28,31], where increases in water hyacinth cover during the rainy and postrainy seasons were explained by high water levels enabling P. crassipes expansion toward shallow-water sections of the flood plain (rich in sediment deposits), as well as the increased input of nutrients by runoff. Our results confirm the important influence of the amount of precipitation on the effectiveness of controls for P. crassipes and highlight the need for differentiated control strategies during the dry and the rainy seasons. It is important to highlight that the positive influence of precipitation on P. crassipes expansion can be compounded when there are crops near or in the flood plain of a water body, leading to increases in water hyacinth cover also during the dry season [33]. Therefore, evaluating the spatial relation between P. crassipes expansion areas and the different land uses around those areas will shed light on additional management strategies at basin level.
4.3. Recommendations
The available Sentinel-2 MSI multispectral data are potentially useful for the monitoring of P. crassipes in the IHP reservoir at a very low cost. These data should be integrated as baseline information to EPM’s current control strategy, which involves field visits every 2 weeks, especially at the beginning of the rainy season when P. crassipes cover are likely to increase. It is also important to incorporate daily precipitation data as a potential indicator of upcoming floods and expansion of water hyacinth. Furthermore, evaluating the role of land uses in determining the presence of P. crassipes will help to find out why the highest concentration of macrophytes occurred in the reservoir’s central zone, in the municipalities of Buritica, Peque, and Sabanalarga.
Additional data acquisition involving Unmanned Aerial Vehicles can be used to verify remote sensed results, especially during phases of increased water hyacinth spread to obtain quality information in shorter periods. Field data collection to determine P. crassipes spectral signal under different phenological stages is also important for calibrating useful VIs identified from remote sensing. Such information could be synchronized to create an automatic mapping tool for water hyacinth cover in the reservoir and to use this as baseline data for macrophyte management. This information is of great importance for scientists, managers, and decision makers.
Given the fact that several VIs can be affected by water turbidity, information regarding water parameters of the Cauca River in areas with and without water hyacinth should also be integrated to remote sensing data analysis. These additional research efforts will improve the management of the reservoir, in order to guarantee greater quality of the water resource and mitigate future damage to the IHP’s hydraulic structures.
Linking this kind of studies conducted in different sectors, in this case, EPM and academia, will allow the simultaneous updating of new technologies, protocols and theoretical advances, while providing the opportunity to exchange ideas regarding strategic initiatives to solve environmental, social, and economic problems.
5. Conclusions
The reservoirs resulting from large-scale transformations of fluvial ecosystems become highly susceptible to the presence of invasive macrophyte species. In the IHP reservoir, P. crassipes has become a main concern given its rapid spread and its potential detrimental effects on the water body and the hydraulic infrastructure. Therefore, it is strategic to study the spatio-temporal distribution of P. crassipes, in order to implement appropriate control strategies. In this regard, Sentinel-2 MSI images and derived VI, specially within the 559-832.9 range, have been proven to be useful in the timely detection of water hyacinth, in virtue of their increased spatial resolution and their bands at the Red Edge and NIR wavelengths.
As a result of their sensitivity to LAI and chlorophyll content, as well as the consistency in their monthly time series and their probability density distributions being close to normal, the combined analysis of Cl red edge, MSR, and DVI is considered the best option among the 16 VIs studied for the detection of P. crassipes. In contrast, NDVI and related indices (NDRE, NDVI2) are not suitable for the accurate detection of water hyacinth in the IHP reservoir owing to the influence of the sediment-rich waters from the Cauca River.
The dispersion capacity of P. crassipes was demonstrated, especially during periods of heavy rainfall when effectiveness of control strategies can be largely diminished, and exponential increases of water hyacinth are expected, as was the case during April - June 2019 in the IHP related to river floods. The highest monthly lagged correlations (0.60) with P. crassipes cover corresponded to the Cl red edge and MSR VIs, which led increases or decreases in water hyacinth by 1 month. Thus, the increase in VI reflectance values could improve the identification of water hyacinth areas that more prone to rapid infestation in upcoming periods by detecting the physiological status of plants in a timely manner.
No funding was received for carrying out this study. The authors have no conflicts of interest to declare that are relevant to the content of this article. All authors read and approved the final manuscript.

