1. Introduction
According to [1] age was found to be closely linked to thermal comfort related behavior, and hence influences heating energy consumption. Existing research indicates a positive relationship between occupant age and heating energy consumption in most studies. Generally, older households tend to consume more energy for space heating than younger households, as older occupants prefer a warmer indoor environment and use heating for longer hours
Findings of a study [2] carried out in Mexico that found that young people use more technologically efficient devices and are more energy efficient also corroborate the results of this study.
According to 2035 National Energy Efficiency Plan , the accumulated energy consumption of the residential, commercial and public sectors is projected to be reduced by at least 88.8 MMboe, due to energy efficiency measures implemented with the main objective that proposes to establish mechanisms for monitoring and control for the implementation and enforcement of the NEC (by its Spanish acronym) (Energy Efficiency, Air Conditioning and Renewable Energy Chapters) at the level of the GADs (by its Spanish acronym, Decentralized Autonomous Government.
According to the actual conditions it is necessary to know the relation between age of users subscribed to the EEQ and the electric energy consumption by household in the context of the curfew measures dictated by the national COE (Emergency Operation Center).
Therefore, it is proposed to analyze if the energy consumption of the Barrio San Agustin EEQ’s subscribers is related to the age in the context of curfew measures in the Pichincha Province during COVID-19 times.
The analysis is based on the energy consumption data of the residential users of the Barrio San Agustin EEQ, the data was extracted from the “Empresa Electrica Quito” (Quito Electric Company) databases, after applying a curvilinear regression an estimated consumption by the average age users of the residential subscriptions to Barrio San Agustin was obtained, for before and after the WHO declared the COVID-19 as a global pandemic and the national COE dictated the curfew measures and the lockdown comparing the years 2018 2019 2021 with the 2020.
Finally, it is considered that the estimate of the age group that has the highest monthly power consumption will allow to address awareness campaigns on saving and conscious power consumption with better results, and this will serve as a tool to EEQ and MERNNR (by its Spanish acronym) (Ministry of Energy and Non-Renewable Natural Resources) to plan actions and meet energy efficiency goals.
2. Literature revision
2.1. Electric power demand in Ecuador
According to the National Energy Balance 2019, power consumption per person between 2009 and 2019 showed an increase of 39.4%, from 1,088 kWh per inhabitant to 1,517 kWh per inhabitant. In this document prepared by the Ministry of Energy and Non-Renewable Natural Resources (MERNNR) and the Institute of Geological and Energetic Research (IIGE, by its Spanish acronym), it can be seen that power consumption per inhabitant increased by 2% between 2018 and 2019, from 1,488 kWh per inhabitant to 1,517 kWh per inhabitant. [4]
2.2. E.E.Q. concession area
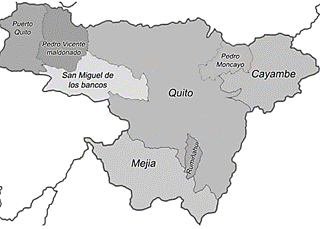
According to its foundation documents, E.E.Q. has as a fundamental objective to provide electric services to the designated concession area the Pichincha Province as you can see in Fig. 1. Following the Legal Regime Law for the Electric Sector. [5]
The concession area of the “Empresa Electrica Quito” covers the cantons: Quito, Pedro Moncayo, Cayambe, Rumiñahui, San Miguel De los Bancos, Pedro Vicente Maldonado, Puerto Quito, the concession area is shown in Fig 1. [5]
2.3. Age of Barrio San Agustin subscribers
As a result of the survey conducted for each family that has an electricity meter in the San Agustin neighborhood, Table 1 shows the percentage of subscribers according to the proposed age range.
2.4. Responsive measures dictated by the National COE due to COVID-19 health emergency
On 03-11-2020 the WHO declared the COVID-19 as a pandemic, following this, through the Ministerial Mandate Letter No 00126-2020 issued in the same date by the Health Minister, a Public Health Emergency is declared nationwide.
The national government designed a strategy to prevent a community spread in the country which represents the main risk. These measures have as their purpose to incentivize the consciousness and responsibility in the citizens, in order to prevent a wider and faster spread of the virus and contain its impact. [6]
Between all the mobility restrictive measures that the National COE dictated involving the Pichincha province, for this study there are ten main months from March The cancelation of academic activities, remote jobs no presential academic activities and remote labor are emphasizes until the month of November.
3. Electric energy consumption on the Cotopaxi province during COVID-19 times
The Pichincha province is one of the 24 provinces that make up the Republic of Ecuador, located in the central north of the country, in the geographical area known as the inter-Andean region or mountain range, mainly on the Guayllabamba basin in the east and sub-Andean ramifications in the northwest. Its administrative capital is the city of Quito. The Pichincha territory is inhabited by 3,228,233 people, according to INEC's (by its Spanish acronym) demographic projection for 2020, making it the second most populated province in the country after Guayas. The Pichincha province is made up of 8 cantons, with their respective urban and rural parishes. [7]
The Mejia canton is located at the south of the Pichincha province. Its municipal capital is the city of Machachi, place inhabited by 36,740 people. San Agustin La Libertad is a neighborhood located in the province of Pichincha, north of the city of Machachi [7].
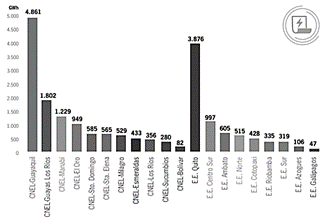
As can be seen in Fig. 2, there is a high power consumption demanded by the concession area of the E.E.Q.
Source: A. de regulación y control de Electricidad, 2018.
Figure 2 Energy consumption by Electric Company of Ecuador.
The behavior of consumption of electrical energy before and after the pandemic of Barrio San Agustin subscribers is described next.
3.1. Electric Energy Consumption for Barrio San Agustin subscribers before COVID-19
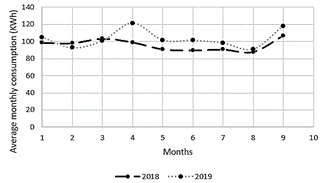
Fig. 3 shows the electric energy consumption tendency for the Barrio San Agustin users in Pichincha from the month of March to November for the years 2018 and 2019. After analyzing this data and average monthly consumption was calculated for every user, 96.13 KWh for 2018 and 103.32 KWh for 2019.
Source: The author.
Figure 3 Electricity consumption trend 2018-2019 Barrio San Agustin subscribers.
In Table 2, consumption is assigned to a consumption stratum of 50 to 120 KWh per month to delimit subscribers with similar consumption behavior.
3.2. Electric Energy Consumption for Barrio San Agustin subscribers after COVID-19
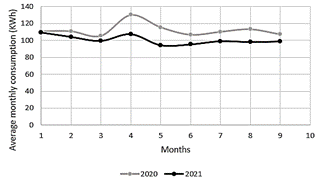
Fig. 4 details the consumption tendency from the month of March to November for the years 2020 and 2021 for the Barrio San Agustin users. After analyzing this data, the average consumption per user is 112.14 KWh for 2020 and 100.57 for 2021
Source: The author.
Figure 4 Electricity consumption trend in COVID-19 of Barrio San Agustin subscribers.
In Table 3, consumption is assigned to a consumption stratum of 50 to 100 KWh per month to delimit subscribers with similar consumption behavior.
4. Methodology
In order to analyze the variation of power consumption of the users of San Agustin neighborhood, the data collected from the EEQ database is tabulated.
Subsequently, on-site surveys of the ages of the subscribers of each electricity meter are carried out.
Thereafter, a study stratum is considered to group common subscribers according to the amount of power consumed and to discard inactive subscribers with a limit of 50 to 120 KWh. To apply this consumption limit, the year of study 2020 is taken as a reference, the average age is calculated for each electricity meter, then an independent (average age of subscribers for each electricity meter) and dependent (monthly KWh consumption of subscribers of stratum D of the San Agustin neighborhood) correlation model is used between the variables studied. The correlation model used in this study, according to the conditions of the relationship between the variables, is curvilinear regression, taking Spearman's value as a significance reference.
A period of time where the national COE announced mobility restrictions, academic activities were cancelled and teleworking was emphasized from March to November is considered for the study, and subsequently compared with previous years and a year after the same period where these measures did not exist.
5. Results and analysis
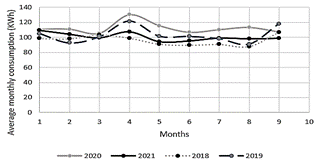
The first result obtained in the analysis of power consumption behavior is shown in Fig. 5. The average consumption from March through November in the curve for 2020 exceeds those in the curves for 2018 and 2109, before curfew measures were enacted, and is also higher than that for 2021, when we continued under pandemic conditions, but no restrictive mobility and confinement measures were put in place.
Source: The author.
Figure 5 Consumption trend comparison 2018 2019 and 2020 in COVID-19 PEC subscribers .
The percentage increase rate of stratum D for the period between March and November 2019 and 2020 has a value of 8.54% and it is shown in Table 4.
Table 4 Electricity consumption increase rate March-November 2019 and 2020 in COVID-19 of Barrio San Agustin subscribers by strata.
| Strata | Average monthly energy consumption KWh march-november 2019 | Average monthly energy consumption KWh march-november 2020 | Rate of increase (%) |
|---|---|---|---|
| D | 103.32 | 112,145 | 8.54% |
Source: The author
The percentage increase rate of stratum D for the period between March and November 2020 and 2021 has a value of -11.5% and it is shown in Table 5.
Table 5 Electricity consumption increase rate March-November 2020 and 2021 in COVID-19 of Barrio San Agustin subscribers by strata.
| Strata | Average monthly energy consumption KWh march-november 2020 | Average monthly energy consumption KWh march-november 2021 | Rate of increase (%) |
|---|---|---|---|
| D | 112.145 | 100.576 | -10.31% |
Source: The author
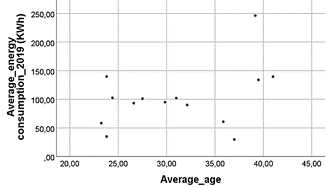
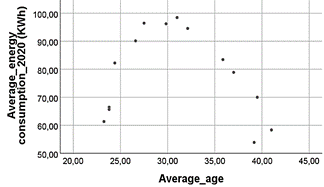
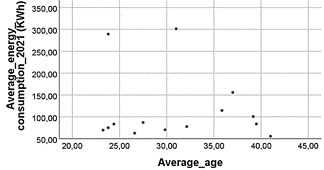
Figs. 6-8 show the relationship between average age and monthly power consumption of subscribers in San Agustin neighborhood in 2019, 2020 and 2021. The results of the graphs show the relationship between the aforementioned variables in 2020 with a significance of 0.097 after applying the regression method with the Spearman's coefficient for curvilinear regression; however, for 2019 and 2021 the correlation coefficients have a significance of 0.295 and 0.117, respectively, and in 2019 there is no relationship between the variables studied.
6. Conclusions
It is found that there is a relationship between the average age and monthly power consumption in users of San Agustin neighborhood in 2020 in conditions of confinement and teleworking decreed by the national COE, reaching a significance of 0.097. According to the results, the group that reaches the peaks of power consumption from March to November 2020, corresponds to an average age of 27 to 33 years old and the average age groups that show the lowest average consumption are those ranging from 20 to 25 and 40 to 45 years old. However, for 2021, although the pandemic continues, the 27 to 33 age group shows a drastic reduction. This may be due to the fact that the restrictive mobility and confinement measures for 2021 were mostly eliminated and most of the subscribers returned to their on-site jobs.
It is concluded that in 2020, the average residential power consumption of San Agustin neighborhood from March to November in relation to the same period in 2019, increased at a rate of 8.54%. Also, that the average residential power consumption of San Agustin neighborhood from March to November in 2021 compared to 2020, was reduced at a rate of -10.31%.
For future work, it is suggested that an analysis be made to take into account more variables related to the power consumption behavior of subscribers, considering the activities to which each age group is dedicated, this would explain why in 2021 there is a violent reduction in consumption in the age groups that show peaks in 2020. This could be due to the fact that this group is dedicated to working outside their homes most of the day and in conditions of confinement, as established in 2020, this group shows peaks and a less efficient use of electricity.
It is suggested to carry out an analysis in the other provinces to obtain data in the most populated areas of the country and to go up to a study at the national level that will be very useful for the national COE to consider the incidence in home electricity consumption in restrictive measures of curfew.


