


 English (pdf)
 Article in xml format
 Article references
 Send this article by e-mail
 Cited by SciELO
  Cited by Google
  Similars in
SciELO
Similars in
SciELO  Similars in Google
 Permalink
1. Introduction
Logistics has become one of the most important forces of business competitiveness, as well as logistics companies one of the most promising services [14]. Transportation is a critical link within logistics. An efficient and economical transportation system contributes to greater competitiveness in the market, greater economies of scale in production and lower prices for goods. The whole process is about creating value: value for the company's customers and suppliers, and value for the company's shareholders [4].
Generally, a single production company is not capable of controlling the entire distribution channel of its product, from the source of raw materials to the final consumer products [4,5], and therefore, there are logistics operators and marketing companies.
Regardless of the type of company, there are two fundamental methods for the transportation of products: with the company´s own fleet or by subcontracting the transportation service. As long as the company has its own fleet, its ability to generate profits will depend on the availability of its vehicles. The deterioration of the technical condition of the vehicles limits the generation of profits. Therefore, knowing to what extent the impact of the deterioration of the technical condition of the vehicle on the economic result is permissible for the company is of great importance, since it would allow it to identify the vehicles that are facing a decision-making situation such as replacement, proactive maintenance, operation scheduling, among others. The role played by the company with its own fleet in the logistics chain determines the contribution of the use of vehicles to the economic result.
Condition-based maintenance (CBM) is a form of maintenance that focuses on monitoring assets degradation through condition indicators [1], it is defined as the tracking of one or more significant parameters to model the performance of the considered systems that allow identifying changes potentially linked to future failures [22], showing the functional capacity of the assets and enabling decision making. It is considered the best maintenance strategy to adopt when degradation can cause significant economic losses [22] as the loss of the asset's working capacity adversely impacts the company's economic result.
Recent contributions related to CBM in the logistics environment have been aimed at the joint optimization of maintenance and logistics processes. Such is the case of Jing et al. (2017) optimizing aircraft maintenance and spare parts inventory utilization, Hwang and Samrat’s [13] review on joint optimization of maintenance and production planning and manufacturing system spare parts, Regattieri et al. [22] work aimed at the integration between aircraft failure and repair process or the decision model proposed by Liu et al. [15] linking predictive maintenance decisions and production planning decisions. CBM has also been linked to statistical process control in supply chains [29]. The most commonly used optimization criterion or control limit is cost [22]. Cost-benefit analysis [2] and, to a lesser extent, utility [16] have been used. The application of CBM is further distinguished by the complexity of mathematical models, the need for abundant data, expensive instrumentation and data processing systems and highly qualified personnel [7, 27, 26, 22] that limit the application of CBM to real situations. According to Quatrini et al [21], there is currently an increasing trend in CBM research in transportation; however, the relationship between the degradation of the transportation means and the economic outcome of its operation in the logistics environment has been barely addressed.
In the case of Penabad Sanz et al. [20] they use vehicle degradation monitoring in real environments characterized by strong economic constraints, low technological level and low data availability. They adopt availability as a condition indicator (CI) and the balance between favorable and unfavorable impacts on the economic outcome as a control limit in company’s fleets, which participate in the logistics chain as transport service providers without outsourcing. This allows classifying the vehicle operation as admissible or inadmissible, according to the impact on the economic result of the logistics company and also allows identifying the presence of decision-making situations associated with the operation and maintenance of the fleet.
The objective of this study is to propose the monitoring of the degradation of the vehicles of a company that participates with a combination of roles in the supply chain, with the use of the availability indicator, of the control limit based on the balance of the impacts on the economic result of the operation of the vehicles and considering the influence of subcontracting the transport service, as a way to identify the vehicles that impact positively or negatively on the economic result of the entity and with it the detection of opportunities for improvement.
2. Impact on the economic performance of vehicles according to their role in the logistics chain
Distribution is the marketing and transportation of products to consumers and refers to the set of strategies and processes for moving products from the point of manufacture to the point of sale [10]. Marketing, on the other hand, refers to the activities that ensure that the product is at the place, at the time, at the price and in the quantity required, thus ensuring profitable sales [17] by making the product available to consumers [3]. Transportation in marketing companies is divided into two stages: primary distribution and secondary distribution [18], using at all times the modes of transportation available either with its own fleet and/or subcontracted service. All the loads transported by the companies that participate in the logistics chain in the role of marketer are their own, since they are products acquired by them for sale. Transportation contributes to the economic result in the form of savings if the products are transported by own means of transport [6] or expenses if they are transported by subcontracted transport services (see Table 1).
Table 1 Linkage of transportation with the economic result of the entity according to the role in the supply chain.
| Logistics chain role | Ownership of the cargo | Transport mode | |
|---|---|---|---|
| Own fleet | Outsourced | ||
| Marketer | Own | Saving | Outsourcing expense |
| Logistics operator | External | Profit | Profit |
Source: The authors
The logistics operator basically offers two main services: warehousing and transportation of products. Over time, it has added a series of complementary or immediate services that are designed within the supply chain on customers´ request, such as customs services, repackaging, labeling and packaging, among others. Transportation services can be offered equally by own means or outsourced services [18] from the point of departure at origin to the point of arrival at destination [11]. Unlike a trader, the logistics operator does not own the cargo it transports, and the economic result is the profit generated by the trips made for the transportation of the client's cargoes (see Table 1).
Companies taking part in the distribution chain with more than one role (marketer and logistic operator) with their own fleet base it economically on obtaining higher profits, as long as it ensures the delivery of the product, which does not generate cost overruns due to idle times. Therefore, if a company participates with both roles in the supply chain, then the benefits generated by having its own fleet will be given by the combination of savings in the transportation of its own cargo and the utility in the transportation of other companies' cargo. However, it is difficult to satisfy the totality of the demand with own means, so in these cases it is also possible to subcontract the service.
In this sense, there is a close relationship between the condition of the vehicle and its impact on the economic result (Fig. 1). Whenever a company performs both roles, a cargo vehicle in good condition (available) will be in working condition, so that if there is demand for transportation, a cargo will be assigned to it and the vehicle will be in working condition, and its impact on the organization's economic result will be in the form of economic benefit, either as savings in the case of the marketing role or as profit in the case of the logistics role.
Source: The authors
Figure 1 Relationship between the condition of the vehicle and the impact on the economic result.
If the technical condition of the vehicle does not allow it to perform any activity, then it is out of service. The impact on the economic result of the organization is in the form of an adverse economic impact because the fixed costs are maintained and if there is a demand for transportation (both own and external), it is necessary to subcontract the service, incurring an outsourcing expense. The effect of the latter is reduced in the role of logistics operator because it also produces an income, so the impact is lower. In addition, there is an opportunity cost, since savings or profits are not generated depending on the origin of the cargo.
3. Components of the CBM
Monitoring system degradation requires three initial definitions: the CIs to be monitored, the inspection frequency, and the CI control limits beyond which asset operation is not permissible [23].
In the framework of logistics services, the indicator that characterizes the technical condition of the cargo transport vehicle is the availability. This indicator is widely used and decreases as the deterioration of the asset increases. The availability indicator quantitatively summarizes the functionality profile of an element and in practice is expressed, as the proportion of time the system is available to operate or produce [18], that is, the vehicle is in a technical condition allowing it to fulfill its function. In this sense, low levels of vehicle availability imply the degradation of the technical condition of the vehicles, which is directly reflected in the logistics process.
Inspection frequency according to Alaswad and Xiang [1] is divided into three fundamental variants: continuous, with fixed interval and with variable interval, agreeing with several authors [15,24,12]. Zhao et al. [28] present a model in which the system degradation is influenced by the inspection frequency, both positively and negatively, and warn about the periodicity of inspections stating that after each inspection, the system degradation grows instantaneously according to a random value. However, as the availability indicator is an indirect CI [20] its evaluation does not influence system degradation so the same frequency usually used in companies (daily, monthly and annually) can be used.
The availability control limit is given by the equilibrium point between the economic benefit for the vehicle work (EB) and the economic damage produced by the time without working (ED), according to what has been explained by Penabad Sanz et al. [19]. These authors defined this point as rational use limit.
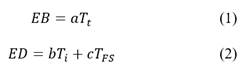
The time of work of a vehicle generates economic benefits, while the time out of service influences negatively, causing an economic damage. The economic benefit generated by the work of a vehicle in a given period depends on the daily benefit for working a and the time worked Tt of the vehicle according to eq. (1), while the economic damage is generated when the vehicle is in the states: inactive and out of service and is calculated as shown in eq. (2):
Where:
a aTt: Daily economic benefit when the vehicle is in the working condition. $/d
b: Daily economic damage when the vehicle is in the inactive state. $/d
c: Daily economic damage when the vehicle is in the out-of-service state. $/d
Ti: Time of inactivity, d
TFs: Time out of service, d
The relationship between these times in a given period can be seen in eq. (3).
When transforming the rational use limit expression with the availability indicator, the following control limit eq. is obtained:

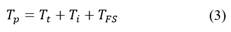
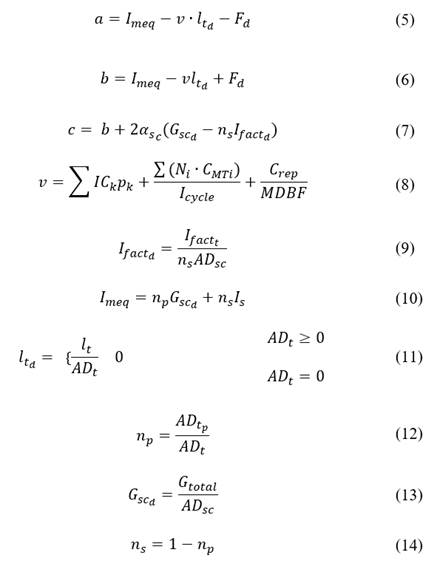
Where αtLIM is the limit availability, a, b, c parameters of the function and αs the output coefficient and constitutes the independent variable. The expression (4) represents the rational use limit, that is, the equilibrium between EB and ED. The expressions from (5) to (14) allow to calculate the function parameters for a set of vehicles assuming that equal vehicles operating in the same context have the same control limit. This expression includes the effects associates to the combinations of roles and the outsourcing influence.
Where:
Imeq: average equivalent revenue of the vehicle pool, $/d.
v: unit variable cost of operating the set of vehicles, $/km.
ltd: average daily distance traveled by the set of vehicles, km/d.
Fd: daily fixed costs of the vehicle pool, $/d.
αsc: probability that there is load when the vehicle is out of service.
Gscd: average daily expenditure for subcontracting a vehicle of the same capacity as the block, $/d.
ns: probability that the transportation is related to an external load.
Ifactd: average daily revenue billed for the service provided, in the role of logistics operator, $/day.
np: probability that the transportation is related to own cargo.
Is: revenue for service related to someone else's cargo.
ADt: number of days worked by vehicles in a period, d.
Gtotal: total expenses related to the outsourcing of transportation activity, $.
ADsc: number of days worked, in the role of logistics operator, by the vehicles related to the outsourcing of the transportation activity in a period, d.
ADtp: number of days worked, in the marketing role, by vehicles in a period related to own transports, d
ADts: number of days worked, in the role of logistics operator, by vehicles in a period related to service transports, d
lt: total distance to be traveled by vehicles in the planning period, km.
k: operating materials (fuels, tires and batteries).
ICk: consumption standard of operating material k, k/km.
pk: price of operating material k, $/unit of material k.
i: i-th type of maintenance.
Ni: number of i type maintenance works performed in a maintenance cycle.
CMTi: cost of maintenance type i, $.
Icycle: maintenance cycle, km.
Crep: average repair cost, $.
MDBF: mean distance between failures, km.
4. Application of the proposal to a real situation
The application is carried out for the analysis period of one year. The procedure implemented was as follows:
Segmentation of the fleet into homogeneous blocks according to the characteristics of the vehicles and the operational context.
Calculation of the model parameters for each block from the planning data for the period, thus obtaining the function αtLIM. Expressions from (4) to (14) are used.
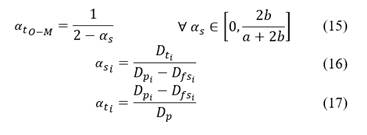
Classification of vehicles through the graphical method. The classification into acceptable or unacceptable operation is performed using the Rationality State Graph (RSG) [21] of freight vehicles. This graph is shown in Fig. 2. In this graph, the continuous curve represents the limit availability function according to eq. (4), the dashed curve represents the border between operation, and maintenance given by expression (15) in which αs is the independent variable as it is in (4). The classification requires that the coordinated pairs (αsi;αti) of each vehicle be located in the graph. Both indicators (αsi and αti) are calculated through expressions (16) and (17).
Where:
αt0-M: Availability at the operation and maintenance border. According to Penabad Sanz [20], for all the points of this function it is fulfilled that the inactive time is equal to the out-of-service time. This allows separating the prevalence of each of these times in the vehicle out-of-service time.
α si : output coefficient of the i-th vehicle
α ti : availability indicator of the i-th vehicle
D ti : Number of days worked by i-th vehicle in the period, d.
D fsi : Number of days out of service of i-th vehicle in the period, d.
Dp: Number of days in the period, d.
The classification matches the names of each zone. That is, a vehicle that is in the acceptable use zone is classified as a vehicle with acceptable operation, which means that it has a favorable impact on the economic result (EB ≥ ED). If it is in the unacceptable use zone due to maintenance, then it impacts unfavorably on the economic result (EB < ED) and out-of-service time prevails over non-working time (out-of-service time is greater than inactive time). Likewise, if the vehicle is in the zone of unacceptable use by operations it means that it also impacts unfavorably on the economic result but the inactive time is the one that prevails in the time without working (inactive time is greater than out of service time).
In this way, the vehicles that unfavorably impact the economic result are identified, which determines the existence of opportunities for improvement. However, through the proposed method, inferences are made about the economic result of vehicle operation based on the monitoring of the availability evaluated on the time scale, so it was considered pertinent to verify the correspondence between the results of the availability evaluation and the real impact on the economic result of vehicle operation. For this purpose, the concordance analysis was used, which allows quantifying the coincidence between two classifications [9]. The steps followed were:
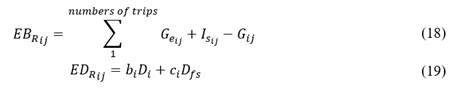
1. Calculation of the real benefits for work (EBR) and the real damage for time without working (EBR) of each vehicle from the primary data (operation and maintenance records) according to expressions (18) and (19).
Where:
i: represents the i-th block.
j: represents the j-th unit (vehicle).
Geij: Avoided expenditure as marketer of unit j of block i, in the study period, $.
Isij: Revenue from transportation of cargo related to a service of unit j of block i, in the study period, $.
Gij: Direct expenses associated with the operation of unit j of block i, in the study period, $.
Classification of vehicles according to the corresponding level. If EBR ≥ EDR then the impact is favorable, if, on the contrary EBR < EDR then the impact is unfavorable.
Quantification of the coincidences and discrepancies in the classification of the units by both routes. The results are summarized in the contingency table (Table 2).
Table 2 Contingency table. Source: The authors
| Evaluation of the availability | Impact on the economic result | Total | |
|---|---|---|---|
| Favorable | Unfavorable | ||
| Operation acceptable | n 1 | n 2 | n 1 + n 2 |
| Operation unacceptable | n 3 | n 4 | n 3 + n 4 |
| Total | n 1 + n 3 | n 2 + n 4 | N |
Source: The authors
Where:
n 1 : Number of vehicles with positive results in both evaluations.
n 2 : Number of vehicles where the impact on the economic result is unfavorable while the availability assessment is acceptable operation.
n 3 : Number of vehicles with a favorable impact on the economic result while the availability assessment is unacceptable operation.
n 4 : Number of vehicles having negative results in both evaluations.
N: Total number of vehicles evaluated.
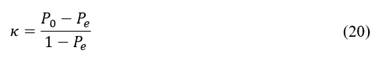
Evaluation of the degree of agreement between the factors, calculated through the kappa measure (κ) [25].
Where:
P0: Proportion of observed matching.
Pe: Proportion of expected random matching.
1 - Pe: Maximum possible agreement or matching not due to chance.
The interpretation of the κ result is shown in Table 3.
Table 3 Rules for evaluating the degree of agreement
| k | Dimension of the agreement |
|---|---|
| 0 | Poor |
| 0.00-0.20 | Small |
| 0.21-0.40 | Medium |
| 0.41-0.60 | Moderate |
| 0.61-0.80 | Considerable |
| 0.81-1.00 | Almost perfect |
Source: [8]
For the purposes of this paper, the proposed method is considered to be accepted as valid if k ≥ 0.61, which means that the degree of agreement is considerably higher with respect to what might be expected due to chance.
4.1 Data
The fleet under study is composed of 31 vehicles with the attributes shown in Table 4 and which are used in the primary distribution of drugs (marketer role) and the transportation of supplies to laboratories for drug production (logistics operator role). When it is not possible to meet the demand for transportation of both own loads (drugs) and external loads (supplies to pharmaceutical laboratories), transportation is outsourced.
Table 4 Fleet characteristics.
| Make | Model | Engine | Capacity (t) | Number | Years of operation |
|---|---|---|---|---|---|
| VW | 18310 | 6C3AA8.220 | 30 | 4 | 12 |
| VW | 17220 | 6C3AA8.3 | 10 | 16 | 12 |
| Freightliner | FLD120 | CUMMINS M11 | 25 | 5 | 25 |
| Hyundai | HD-120 | WEICHAI N4102QB2 | 8 | 2 | 10 |
| Howo | HOWO | WEICHAI WD615,62 | 3.5 | 2 | 2 |
| Howo | HOWO | D6AB | 8 | 2 | 2 |
Source: The authors
In the calculation of αtLIM parameters, data extracted from operation and maintenance records (bills of lading, maintenance work orders and economic reports), in one year of work, were used. In the specific case of operational data, fleet control records were used. For the analysis of the results, the blocks with more than two vehicles in their structure were selected.
5. Results
As a result of the application of the procedure, the relevant criteria for the grouping of the vehicles are: the model and its load capacity, since the level of planned activity and the time in operation are the same for each model, so they are not subdivided.
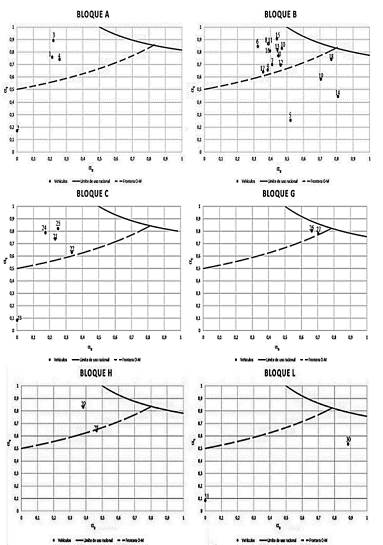
The fleet was segmented into six homogeneous blocks (A, B, C, G, H, and L) corresponding to each model and load capacity of the vehicles as shown in Table 5. This table also shows the calculated values of the parameters of the αtLIM function corresponding to each block. The values of αti and αsi for each vehicle are shown in Table 6 and were used for the location of these in the corresponding graphs (Fig. 3).
Table 5 Key variables corresponding to each block.
| Blocks | Model | Capacity | Imeq | v | It | Fd | α | b | c |
|---|---|---|---|---|---|---|---|---|---|
| A | 18 310 | 30 | 518.98 | 0.4 | 69886.4 | 3.67 | 371,8 | 375,55 | 667,9 |
| B | 17 220 | 10 | 3612.6 | 0.3 | 793723 | 3.67 | 3451,1 | 3454,8 | 7324,6 |
| C | FLD120 | 25 | 5235.5 | 0.55 | 89 618 | 3.67 | 4988,32 | 4991,99 | 7581,4 |
| G | HOWO | 3.5 | 3205.2 | 0.52 | 53262 | 3.67 | 3132,10 | 3135,77 | 7611,3 |
| H | HOWO | 8 | 3138.9 | 0.65 | 105469 | 3.67 | 2864,21 | 2867,88 | 6307,1 |
| L | HD-120 | 8 | 3663.9 | 0.36 | 34609 | 3.67 | 3611,48 | 3615,15 | 10518,3 |
Source: The authors
Table 6 Coordinates for graphic representation.
| Blocks | Vehicle (i) | α ti | αs i |
|---|---|---|---|
| A | 1 | 0,76 | 0,21 |
| 2 | 0,17 | 0,00 | |
| 3 | 0,89 | 0,22 | |
| 4 | 0,74 | 0,26 | |
| B | 5 | 0,26 | 0,52 |
| 6 | 0,85 | 0,32 | |
| 7 | 0,70 | 0,41 | |
| 8 | 0,87 | 0,39 | |
| 9 | 0,66 | 0,38 | |
| 10 | 0,83 | 0,47 | |
| 11 | 0,87 | 0,38 | |
| 12 | 0,70 | 0,46 | |
| 13 | 0,82 | 0,44 | |
| 14 | 0,44 | 0,81 | |
| 15 | 0,91 | 0,44 | |
| 16 | 0,81 | 0,40 | |
| 17 | 0,64 | 0,35 | |
| 18 | 0,74 | 0,77 | |
| 19 | 0,58 | 0,70 | |
| 20 | 0,77 | 0,45 | |
| C | 21 | 0,74 | 0,23 |
| 22 | 0,63 | 0,33 | |
| 23 | 0,08 | 0,00 | |
| 24 | 0,79 | 0,17 | |
| 25 | 0,82 | 0,25 | |
| G | 26 | 0,81 | 0,66 |
| 27 | 0,78 | 0,70 | |
| H | 28 | 0,64 | 0,46 |
| 29 | 0,83 | 0,38 | |
| L | 30 | 0,54 | 0,88 |
| 31 | 0,08 | 0,00 |
Source: The authors
The classification obtained from the graphs is presented in Table 7.
Table 7 Classification of vehicles.
| Blocks | Vehicle | Operation | Unacceptable for |
|---|---|---|---|
| A | 1 | Unacceptable | Maintenance |
| 2 | Unacceptable | Operations | |
| 3 | Unacceptable | Operations | |
| 4 | Unacceptable | Operations | |
| B | 5 | Unacceptable | Maintenance |
| 6 | Unacceptable | Operations | |
| 7 | Unacceptable | Operations | |
| 8 | Unacceptable | Operations | |
| 9 | Unacceptable | Operations | |
| 10 | Unacceptable | Operations | |
| 11 | Unacceptable | Operations | |
| 12 | Unacceptable | Operations | |
| 13 | Unacceptable | Operations | |
| 14 | Unacceptable | Maintenance | |
| 15 | Unacceptable | Operations | |
| 16 | Unacceptable | Operations | |
| 17 | Unacceptable | Operations | |
| 18 | Unacceptable | Maintenance | |
| 19 | Unacceptable | Maintenance | |
| 20 | Unacceptable | Operations | |
| C | 21 | Unacceptable | Operations |
| 22 | Unacceptable | Operations | |
| 23 | Unacceptable | Maintenance | |
| 24 | Unacceptable | Operations | |
| 25 | Unacceptable | Operations | |
| G | 26 | Unacceptable | Operations |
| 27 | Unacceptable | Operations | |
| H | 28 | Unacceptable | Maintenance |
| 29 | Unacceptable | Operations | |
| L | 30 | Unacceptable | Maintenance |
| 31 | Unacceptable | Maintenance |
Source: The authors
Table 8 shows the EB and ED values for each vehicle and their impact on the entity's economic result. The coincidences and discrepancies in the classification of the units by both methods and the degree of agreement obtained for each block are shown in Table 9, complying with points from 4 to 7 of the procedure.
6. Discussion
In Table 5, showing the calculated values of the parameters of the function αtLIM for each block, it is observed that for all the blocks the values of 𝑎 are greater than 0, which means that the operation of the fleet vehicles generates profits that are given fundamentally by the savings due to the avoided subcontracting operations. Therefore, in relation to direct expenses, the existence of an own fleet is economically justified. It can also be observed that the values of 𝑎, 𝑏 and 𝑐 of block A are the lowest when they are the vehicles with the highest load capacity. This is due to the fact that blocks B, C, G, H have refrigerated vans, for which the transportation rates are higher in both roles and with it the values of a, b and c.
The coordinates for the graphical representation are shown in Table 6, the values of αsi indicate the level of utilization of the days in good condition, while the values of αti indicate the level of availability presented by the vehicles in the analyzed period.
The 100 % of the vehicles is evaluated with unacceptable operation therefore their impact on the economic result of the entity is negative (see Table 7).
The graphs of Fig. 3 and Table 7 show that 22 vehicles (70.97 %) are located in the zone of unacceptable use by operations. This suggests low levels of utilization that may be linked to planning problems and the organization of load distribution. Only 9 vehicles (29.03%) are located in the unacceptable use zone due to maintenance, despite the fact that the vehicles are more than 10 years old. This is contrary to the generally accepted criterion that maintenance is responsible for the damages caused by the time vehicles are out of work, especially in vehicles with many years of operation.
Regarding the real economic impact (Table 8), 96.77% of the total fleet under study is evaluated as unfavorable, except for vehicle 3. The presence of vehicles with negative EB values (2, 23 and 31) indicates that they generated losses. Since the vehicles are not used in the transportation of cargo, either own or third party, no savings are generated by the transportation of own cargo or profit by the transportation of third-party cargo, therefore, it is reflected in the form of economic loss.
Table 8 Evaluation of the break-even condition.
| Blocks | Vehicles | EB, $ | ED, $ | Impact on the economic result |
|---|---|---|---|---|
| A | 1 | 162112,16 | 162250,48 | Unfavorable |
| 2 | -22748,30 | 249016,76 | Unfavorable | |
| 3 | 287691,56 | 179042,18 | Favorable | |
| 4 | 132762,73 | 190673,30 | Unfavorable | |
| B | 5 | 86678,94 | 2301841,70 | Unfavorable |
| 6 | 268331,02 | 1121486,10 | Unfavorable | |
| 7 | 245320,02 | 1162864,79 | Unfavorable | |
| 8 | 336816,35 | 1007384,95 | Unfavorable | |
| 9 | 264086,53 | 1412032,21 | Unfavorable | |
| 10 | 288255,79 | 1027069,70 | Unfavorable | |
| 11 | 388156,60 | 1000128,54 | Unfavorable | |
| 12 | 258114,98 | 1343299,93 | Unfavorable | |
| 13 | 276815,13 | 1080668,88 | Unfavorable | |
| 14 | 146145,31 | 2228909,56 | Unfavorable | |
| 15 | 327943,32 | 785387,64 | Unfavorable | |
| 16 | 348674,84 | 1096791,32 | Unfavorable | |
| 17 | 225217,02 | 1490124,55 | Unfavorable | |
| 18 | 209914,73 | 1235253,44 | Unfavorable | |
| 19 | 153180,68 | 1762073,49 | Unfavorable | |
| 20 | 296609,25 | 1151248,16 | Unfavorable | |
| C | 21 | 169490,25 | 1899472,47 | Unfavorable |
| 22 | 201843,81 | 1944050,00 | Unfavorable | |
| 23 | -23407,21 | 2603520,57 | Unfavorable | |
| 24 | 198564,29 | 2258045,03 | Unfavorable | |
| 25 | 356118,18 | 1696095,83 | Unfavorable | |
| G | 26 | 123217,51 | 858672,80 | Unfavorable |
| 27 | 101755,39 | 883715,35 | Unfavorable | |
| H | 28 | 199616,15 | 1307171,00 | Unfavorable |
| 29 | 307344,73 | 1079186,68 | Unfavorable | |
| L | 30 | 134058,48 | 1861536,26 | Unfavorable |
| 31 | -21600,00 | 1408171,07 | Unfavorable |
Source: The authors.
The agreement obtained in all the blocks (Table 9) is higher than the established limit (k ≥0.61) with an "almost perfect" degree of agreement in 5 of the 6 blocks analyzed, so that the model is valid for making inferences about the economic impact based on the evaluation of the vehicle availability indicator.
Table 9 Contingency table for factor validation.
| Blocks | n 1 | n 2 | n 3 | n 4 | k | Degree of agreement |
|---|---|---|---|---|---|---|
| A | 0 | 0 | 1 | 3 | 0,73 | Considerable |
| B | 0 | 0 | 0 | 16 | 1 | Almost perfect |
| C | 0 | 0 | 0 | 5 | 1 | Almost perfect |
| G | 0 | 0 | 0 | 2 | 1 | Almost perfect |
| H | 0 | 0 | 0 | 2 | 1 | Almost perfect |
| L | 0 | 0 | 0 | 2 | 1 | Almost perfect |
Source: The authors
The proposed method allows identifying the vehicles that have a negative impact on the economic result in a company that participates in the drugs supply chain with a combination of roles (marketer-logistics operator). The expressions obtained (4-17) represent the effects of the combination of roles in the service chain, including the effect of subcontracting. These expressions are simple, without complex mathematical operations and the data required coincide with those commonly recorded in transport companies. The method does not require a high technological level for data acquisition and processing, nor does it require a high academic level of workers. All this should facilitate the application to real fleets in environments with strong economic and technological restrictions.
Unlike the work cited [19], this proposal separates the economic effect associated with the out-of-service status of vehicles (parameter 𝑐) from the inactive status (parameter 𝑏) and includes the cited effects related to the combination of roles and the subcontracting for the calculation of the control limit based on the balance of the impacts on the economic result of the vehicles operation.
The graphic method is used for the classification of vehicles. The RSG, as a graphical tool, facilitates the classification and socialization of the results. It also facilitates the identification of the presence of opportunities for improvement at the unit and fleet level, based on the appreciation of individual and group trends.
7. Conclusions
The proposal for monitoring the degradation of vehicles through the evaluation of availability is feasible in fleets of companies participating in the logistics chain with a combination of roles and service outsourcing.
The method proposed allows making inferences about the acceptability of the vehicle operation in relation to the impact on the economic result, which enables the opportune identification of vehicles that have an unfavorable impact on the economic result of the entity, contributing to the detection of opportunities for improvement.
The monitoring of vehicle degradation through the availability indicator can be used in environments under strong economic and technological restrictions, which favors the introduction of the method in real conditions.

