


 English (pdf)
 Article in xml format
 Article references
 Send this article by e-mail
 Cited by SciELO
  Cited by Google
  Similars in
SciELO
Similars in
SciELO  Similars in Google
 Permalink
1. Introduction
The search for excellence in the management of production processes has become a recurring practice developed by organizations in the face of the current competitive scenario [8,16]. In this way, the use of quality tools such as Statistical Quality and Process Control corresponds to a structured path to achieve the operational efficiency of the value chain, as well as customer satisfaction [19].
In this context, Statistical Process Control (CEP) aims to monitor the adequacy of the production processes to what was predefined in the project [25]. According to [16] and [3] Statistical Process Control (CEP) is a powerful problem-solving tool, being useful in obtaining process stability and improving capacity, by reducing variability. Such tools allow the reduction of the causes of problems and assist in the solution of factors that can interfere with the quality of production [19]. In relation to the Statistical Quality Control (CEQ), this can also be quantified, given that not necessarily all the pre-established parts in a project will be fulfilled [8, 16]. Therefore, the term quality can be described as the conformity of the product or service with what was pre-defined by the project team, where all the demands of the consumer market and the adequacy to the production plant are taken into account [23].
Finally, with regard to the history of development of statistical control, in general, it has occurred in the 1920s, with the presence of process analysis and series production starting from a verification of sequential systems, which currently it can be used for the implementation of continuous improvement models [16]. In this context, the present study aimed to evaluate the packaging process of the cassava cultivar practiced by the organization in question, in addition to proposing actions that contribute to its better performance. It is worth mentioning the importance of this study in the development of management and control activities to obtain superior levels of product quality [16].
2. Theoretical reference
2.1. Fundamentals of Statistical Quality and Process Control
The use of Statistical Process Control (CEP) in the production processes aims to quickly detect systematic variations of the parameters for possible decision making [13]. Statistical Quality Control (CEQ) seeks to monitor processes through statistical tools such as the Shewhart control chart combined with tools such as the Ishikawa diagram and the PDCA cycle [21,19]. The merger of both reflects on highly efficient bases that, acting together imply the continuous improvement of quality and productivity [19,16].
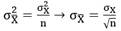
For [15], in any production process, regardless of how well planned or carefully maintained it is, a certain amount of inherent or natural variability will always exist. For [16], this natural variability is a cumulative effect of many small causes, essentially inevitable. These causes are called "random or common causes". When a production process has only natural variability, that is, it operates only with the random causes of variation, it is said to be under statistical control or simply in control [16]. When other sources of unusual variations, called special or attributable causes, start to act on the balance of the process, in addition to the common causes of variability, it is said that the process is out of control [21,16].
Thus, once the special causes are identified, they must be eliminated, and preventive measures must be imposed in order to achieve the adjustment and stability of the process [19,16]. It is worth mentioning the importance of control charts, or control charts, in helping to detect special causes and monitor processes [16]. Faced with this, considering
 as a continuous variable of interest, the control chart of the sample mean
 it is used to monitor the centrality of processes [16]. The Midline estimate for the centrality graph (
) is located in the average, expected value, of
. Thus, the control limits are normally established at three standard deviations from this average, that is [20,22]:
it is used to monitor the centrality of processes [16]. The Midline estimate for the centrality graph (
) is located in the average, expected value, of
. Thus, the control limits are normally established at three standard deviations from this average, that is [20,22]:
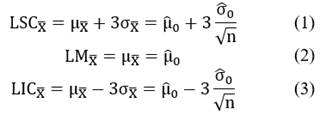
The values of "3σ" upper and lower than the midline were estimated by Shewhart in order to reduce the probability of false alarm, avoiding unnecessary inspections of a process that is in control [19,22]. Since σ 0 and μ 0 are not known with absolute precision, they are estimated by:
 and
and
 .
.
For the performance analysis of the graph of
 the following hypotheses are considered:
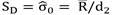
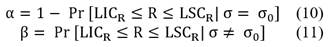
Knowing that the Type I error (α) is given by the rejection of H 0 when it is true and the Type II error (β) the non-rejection of H0 when it is false, the probabilities of occurrence of these errors correspond to the [16,22]:
Thus, calculating the Type II error (β), the detection power of the graph of X it is given by:

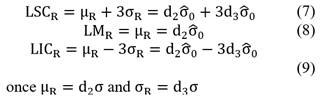
Regarding the amplitude (R) of the samples, the main function of the R graph is to monitor the dispersion of the process. Similarly, for the control limits of the R graph, we have [19,22]:
For the performance analysis of the R graph, some hypotheses are also considered, namely:
Thus, there are the following estimates for α and β [16,22]:
In addition, for the analysis of the joint performance of the
 and R, we have the following hypotheses:
Consequently, σ CONJUNTO is the sum of the Type I error of
and R minus the joint intersection, that is:

Similarly, joint power is given by:

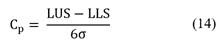
For [16], the capacity analysis of a process consists of a methodological approach based on probability and statistics, to measure the adequacy of the behavior of one or more characteristics of interest in terms of previously established standards. To perform such analyzes, it is necessary to use the process capacity indexes (PCI’s). The most used indices to analyze the capacity of the process are [16,22]:
Potential Capacity Index (Cp): Used to measure the potential capacity of the process, that is, how well the process can meet its specifications and is given by:
Effective Capacity Index (Cpk): Unlike the Cp, the effective capacity index considers the dispersion of the process in relation to centrality and is given by:
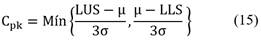
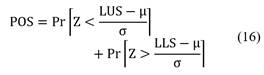
The upper and lower specification limits (LUS and LLS) are determined by engineering to meet regulatory standards [22]. When it comes to calculating the percentage of items out of specification (POS), this can be obtained by [6,16,22]:
2.2. Contextualization of the packaged cassava food sector
Currently, the growth of the cassava productive sector in Brazil is notable, considering the multiplicity of applications of the product [9,11,12,18]. In view of this, among Brazilian states there are those that stand out in relation to productivity and their level of industrialization, which incorporates agility and quality to the process as a whole [12]. In this case, based on data from the Brazilian Institute of Geography and Statistics (IBGE), such states are Mato Grosso do Sul, Paraná and São Paulo [14]. Also, according to the IBGE, the regions that stand out in relation to the amount of planted area of the product are in the north and northeast, these with a low industrial level [14].
The commercialization of the product in the Alto Paranaíba mesoregion is currently based on a cautious process of intensifying quality and productivity [11]. This in most cases is described by the implementation of experimentation units, which assist in the detection of good production patterns as well as better varieties of the product [17]. Also, according to [11], the Brazilian cerrado represents one of the main centers of cassava production, so this is due to the favorable characteristics of climate and soil.
Finally, it is important to note that according to data from [14], Minas Gerais is the ninth national producer of cassava. In 2014, production reached 851 thousand tons in an area of 59.6 thousand hectares [14]. In addition, the Alto Paranaíba region produced about 45 thousand tons in 2.7 thousand hectares. Another relevant fact is associated with the leadership of production in the northern region of the state of Minas Gerais with 187 thousand tons [14].
3. Research hypotheses
The construction of hypotheses contributes to the conduction of research, in order to guide the researcher's decision-making process, in addition to helping to generate more consistent conclusions [24]. In view of this, the hypotheses of this study were related to the process of controlling the weighing of cassava packages, as indicated in Table 1.
Table 1 Description of the hypotheses
| Hypoteses | Description |
|---|---|
| H1 | The process of weighing cassava packages is statistically efficient |
| H2 | Factors associated with the machine influence data variability |
| H3 | Factors associated with labor influence data variability |
| H4 | Factors associated with the method influence data variability |
| H5 | Factors associated with the material influence data variability |
| H6 | Factors associated with the environment influence data variability |
| H7 | Factors associated with the measure influence data variability |
Source: Authors, (2019).
4. Methodological procedures
The research approach, according to [24] is the baseline that guides the research process, featuring a way to identify the phenomena that are intended to be studied. The methodological importance of a work can be justified by the need for an adequate scientific basis, generally characterized by the search for the best research approach to be used [15]. Still for [15], a research is developed along a process that involves innumerable phases, from the adequate formulation of the problem to the satisfactory presentation of the results, critical analysis and its conclusions.
In this context, the present study used the case study as a research method, since according to [20], it refers to a careful observation of a context or individual. In addition, the case study allows the researcher to focus on a specific situation and identify the various processes that interact in the context addressed [24]. It is worth remembering that the research contemplated the fusion of the qualitative and quantitative universes, in order to provide a complementary approach that provides the greatest understanding of the entire analyzed process [5]. In this way, although they are different in terms of form and emphasis, such universes promote a rational and intuitive approach, allowing a clear understanding of phenomena [5,15].
The initial step for monitoring a process is to get to know it in general [23]. In view of this, the realization of a consistent sampling process is fundamental for the collected information to faithfully represent the studied reality [7,16]. Dessa forma, a base de dados amostral contemplou um conjunto de valores correspondente aos pesos dos pacotes de mandioca, coletados em uma empresa do ramo alimentício da mesorregião do Alto Paranaíba. In addition, aspects such as frequency and sample size are also important to guarantee the success of this process, since the greater frequency and size of samples help in the better presentation of the scenario [24]. Thus, the samples in this study were collected with an average sampling frequency (fam) of 45 minutes in order to reduce the probability of the occurrence of special causes in the process, as well as to facilitate detection if they occur.
For operational reasons, a sample size of 30 units (packages) was stipulated, with two samples being collected simultaneously at each time interval, in order to avoid delays in the production line and reduce the costs related to the data collection itself. Then, instantly, the packages were weighed on an electronic scale located outside the production line. The target value of V.A. of interest corresponded to 655 grams / package. 6 samples / day were collected for 5 consecutive days.
Finally, the identification of possible causes of process variability was made possible with the use of the tool corresponding to the Ishikawa Diagram [21]. In addition to composing the table of the seven quality tools, the diagram allows for a cohesive analysis on the causes of a priority problem and its effects [1]. When it comes to the composition of the tool, it is divided into six distinct types of causes, namely, method, machine, measure, environment, labor and material [21]. In addition, improvement actions were proposed as a way to remedy possible causes and favor the good performance of the analyzed process.
5. Results and discussion
The analyzed company belongs to the food sector, specifically, the root sector. In addition, it is located in the municipality of Pratinha-MG, located in the mesoregion of the state. Founded in 2003, its main goal is to launch the best organic cultivars to the consumer, respecting the environment and society, in parallel with the principles of total quality, always seeking continuous improvement and improvement of production processes. In this way, the stages of harvesting and maintaining the plantation, such as controlling the soil and weeds, are carried out using machinery with some manual tasks. The inherent processing steps (washing, peeling, weighing and packaging) are all carried out by machines without physical contact by employees.
In the case of calculations performed, knowing that the correction values d 2 and d 3 are tabulated according to the sample size n, to n = 2 has up:
• d2 = 1,128;
• d3 = 0,853.
Estimating the process standard deviation by the estimator S D , one has to:
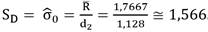
Therefore, for the R graph, we have the following control limits:
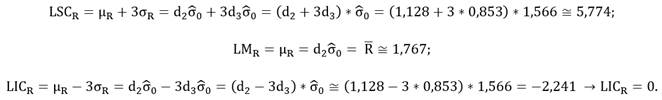
The dispersion of the samples is still plotted in Fig. 1 where it is possible to notice that no sample is out of control of R.
Assuming that the continuous variable of interest has independent values,
 coincides with the expected value,
 , of the random variable X, so
 , where μ0 is the average of the process under control.
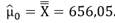
Therefore, it is possible to estimate the average value of the process under control,
 , since it is not known with absolute precision. Thus, according to the sample set analyzed, we have that:
Knowing that the relationship of the variance of
 is given as an average of the variance of X, we have:
 where n is the sample size.
Therefore:

Denoting the estimates, it is possible to calculate the control limits of
 :
:
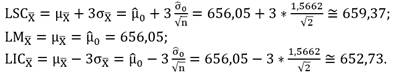
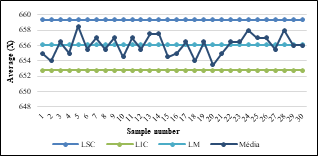
The variability of
follows plotted in Fig. 2 where it is possible to notice that none of the samples came out of the control limits of
.
The probability of false alarm, statistically designated by the Type I error (α), is the probability of mistaking the process out of control (false alarm). The consequences of this error lead to disadvantages due to intervention in the process at the wrong time.
As seen earlier, the probability of false alarm on the R graph is given by:
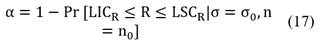
But, by notation, we have that the relative amplitude is given by:
 .
.
Replacing R = Wσ0 in (17), we have:
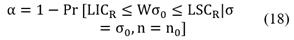
Subdividing the entire equation (18) by σ0, has up:
Thus:

The probability (Pr) of false alarm on the
 is given strictly as a function of the tolerance value (k), that is, k is the distance from the midline to the control limits, given in units of standard deviation [14]. For the Shewhart chart, k = 3.
In this way:
•
.
•

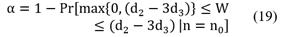
Assuming that the mean moves to one end of the Shewhart control limits, the probability of non-detection can be calculated as follows:
Knowing that the relationship between the average of the process under control as a function of the average of the process out of control is given by:
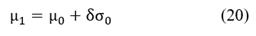
And the ratio of the out-of-control standard deviation given by
Has up:
In this way:

Calculating the detection power of the R graph, we have:

Calculating the combined power of the
 and R, has up:

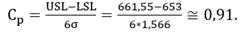
The specification limits for packaged cassava are given as follows:
Upper Specification Limit: Established by the company as the value of (655 + 1% = 661,55 grams/pack).
Lower Specification Limit: Established by the company as the value of (655 - 0,3% ≅ 653 grams/pack).
Calculating the POS we have:

Given the specification limits, it is possible to calculate the capacity indices. Thus, we have:

Analyzing the Shewhart control limits for the control chart by variables, it can be inferred that, during data collection, the process was under control, that is, free of special causes. In this way, the calculated control limits can be used to monitor the process.
The probability of mistaking the process out of control, that is, the probability of false alarm, was of the order of:
• 0,27% for the graph of
;
• 0,99% for the graph of R;
• 1,26% for the set (
e R).
The main practical consequence associated with Type I error (α) is to carry out interventions and diagnostics in the process at the wrong time, which implies unnecessary costs and possible maladjustments in the process [16, 22].
Detection power is a highly important statistical tool that can be used to monitor a process since the average and / or the amplitude of the sample units have shifted so that it is possible to see the probability of the process being out of control before the manager intervenes in the process looking for special causes. Analyzing the capacity indices, it is possible to identify that the process is incapable, because Cp and Cpk are less than 1. This is due to the high variability of the sampling units that make up the process. In case of Cpk, the process average is below the average of the specification limits. It can be seen by the POS that 25810 items are out of specification per million (ppm), since the estimated POS was approximately 2.6%. Thus, hypothesis H1 was accepted.
For the process to be able to, Cp and Cpk greater than 1.33, the causes of variability in the process must be eliminated [15,21]. As the specification limits cannot be extended, it is necessary to decrease the current standard deviation from 1.667 to 1.0025 and work with the process average equal to 657 grams. With these modifications, the process would have POS < 0,007 %. However, one has to be aware of the cost of such modifications to see if it is really feasible. In general, improvements are always well accepted in all production processes. In this context, it is necessary to identify possible factors (special causes) that harm the process as a whole. For this, Fig. 3 shows possible causes that affect the cassava packaging process in the company under study.
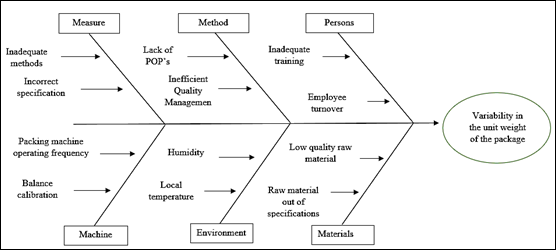
With regard to the possible causes associated with the variability of the unit weight of the packages, these include the six aspects elucidated by the Ishikawa diagram. However, some causes proved to be more relevant, clearly demonstrating their influence on the process. In view of this, aspects related to machinery and employed labor corresponded to the most prominent causes (H2 and H3 accepted). This is due to the fact that the organization has good quality monitoring and management practices, however, it has difficulties regarding the familiarity of its employees with the equipment used. Além disso, as hipóteses H4, H5, H6 e H7 também foram aceitas, no entanto, não apresentam o mesmo grau de influência sobre a variabilidade dos dados analisados como H2 e H3. In this context, Table 2 represents possible improvements that can be implemented in order to reduce or remedy these causes.
Table 2 Special causes and corrective / preventive measures
| Special Cause | Corrective / preventive measure |
|---|---|
| Packing Machine Operating Frequency | Use of Manuals and Forms |
| Electronic Scale Calibration | Monthly maintenance |
| Employee Turnover | Motivation and salary adjustments |
Source: Authors, (2019).
Thus, as corrective actions for questions related to machinery, the use of manuals and forms was proposed in order to effectively instruct all employees involved in the packaging process. In addition, carrying out monthly maintenance of the scale used, as a way to reduce errors in weighing the product. Finally, with regard to the cause of employee turnover, it was proposed to carry out reward policies that bring greater motivation to employees, in addition to salary readjustments according to the organization's base budget.
6. Conclusion
In the face of a competitive scenario and a fast-growing market segment, as seen with the cassava cultivar market, it was observed that the company's production process is presented as efficient and of quality. This fact could be proven through the control chart by variables, in which all samples were within the control limits established statistically. In addition, in the tax field, all products were presented within the specification values stipulated by Organs responsible bodies. Still in this respect, the probability, in percentage, of extrapolation or non-compliance with the rules stipulated for the product was only 2.581%.
Finally, if there are changes to be proposed, they should take into account the levels of capacity. In this sense, it would be interesting to carry out the motivation of the team of employees through salary adjustments, for example, constant maintenance of the machinery and use of manuals, which would make the production even more efficient and more qualified, making the company a reference in the segment, in region in which it is located, acquiring more consumers and, consequently, market.

