


 Inglés (pdf)
 Articulo en XML
 Referencias del artículo
 Enviar articulo por email
 Citado por SciELO
  Citado por Google
  Similares en
SciELO
Similares en
SciELO  Similares en Google
 Permalink
1. Introduction
Studies based on questionnaire data, aside from being costly due to the human, physical, and logistical resources they require, provide evidence for decision-making with a long-time delay, due to the periods between the fieldwork planning/development, the processing/analysis and the preparation of the report. In addition, due to their high cost, they generally use small samples and provide only part of the “truth”, by restricting the way in which the respondent can answer, instead of allowing them to freely express their position on a certain object of study [1]. Likewise, studies based on surveys tend to be widely prone to bias due to unreasoned responses [2], in addition to a lack of interest, social desirability, time pressure on the respondents, or the perceived difficulty of the items. Thus, in most cases, there are, among other aspects, long chains of selection of the same option (e.g., at one end of the scale or at the midpoint) and blank responses, which may affect the quality of the data and compromise the veracity of the evidence and the usefulness/relevance of the subsequent decisions [3-7].
Unlike survey data, Internet searches tend to be more truthful in representing human thinking about traditionally private, avoided, or taboo topics. Thus, studies using data from Google Trends have revealed the prevalence of racist tendencies and sexuality-related fears, among other issues, that perceptual data have failed to reflect (e.g., [8-10]). This paper uses the 2022-2026 presidential election in Colombia, held on June 19, 2022 (runoff election), whose candidates were the economist Gustavo Petro and the engineer Rodolfo Hernández (Registraduría Nacional del Estado Civil in Colombia, [11]) as a case study.
Thus, this study has an academic/research purpose and aims to examine the potential of the mentioned data for predicting events of high importance for citizens, such as a presidential election in an emerging context which has barely been considered in previous works, using the reproducible descriptive analytics framework in R hereby proposed.
This paper is organized into six sections. The first justifies the investigation. The second summarizes the case study and describes Google Trends as well as related work. The third section describes the proposed methods and the fourth provides the results of the analysis. Both the methods and the results are reproducible; hence, supplementary material is provided with the data and the code in R. The fifth section outlines the discussion of the findings, including the possibilities for future work. The sixth section presents the main conclusions.
2. Reference framework
2.1. Case of study: 2022-2026 presidential election in Colombia (runoff election)
The 2022-2026 presidential election was one of the most polarized in recent years in Colombia [12]. The first round involved six candidates competing against each other to occupy the first position in the nation. Since none obtained more than 50% of the total vote, a runoff election had to be held with the two candidates with the highest number of votes: the economist Gustavo Petro, representing El Pacto Histórico, and the engineer Rodolfo Hernández, running for the Liga de Gobernantes Anticorrupción.
Regarding the projections for the results of the runoff election (June 19, 2022), the polling firms generated controversy. While some of them found that the candidate of the Pacto Histórico (Petro) would be the next president of Colombia, others considered the representative of the Liga de Gobernantes Anticorrupción to be the winner of the electoral contest. For example, the pollster Yanhass projected a more overwhelming advantage for Petro (45%) compared to his rival (35%), which represents a difference of 10 percentage points. In contrast, the National Consulting Center gave Rodolfo Hernández the advantage, with 41% against Gustavo Petro with 39% [13]. Likewise, the latest Invamer survey projected a “technical tie with a narrow victory for Hernández” (48.7%) over Petro (47.2%), based on a sample of 2,000 surveys distributed in different regions of the country [14].
In general, according to the newspaper Portafolio, in Colombia, four of the six studies based on surveys projected that the candidate “Rodolfo Hernández” would be the winner, with a maximum difference between the surveys of 3% [15].
2.2. Google Trends and related studies
Google Trends is a Google service that reports a score of the interest that users have had for a certain topic, with the latter represented by a particular search term. This score ranges between zero (minimum search activity) and 100 (the moment of maximum search activity for the queried term) [16]. Additionally, Google Trends allows for segmenting the data by region, time and web resource (e.g., Google, YouTube, news), as well as other aspects [17]. Google Trends is used to assist academic/research work, considering the non-invasive nature and free expression (human language) that its data represent [18-19], to understand human thinking and behavior [20].
Google Trends data have been used to predict phenomena in social, health, economic, and political fields [20-24]
In the political field, for instance, [25] examine whether the results of presidential elections in Germany can be predicted by analyzing the behavior of potential voters before the election date. To do this, they use an observation window of 30 days before the voting and calculate the normalized percentages of an indicator they call Average Web Interest for each candidate and party. They conclude that there is a strong association between the search preferences of potential voters and the actual election results.
[26] demonstrate the ability of Google Trends data to predict the winner in presidential elections in the United States and Canada, through a correlation and mean difference analysis that takes into account the number of votes obtained and the number of searches on the web. To do this, they examine the issue with data from one, two and three months before the date of the election. They conclude that the method used manages to predict the winning candidate of the observed elections. [27] conduct a similar study in the context of a presidential election in Indonesia, using ratios of difference between candidates, calculated from search data over the eight months before the election. They report that although the overall winner was predicted, the estimates achieved little success in the case of individual provinces.
Although studies that use data from Google Trends to anticipate relevant results for humanity are on the rise, the generalization of the conclusions is still developing, as is the generation of a protocol that establishes the most appropriate conditions for using it in the case of a presidential election. Similarly, in events taking place in emerging countries, such as Colombia, the use of data from the above-mentioned web tool is incipient in assisting public decision-making, based on cost-efficient, timely and truthful data/findings, as a replacement for or complement to survey data/findings. Thus, the present study complements previous works by providing original evidence from the automatic analytical processing of data from Google Trends, which is applied to a high-impact political case (a presidential election), in an emerging context (Colombia) that has been little considered from this perspective in previous studies on the subject. At the same time, it aims to provide an analytical protocol, automated in R, that promotes discussion and possible future standardization in the academic community, on how to use data from Google Trends to report on predictions for high-impact electoral processes, using methodological resources for students, teachers, researchers and decision-makers that are descriptive and easy to understand and access. Thus, the proposed analytical code is shared in the supplementary material of this article.
3. Methods
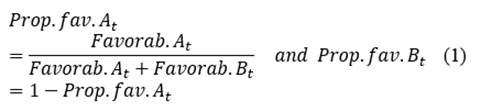
From Google Trends, the “search interest” score, here called “Favorab”, was extracted for two expressions corresponding to the first surname and the first name of the presidential candidates, “Petro” and “Rodolfo”, respectively (expressions usually used by the news and the Colombian population to refer to each candidate). The population under study is made up of the population in Colombia that searched the aforementioned terms. The search region was restricted to “Colombia”, with the period limited to between 6 A.M. on June 18, 2022, and 4 P.M. on June 19, 2022 (the day of the presidential election). The resulting sample consisted of 1,020 observations. A descriptive analysis was carried out, using tables, line graphs and consolidated histograms according to web resources data (Google, YouTube), all in R. The validation was performed using two real results as a reference, one corresponding to the true percentage of the vote obtained by each of the two candidates, communicated in “Boletín 58” by the Registraduría Nacional del Estado Civil in Colombia (99.99% scrutinized) [11]. The other reference result was obtained by recalculating the voting percentages for each candidate, excluding blank, null and unmarked votes. The procedure conducted, in the R code format, is provided in the supplementary material. The election result was estimated for two typologies of the proportion of favorability of a certain candidate (Prop.fav); one is valid for each time band (t) under observation, which describes the dynamic behavior of the candidate’s favorability, while the other was calculated on a consolidated basis, thus representing the estimated final result for the election. Equations 1 and 2 detail these expressions for the case of two candidates (A and B) considering n observations.
Additionally, Tables 1 and 2 present an extract of the first and last six observations that make up the work database, respectively.
Table 1 Six first observations
| Time | Favorab | Candidate | Resource | Prop.fav | Day | |
|---|---|---|---|---|---|---|
| 1 | 2022-06-18T06:04:00-05:00 | 21 | Petro | YouTube | 0.350 | 18 |
| 2 | 2022-06-18T06:12:00-05:00 | 32 | Petro | YouTube | 0.471 | 18 |
| 3 | 2022-06-18T06:20:00-05:00 | 34 | Petro | YouTube | 0.453 | 18 |
| 4 | 2022-06-18T06:28:00-05:00 | 29 | Petro | YouTube | 0.527 | 18 |
| 5 | 2022-06-18T06:36:00-05:00 | 29 | Petro | YouTube | 0.408 | 18 |
| 6 | 2022-06-18T06:44:00-05:00 | 32 | Petro | YouTube | 0.432 | 18 |
Source: own elaboration from data provided by Google Trends.
Table 2 Six final observations
| Time | Favorab | Candidate | Resource | Prop.fav | Day | |
|---|---|---|---|---|---|---|
| 1015 | 2022-06-19T15:16:00-05:00 | 59 | Rodolfo | 0.391 | 19 | |
| 1016 | 2022-06-19T15:24:00-05:00 | 62 | Rodolfo | 0.411 | 19 | |
| 1017 | 2022-06-19T15:32:00-05:00 | 61 | Rodolfo | 0.381 | 19 | |
| 1018 | 2022-06-19T15:40:00-05:00 | 57 | Rodolfo | 0.363 | 19 | |
| 1019 | 2022-06-19T15:48:00-05:00 | 62 | Rodolfo | 0.395 | 19 | |
| 1020 | 2022-06-19T15:56:00-05:00 | 54 | Rodolfo | 0.388 | 19 |
Source: own elaboration from data provided by Google Trends.
4. Results
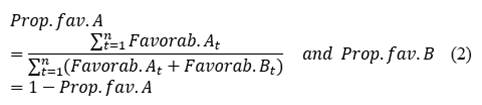
4.1. Time series for favorability (“Petro”, “Rodolfo”) on the Internet (Google and YouTube)
Fig. 1 describes the behavior of the proportions of the favorability of the candidates in the electoral race, during the election day (June 19, 2022) and the day before.
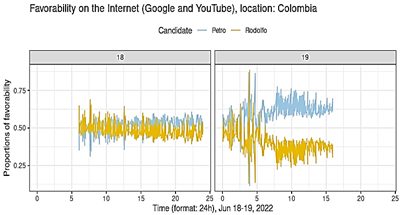
4.2. Histogram for favorability (“Petro”, “Rodolfo”) on the Internet
Fig. 2 provides a frequency histogram of the favorability of the candidates in each observation time slot (see Equation 1), as well as the global estimates, following Equation 2.
Source: own elaboration from data provided by Google Trends.
Figure 2 Histogram of proportions of favorability on the Internet by candidate
Fig. 1 shows that the day before the election, the favorability levels of both candidates were very similar and, on the day of the election, the difference widened in favor of “Petro”, especially in the time slot that corresponds to the start of the voting.
Fig. 2 shows that when consolidating the favorability of the candidates for both days (June 18 and 19, 2022) and web resources (Google, YouTube), “Petro” has a higher central tendency than “Rodolfo”, with both having a similar distribution.
4.3. Histogram for search interest (“Petro”, “Rodolfo”) in Google
Fig. 3 provides a histogram of the favorability of the candidates, considering the search data from Google.
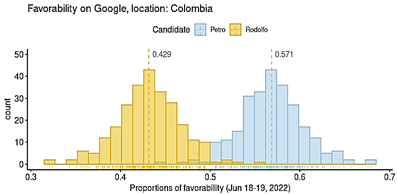
Source: own elaboration from data provided by Google Trends.
Figure 3 Histogram of favorability on Google by candidate
Fig. 3 shows that the proportion of the favorability of “Petro”, derived from search data in the Google search engine, is 13.8 percentage points higher than that obtained for the expression “Rodolfo”. Likewise, the distributions for the expressions of both candidates are shown to be symmetrical and similar in variation.
4.4. Histogram for search interest (“Petro”, “Rodolfo”) on YouTube
Fig. 4 shows the distribution of the proportions of the favorability of the candidates, focusing on YouTube.
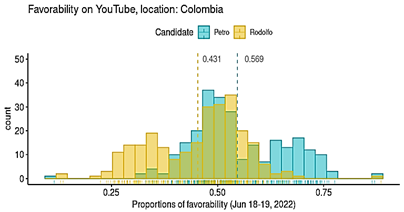
Source: own elaboration from data provided by Google Trends.
Figure 4 Histogram of favorability on YouTube by candidate
Fig. 4 shows that although the favorability of “Petro” continues to be higher than that of “Rodolfo”, data are more dispersed than in the previous cases (Figs. 2 and 3). In addition, two peaks stand out, one around 0.5 for both candidates (“tie”) and the other around 0.63 in the case of “Petro” and 0.37 in the case of “Rodolfo”. This is because the largest differences in the favorability of the candidates, which were reflected on election day (June 19, 2022, see Fig. 1), were on YouTube.
4.5. Validation (Est: estimated value - True: true value)
Table 3 presents the comparative results between the estimates produced by the use of Google Trends data under the analytical framework hereby deployed and the true result of the votes in Colombia. The true result (True.result) provided “Petro” with 50.44% (11,281,002 votes) of the votes and Rodolfo with 47.31% (10,580,399). The blank vote corresponded to 2.24% (501,987), and the null or unmarked votes were 1.29% (295,282). Such values were taken from “Boletín 58” of the Registraduría Nacional del Estado Civil (June 19, 2022) [11]: https://resultados.registraduria.gov.co/historico/BO_0058/presidente/0/colombia.
Table 3 Comparison based on all types of votes
| Petro (%) | Rodolfo (%) | Petro [Est-True] (%) | Rodolfo [Est-True] (%) | |
|---|---|---|---|---|
| Internet | 57.00 | 43.00 | 6.56 | -4.31 |
| 57.10 | 42.90 | 6.66 | -4.41 | |
| YouTube | 56.90 | 43.10 | 6.46 | -4.21 |
| True.result | 50.44 | 47.31 |
Source: own elaboration from data provided by Google Trends.
Similarly, Table 4 presents the comparative results between the estimates generated in this study and the real ones (True.result: “Petro”: 51.60%, 11,281,002 votes; “Rodolfo”: 48.40%, 10,580,399), considering only the votes for the candidates; that is, with the prior exclusion of blank, null and unmarked votes.
Table 4 Comparison based only on votes for the candidates
| Petro (%) | Rodolfo (%) | Petro [Est-True] (%) | Rodolfo [Est-True] (%) | |
|---|---|---|---|---|
| Internet | 57.0 | 43.0 | 5.4 | -5.4 |
| 57.1 | 42.9 | 5.5 | -5.5 | |
| YouTube | 56.9 | 43.1 | 5.3 | -5.3 |
| True.result | 51.6 | 48.4 |
Source: own elaboration from data provided by Google
Tables 3 and 4 show the high similarity of the estimates produced by the data processing from web searches and the true electoral result of June 19, 2022 (based on Boletín 58 from the Registraduría Nacional del Estado Civil in Colombia) [11]. In the case of “Petro” the estimates exceeded the true result by 6.66 percentage points (based on all types of votes), while in the case of “Rodolfo” that distance was -4.31 percentage points. When considering only the votes for the candidates (discounting null, blank and not marked votes), the magnitudes are even closer. Likewise, no substantial differences were found between the estimates from the processing of the search interest data on Google, YouTube or both resources. In summary, Tables 3 and 4 show that, regardless of the web resource (Google, YouTube or both), the evidence supports the relevance of Google Trends data processing for predicting presidential election results.
4.6. Improving the estimations considering only data from one day before the presidential election (June 18, 2022)
Taking into account the time series in Fig. 1, it was decided to recalculate the estimates by considering only the day before the election (June 18, 2022). The comparative findings are provided in Tables 5 and 6.
Table 5 Comparison based on all type of votes during one day before voting (n: 540 obs.)
| Petro (%) | Rodolfo (%) | Petro [Est-True] (%) | Rodolfo [Est-True] (%) | |
|---|---|---|---|---|
| Internet | 52.30 | 47.70 | 1.86 | 0.39 |
| 55.00 | 45.00 | 4.56 | -2.31 | |
| YouTube | 48.30 | 51.70 | -2.14 | 4.39 |
| True.result | 50.44 | 47.31 |
Source: own elaboration from data provided by Google Trends.
Table 6 Comparison based on only votes for the candidates during one day before voting (n: 540 obs.)
| Petro (%) | Rodolfo (%) | Petro [Est-True] (%) | Rodolfo [Est-True] (%) | |
|---|---|---|---|---|
| Internet | 52.27 | 47.73 | 0.67 | -0.67 |
| 55.01 | 44.99 | 3.41 | -3.41 | |
| YouTube | 48.27 | 51.73 | -3.33 | 3.33 |
| True.result | 51.60 | 48.40 |
Source: own elaboration from data provided by Google Trends.
The estimates shown in Tables 5 and 6, from the data processing of one day before the presidential election (June 18, 2022), turned out to be even more precise than those obtained by adding data from the day of the election (June 19, 2022). The maximum difference between the estimated and true proportions of votes for the candidates was only 4.56 percentage points in the case of “Petro” and 4.39 in “Rodolfo”. In fact, unlike the comparative results presented previously (Tables 4 and 5), this time the estimates of the consolidated data (‘Internet’: Google and YouTube) were even more exact, with a distance of only 1.86% in the case of “Petro” and 0.39% for “Rodolfo”. This further demonstrates that the use of Google Trends data, the described global favorability (see Equation 2) and the descriptive analysis/visualization routines represent a potential analytical resource for assisting informed, timely and reproducible decision-making in areas of electoral processes.
5. Discussion
The day before the election (June 18, 2022), the favorability levels on the web for each candidate were very close to each other, with a very slight superiority of the expression “Petro”; however, the next day, when the presidential election was held (June 19, 2022), the difference between the two candidates became noticeable, mainly after 6 A.M. (“Petro” had about twice as much favorability as “Rodolfo” on the Internet).
Estimates calculated by processing data from Google Trends, considering the expressions “Petro” and “Rodolfo”, Colombia (location), and the period June 18-19, 2022, were close to the true result of the voting (with distances of less than 6.7% in absolute values in the case of “Petro” and less than 4.5% for “Rodolfo”). However, when recalculating the estimates based on data from one day before the voting (June 18, 2022), they were even closer to the true result of the electoral race, with distances of between 1.86% (Google and YouTube) and 4.56% (Google) in the case of “Petro”, and between 0.39% (Google and YouTube) and 4.39% (YouTube) in the case of “Rodolfo”. This shows that the day of an election might not be the best time to examine data from Google Trends, due to the possible pressure and destabilization associated with multiple factors which are beyond the control of this study (e.g., people with greater indecision or lack of interest in the subject, who seek to make a voting decision at the last moment; advertising strategies in web media not used in past days; robots executing queries). In contrast, the day before an election could be a better alternative for future studies; a suggestion that should be explored in relation to other samples and presidential elections, with the aim of possible generalization. This represents a valuable opportunity for future work focused on evaluating the most appropriate period for making use of Google Trends data, in the face of the date of a certain relevant event. In fact, the works considered in the reference framework (Section 2.2) used much longer time windows (months) than the one addressed in this study, which reinforces the relevance of finding the most appropriate period for future field work in Google Trends.
The estimates derived from search data processing on Google, YouTube and both resources were very close to each other, considering the scenario of June 18 and 19 (election day). These differed from the true values between a maximum of 6.46 (on YouTube) and 6.66 (on Google) percentage points, in absolute values. In contrast, in the most stable scenario (one day before the election: June 18, 2022), the combination and processing of data from both web resources (Google and YouTube), as a representation of the Internet favorability, yielded the closest estimates to the true values obtained by the candidates. There, the percentage points of differences between the estimated and the real values were 1.86 for “Petro” and 0.39 for “Rodolfo”.
This study shows that the use of data from Google Trends constitutes a potential means for carrying out predictions for presidential elections, which is consistent with the findings reported by [25-26]. At the same time, it is partially consistent with those found by [27]. They conclude that the data provided by such a tool are still far from providing predictions that replace the surveys; however, they suggest that such data can complement polls. In conclusion, the data from Google Trends, together with the exposed descriptive analytics protocol, can be used as a non-invasive, fast and cost-efficient complement or supplement to electoral projections based on surveys, since access to Google Trends is free and approximately 2 hours of human intervention are required for data collection and processing. Cost-efficiency of using Google Trends is also regarded by [28].
The search terms used (“Petro” and “Rodolfo”) represent the expressions most directly related to the candidates under consideration. However, other associated terms, such as “Francia Máquez” and “Marelen Castillo”, corresponding to the vice-presidential running mates of the candidates, were not considered in this study. Future works could examine the subject using the analytical protocol proposed in this paper, including and excluding other expressions associated with the candidates in electoral races, in order to conclude on the effect of this on the resulting findings. Future works could also compare the estimates obtained in the present study against the true result of young voters (e.g., 18-34 years), considering that this population is more likely to use the Internet compared to older ones.
Future research could also use Google Trends and the proposed analytical protocol with the aim of confirming its predictive potential in cases of other countries and types of decisions. Likewise, additional studies could examine whether a possible correction factor based on the percentage distances found here could be generalized to new environments or to future electoral processes in Colombia. Furthermore, it could be valuable for the Colombian context to examine specific scenarios, such as key cities, rural areas and contexts with a certain political tradition.
The proposed analytical framework opens up countless possibilities for bringing data science even closer to processes that are highly relevant for the government and citizens, concerning informed and timely decision-making in the context of smart cities.
6. Conclusions
This article suggests that using Google Trends data under the proposed analytics framework is a cost-effective alternative with a high potential for predicting presidential election results. Using as a case the recent electoral process for the election of the president for 2022-2026 in Colombia, all the analysis scenarios (the favorability of the candidates on Google, YouTube and both) were correct regarding the candidate who was elected by the citizens on June 19, 2022. Additionally, the best result was obtained from the scenario that considers data from the day before the election (June 18, 2022) and of favorability on the Internet (combining data from both web resources: Google and YouTube). That scenario yielded the prediction “Petro”: 52.30%, “Rodolfo”: 47.70%, which represents differences of only 1.86 and 0.39 percentage points from the actual results of each candidate (Petro: 50.44%; Rodolfo: 47.31%; “Boletín 58” of Registraduría Nacional del Estado Civil in Colombia, 2022), respectively.
It is expected that this success case, together with the proposed reproducible descriptive analytics framework (with the shared R code), will stimulate future studies in this regard, as well as new uses of such resources in teaching/learning as well as practical decision-making processes in Colombia and other contexts. Future studies may include the evaluation of the results by region.

