


 Inglés (pdf)
 Articulo en XML
 Referencias del artículo
 Enviar articulo por email
 Citado por SciELO
  Citado por Google
  Similares en
SciELO
Similares en
SciELO  Similares en Google
 Permalink
1. Introduction
Among the main causes of the reduction in the predictability of water availability on a global scale is climate change, which exacerbates the ever-increasing challenges associated with sustainable water management 1. Water is the quintessential connector in global commitments to protect a sustainable future, The 2030 Agenda for Sustainable Development and its 17 Sustainable Development Goals (SDGs) rely heavily on improved water management. In Venezuela, the main source of water supply for human consumption is surface water based on reservoirs, which are mostly managed by regional hydrological companies that provide drinking water and sanitation services affiliated with the Hydrological Company of Venezuela (HIDROVEN). Until 2005, the urban aqueduct service through networks from reservoirs covered the water supply to a population of 18,496,877 inhabitants, representing 91.18% of the census population on the national scale (20,285,828) 2, the rest could be supplied by tanker truck, public sink, well with a pumping system, protected well or spring, cistern or jagüeyes, rivers, pipes or streams 3.
The National Institute of Statistics (INE, in Spanish) reported an accelerated population growth in the population censuses of the San Diego Municipality between 2001 and 2011. The population is concentrated in the southern part of the municipality, an area of intense industrial and commercial development. In total, the water demand is more than 400 L/s, with 77% for residential use and 23% for industrial and commercial uses 5-6. In 2011, the INE reported that 13% of the population was supplied by water from wells; while the remaining 83% was supplied by networks from the Central Regional System, with contributions from adduction lines from the Valencia municipality, pumping station in Castillito, the main pipe network on the axis of Av. Don Julio Centeno. Additionally, the north of town San Diego has the La Cumaca surface source, with an average extraction flow between 20 and 30 L/s 5-6.
Groundwater is extracted from some 58 active deep wells, 77% of which is used for domestic use 5-6. This high number of deep wells compensates for the deficit problems in the provision of the Central Regional System service in San Diego municipality, since it cannot cover the flow demands of all sectors, and it does not operate continuously, but with frequencies of two or three times a week for about 12 to 20 hours each time. This situation tends to be accentuated due to the high urban and commercial growth of the municipality 5-6.
Taking advantage of the information generated in recent studies 5-6, it has been considered convenient to develop additional investigations of calibration and validation of groundwater flow models in confined aquifers and determination of hydraulic parameters to estimate the production of the San Diego aquifer in the central region of Venezuela. In this study, the novelty consists in determining statistical parameters in a 95% confidence interval to adapt the Theis model for a confined aquifer under a non-permanent flow regime and determine the hydraulic parameters related with the drawdown and transmissivity to the pumping well, knowing the pumping flow, the storage coefficient and the distance between the pumping and observation wells. In this way, the study contributes with the provision of a method that can be extended for application in other aquifers in order to have hydraulic parameter estimation tools that allow administrators to take operational actions that protect and prolong the useful life of the aquifers.
2. Materials and methods
2.1. Study area
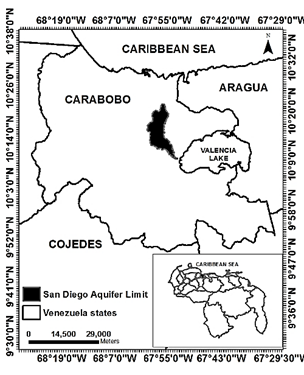
The study area is the San Diego aquifer, located in the northern region of Venezuela (Fig. 1), which belongs to the Carabobo state. The northern region is part of the mountainous zone of the “Cordillera de la Costa”, whose northern slope is placed in front of the Caribbean Sea and whose southern slope drains into the depression of Valencia Lake (Fig. 1). The limits of the aquifer in geographic coordinates are as follows: latitude: N10°22'00', N10°09'00', longitude: W67°52'00', W68°00'00'. The San Diego aquifer is included within the hydrographic region or integral basin of Valencia Lake, according to article 17 of the Water Law 7. It is also part of the Andean Province, Atlantic and Caribbean Slope, Subprovince of the Central Orogenic System in accordance with Chapter III of the Regulations of the Water Law 8. Likewise, the San Diego aquifer is included within the central region No. 6 of the geological map of Venezuela, whose components include sedimentary and volcanic rocks from the Cenozoic (Eocene) towards the north, while towards the south it is made up of unconsolidated sediments (Pleistocene to Holocene) in the plain near Valencia Lake 9.
2.2. Phases of the investigation
The research phases covered the procedures to respond to the specific objectives of this study.
2.2.1. Characterization of flow variables towards a well in a confined aquifer
The characterization of the flow variables towards a well in the confined aquifer | of the San Diego municipality was based on by 21 works to obtain the degree in Bachelor of Science in Civil Engineering from the University of Carabobo (UC) developed between the year 2015 and the beginning of the year 2019, cited later, as well as a thesis of the Master's Program in Environmental Engineering of the UC 5-6, for which documentary research was carried out on them and their analysis.
2.2.1.1. Procedure for the determination of the geophysical parameters of the aquifer in the San Diego Municipality for the period 2015-2019
The aquifer of the San Diego municipality has characteristics that identify it as confined, since there are impermeable strata (clay, fine sand) in the upper, interbedded and lower layers, as it can be verified in the sample of 28 lithological profiles of the wells registered with the Ministry of Ecosocialism and Waters and located within the aquifer (Table 1).
Table 1 Lithological profiles of the San Diego aquifer, Carabobo state, Bolivarian Republic of Venezuela.
| a | b | c | d | a | b | c | d | a | b | c | d | a | b | c | d | a | b | c | d |
|---|---|---|---|---|---|---|---|---|---|---|---|---|---|---|---|---|---|---|---|
| 1 | 0 | 1 | LV | 2 | 0 | 1 | LV | 3 | 0 | 2 | VL | 4 | 0 | 1 | LV | 5 | 0 | 1 | LV |
| 1 | 1 | 12 | SM | 2 | 1 | 8 | GW. | 3 | 2 | 23 | CL | 4 | 1 | 16 | CL | 5 | 1 | 9 | GW |
| 1 | 12 | 50 | SW | 2 | 8 | 12 | CL | 3 | 23 | 33 | GW | 4 | 16 | 32 | SW | 5 | 9 | 22 | CL |
| 1 | 50 | 62 | GW | 2 | 12 | 18 | GW. | 3 | 33 | 53 | GC | 4 | 32 | 47 | GW | 5 | 22 | 44 | GW. |
| 1 | 62 | 83 | SW | 2 | 18 | 34 | CL | 3 | 53 | 54 | SM | 4 | 47 | 58 | R | 5 | 44 | 59 | R |
| 2 | 34 | 42 | SM | 3 | 54 | 60 | CL | ||||||||||||
| 2 | 42 | 47 | GW | 3 | 60 | 71 | GC | ||||||||||||
| 2 | 47 | 73 | GC | ||||||||||||||||
| 2 | 73 | 94 | CL | ||||||||||||||||
| a | b | c | d | a | b | c | d | a | b | c | d | a | b | c | d | a | b | c | d |
| 6 | 0 | 0.5 | LV | 7 | 0 | 0.5 | LV | 8 | 0 | 0.5 | LV | 9 | 0 | 17 | CL | 10 | 0 | 5 | SC |
| 6 | 0.5 | 5 | SC | 7 | 0.5 | 5 | SM | 8 | 0.5 | 5 | SC | 9 | 17 | 52 | SC | 10 | 5 | 7 | CL |
| 6 | 5 | 7 | CL | 7 | 5 | 7 | CL | 8 | 5 | 7 | CL | 9 | 52 | 67 | GW | 10 | 7 | 12 | SW |
| 6 | 7 | 19 | SM | 7 | 7 | 18 | SM | 8 | 7 | 20 | SC | 9 | 67 | 77 | GM | 10 | 12 | 20 | CL |
| 6 | 19 | 23 | SM | 7 | 18 | 21 | CL | 8 | 20 | 25 | SW | 9 | 77 | 105 | CL | 10 | 20 | 26 | SC |
| 6 | 23 | 31 | CL | 7 | 21 | 42 | SW | 8 | 25 | 56 | CL | 9 | 105 | 112 | ML | 10 | 26 | 53 | CL |
| 6 | 31 | 34 | SW | 7 | 42 | 44 | SW | 8 | 56 | 64 | SC | 9 | 112 | 117 | CL | 10 | 53 | 65 | CL |
| 6 | 34 | 56 | CL | 7 | 44 | 93 | SM | 8 | 65 | 75 | CL | 9 | 117 | 126 | ML | 10 | 65 | 81 | CL |
| 6 | 56 | 58 | SM | 7 | 93 | 96 | CL | 8 | 75 | 83 | SW | 9 | 126 | 136 | SM | 10 | 81 | 83 | SW |
| 6 | 58 | 73 | CL | 7 | 96 | 102 | GM | 8 | 83 | 108 | CL | 9 | 136 | 156 | SW | 10 | 83 | 110 | SC |
| 6 | 73 | 77 | SM | 7 | 102 | 105 | CL | 8 | 108 | 115 | SW | 9 | 156 | 160 | CL | 10 | 110 | 119 | SC |
| 6 | 77 | 98 | CL | 7 | 105 | 108 | GM | 8 | 115 | 127 | SC | 119 | 123 | CL | |||||
| 6 | 98 | 101 | SM | 7 | 108 | 110 | CL | 8 | 127 | 133 | SW | 123 | 139 | SW | |||||
| 6 | 101 | 105 | CL | 7 | 110 | 119 | GM | 8 | 133 | 138 | CL | ||||||||
| 6 | 105 | 109 | SM | 7 | 119 | 128 | CL | 8 | 138 | 146 | SW | ||||||||
| 6 | 109 | 122 | CL | 7 | 128 | 139 | GM | 8 | 146 | 150 | CL | ||||||||
| 6 | 122 | 128 | SM | 7 | 139 | 142 | CL | ||||||||||||
| 6 | 128 | 133 | CL | 7 | 142 | 150 | GM | ||||||||||||
| 6 | 133 | 139 | SM | 7 | 150 | 153 | SW | ||||||||||||
| 6 | 139 | 142 | CL | 7 | 153 | 160 | CL | ||||||||||||
| 6 | 142 | 147 | SM | ||||||||||||||||
| 6 | 147 | 150 | CL | ||||||||||||||||
| 6 | 150 | 162 | SM | ||||||||||||||||
| 6 | 162 | 170 | CL | ||||||||||||||||
| 6 | 170 | 173 | SM | ||||||||||||||||
| 6 | 173 | 175 | CL |
Soil types: 
a: lithological profile number, b: upper limit of the layer, c: lower limit of the layer, d: type of soil in the layer. The soil type corresponds to the Unified Soil Classification System (USCS) as: GW: well-graded gravel, GC: clayey gravel, GM: silty gravel, SW: well-graded sand, SM: silty sand, SC: clayey sand, CL: low plasticity clay, ML: silt, VL: topsoil, R: Rock.
2.2.1.2. Procedure for the determination of the hydraulic parameters of the aquifer in the San Diego Municipality for the period 2015-2019
Although flow in wells is often treated as a steady flow problem (conditions do not change over time), most cases encountered are actually non-steady conditions (vary over time) (10). The solution for unsteady flow in a confined well was derived by Theis, (11).
Procedure for measuring water levels in underground wells
The measurement of the depth of the water surface below the reference of the land surface using the electrical tape was carried out following the procedure established by the US Geological Survey (USGS) in (12). In the undergraduate theses of the Center for Hydrological and Environmental Research of the University of Carabobo (CIHAM-UC, in Spanish) carried out by (13-33), a double-wire electrical tape graduated in meters, tenths and hundredths of meters was used, PLM-Seba Hydrometrie model, being provided by CIHAM-UC. The electrical tape was mounted on a hand-cranked electrical supply reel containing space for the batteries and some device ("Indicator") to signal when the circuit is closed. A water level measurement field form or handheld computer was used for data entry, as well as two adjustable jaw wrenches or other tools to remove the well cover, and spare batteries.
Procedure for pumping tests
Well pumping tests are necessary to determine the well's capacity, drawdown, long-term production ability, and parameters for permanent pump size and to take water samples for analysis. According to (34), for pumping, a test and mechanisms to measure the water level and flow should be used.
Procedure for staggered abatement tests
Stepped drawdown tests should be performed to determine the general parameters of the flow pumping tests (34). These parameters are transmissivity (T) and storage coefficient (S). The well should be pumped at progressively higher rates, and the length of each step release should be long enough to show an indication of a linear trend to a when plotting drawdown against log of time since start of pumping. Water level measurements should be taken before, during and after the pumping test in order to obtain baseline information (static water levels), the pumping effects (water levels during pumping) and a recovery profile of the water level from the water level during pumping to the original state. The measurement frequency of the water levels during the pumping test should be such that an adequate definition of the drawdown against time data becomes available.
2.2.1.3. Procedure for estimating the hydraulic parameters of underground flow transport in confined aquifers
The solution of the partial differential equation that describes the non-permanent system is given in the form of an exponential integral and can be expressed as follows (11):
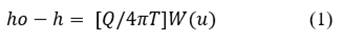
Where ho - h = drawdown in (m), Q = discharge in (m³/s), T = transmissibility coefficient (m³/day/m), W(u) = a well function. The transmissibility coefficient T is the product of the permeability K and b the thickness of the aquifer and has the dimensions of m³/day/m. The well function W(u) becomes an exponential integral, which cannot be evaluated in terms of simple functions. The values of W(𝑢) for various magnitudes of 𝑢 are tabulated in (10), which in turn is given as:
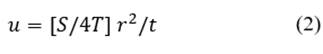
Where: r = distance from the well to the observation piezometer in m, t = time since pumping starts in days, S = storage coefficient. The storage coefficient is related to the compressibility of the system and can be considered as the water removed from a vertical column of one square meter in the aquifer, when the pressure head is lowered by 1 m.
Determination of hydraulic parameters by graphic method
The properties T and S of the aquifer can be determined by pumping a variable flow rate Q and measuring the drawdown for various time intervals. The properties of the aquifer cannot be established directly, but there are graphical techniques for their indirect determination. For discussing this procedure, note that in eq. (1)-(2), the terms enclosed in square brackets are constants for a particular well and can be considered as proportionality constants. Therefore, a graph of W (u) against u should have the same shape as a graph of (h0 - h) against (r²/t). The resulting difference in the proportionality constants is manifested in a scale difference between the two plots. The graphical procedure consists of plotting on double logarithmic paper W (u) against u using the values tabulated in (10). In general, the distance between the pumping and observation wells varied between 133 and 4285 m. The distance between wells is justified mainly due to the following aspects: a) most of the wells did not comply with article 54 of the "Standards for the location, construction, protection, operation and maintenance of drilled wells for the supply of drinking water (35), which establishes that the ¼” (0.00635 m) diameter pipe and pressure gauge with accessories for determining the pumping levels during the gauging of the well, or failing that, a ½” (0.0127 m) orifice diameter as a minimum equipped with a screw cap should be located at the mouth of the bottom of the well to introduce an electric probe, b) restrictions on obtaining permits for access to wells managed by different managers. In studies to characterize the parameters of the function proposed by Theis (36), diagrams of the piezometric head of the observation wells located with respect to the pumping well were determined for distances between 181 m and 3,113 m, finding a linear relationship for the lowering of the water level.
2.2.2. Calibration of groundwater flow transport models in confined aquifers
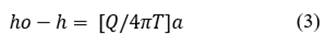
Calibration of groundwater flow transport models represented by eq. (1)-(2) in confined aquifers is performed using the nonlinear regression statistical tool contained in MATLAB (37). The coefficients of the nonlinear models are obtained using the Levenberg-Marquardt algorithm, which is known as the damped least squares method (37). Statistical fit coefficients of observations to estimates include: the determination coefficient, the adjusted coefficient of determination, the standard error of estimate, the mean absolute error, and the Durbin-Watson statistic. Additionally, graphical representations of observations against estimates and residuals are included, such as: residual against estimated variable, normal probability plot, and autocorrelations of residuals. The eq. (1)-(2) corresponding to the Theis method were modified by transforming the coefficients W (u) into  and u into b, being expressed by eqs. (3)-(4).
2.2.3 Validation of groundwater flow transport models in confined aquifers
The validation stage consists of using a different set of data used for the calibration stage to estimate the statistical errors between the observations and the estimates. Statistical errors include: root mean square error, mean percent absolute error, mean absolute error, mean error, and mean percent error.
3. Results
3.1.1. Results of the characterization of the geophysical parameters of the San Diego aquifer
The set of lithologies compiled from the well records of the Ecosocialism Ministry, public institutions and private companies, offers a description of the subsoil in the San Diego aquifer area at each site where deep wells have been drilled 5-6. The lithology of the soil shows essential characteristics, since the type of soil at each level is associated with the presence of aquifer, aquitard or aquicluded strata, and therefore is related to the condition of the aquifer strata as free, confined or semiconfined.
The soil of the San Diego aquifer is composed of mineral particles classified according to the Unified Soil Classification System (USCS) in a sample of twenty-eight lithological profiles extracted from pumping wells (5, 6, 38-39). Table 1 shows a sample of the list of soil lithological profiles obtained with data from wells registered by the Ministry of Ecosocialism, indicating in each case the predominant lithologies in descending order, giving the total thickness of the permeable strata (not necessarily contiguous) and the average depth of these strata. In this sample of soil profiles, the following materials are found in various arrangements depending on the type of material and thickness of the soil layer: GW: well-graded gravel, GC: clayey gravel, GM: silty gravel, SW: sand graded, SM: silty sand, SC: clayey sand, CL: low plasticity clay, ML: silt, VL: vegetation layer, R: rock 5,6,38-39.
Table 1 shows the alternation between layers of permeable granular materials (SW well graded sand, GW well graded gravel) and layers of impermeable materials (CL low compressibility clay, ML low compressibility silt). When detailing the location of each well, it is found that those located to the north of the basin have mainly CL and GW type material; CL and SW strata are found in the center and south of the San Diego aquifer (5, 6, 38-39).
Based on the values of the geophysical properties obtained in the 28 pumping wells of the San Diego aquifer (Fig. 2), the saturated thickness of the aquifer varied between 5 and 55 m, with 15 m being the most frequent value of occurrence (40%). The most frequent depth to find saturated strata was 40 m (50%). The effective porosity varied between 0.24 and 0.36, the interval with the highest frequency of occurrence corresponded to 0.3 and 0.33 (Fig. 2), which is associated with a type of material that varies from coarse sand to fine gravel to thick 40. The permeability in the aquifer strata varied from 50 to 1,200 m/day (Fig. 2), with the interval with the highest frequency of 65% being found between 1,000 and 1,200 m/day corresponding to a well-graded gravel material 40.
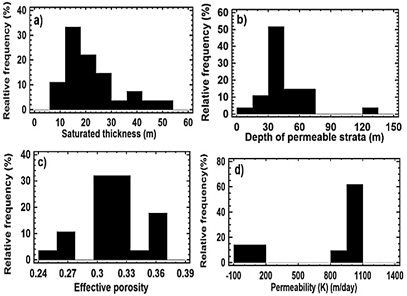
Figure 2 Geophysical properties of the San Diego aquifer, Carabobo state, Bolivarian Republic of Venezuela.
The permeability or hydraulic conductivity is directly proportional to the porosity of the medium and inversely proportional to the tortuosity according to the Hagen- Poiseulle equation 40. Tortuosity is the description of how crooked the fluid flows through the pore space. A mathematical relation of the logarithmic type was proposed to relate the permeability to the effective porosity by 40, according to which the permeability varied between 10 2 and 10 3 m/day for an effective porosity varying between 20 % and 30%.
3.2.1. Results of the characterization of the hydraulic parameters of the San Diego aquifer
The results of the twenty pumping tests of variable rate are shown in Fig. 3 a -3b and a summary is presented in Tables 2-3. Table 2 shows the location of the pumping wells from where the pumping tests were carried out, which were located from the transition between the mountainous zone and the plain, where residential use is carried out, to the zone south, where the industrial zone is located, in the area occupied by the San Diego municipality, Carabobo State, Bolivarian Republic of Venezuela.
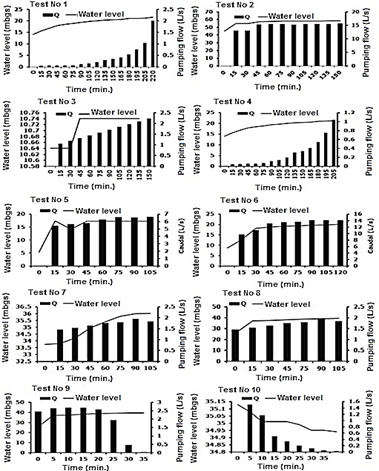
Figure 3a Flows and water levels against measured times in the tests of the San Diego aquifer, Carabobo State, Bolivarian Republic of Venezuela, in the period 2015-2019.
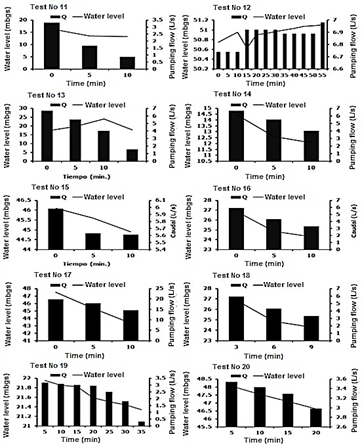
Figure 3b Flows and water levels against measured times in the tests of the San Diego aquifer, Carabobo State, Bolivarian Republic of Venezuela, in the period 2015-2019.
Table 2 Description of the pumping test (PT) in wells of the San Diego aquifer, Carabobo state, Bolivarian Republic of Venezuela.
| Projected Coordinates | Identification | PT | Use | |
|---|---|---|---|---|
| X | Y | |||
| 613796 | 1130979 | Inst. de Amb. San Diego | 1 | Rec |
| 614670 | 1126508 | Empresa ProAgro | 2 | Ind |
| 615817 | 1137789 | La Cumaca | 3 | Res |
| 613796 | 1130979 | Inst. de Amb. San Diego | 4 | Rec |
| 613796 | 1136949 | Villas de San Diego | 5 | Res |
| 613950 | 1127884 | Empresa Bigott | 6 | Ind |
| 613950 | 1135093 | Tulipán P. # 2 | 7 | Res |
| 613684 | 1134541 | Urb. El Tulipán P. #6 | 8 | Res |
| 613950 | 1135093 | Urb. El Tulipán P. #2 | 9 | Res |
| 613950 | 1127884 | Empresa Bigott | 10 | Ind |
| 613950 | 1127884 | Empresa Bigott | 11 | Ind |
| 614670 | 1126508 | Empresa ProAgro | 12 | Ind |
| 613957 | 1130618 | Parque Metropolitano | 13 | Rec |
| 613448 | 1134925 | Urb. Monteserino | 14 | Res |
| 614197 | 1130251 | Urb. El Morro I | 15 | Res |
| 612912 | 1131476 | Colegio Clorinda Azcunes | 16 | Ed |
| 612912 | 1131476 | Colegio Clorinda Azcunes | 17 | Ed |
| 612912 | 1131476 | Colegio Clorinda Azcunes | 18 | Ed |
| 613950 | 1135093 | Urb. El Tulipán P. #2 | 19 | Res |
| 613537 | 1135141 | Urb. El Tulipán P.#1 | 20 | Res |
Educational Ed., Res.: Residential, Ind.: Industrial, Rec: Recreational.
Source: Own elaboration.
Table 3 Minimum (Min.) and maximum (Max.) values of water levels (WL) expressed in meters below the ground surface (mbgs), and pumping flows (Q) in (L/s) measured for a total duration (TD) in minutes (min.) of the pumping tests (PT) at variable flow rates carried out in the period 2015-2019 in the San Diego aquifer.
| PT No | WL ( mbgs ) | Q(L/s) | Reference | Min. | Max. | Min. | Max. | |||
|---|---|---|---|---|---|---|---|---|---|---|
| 1 | 1.5 | 14.0 | 0 | two | 28 | |||||
| 2 | 4 5 | 58.2 | 0 | 15.6 | 29 | |||||
| 3 | 10.1 | 10.7 | 0 | 2.2 | 30 | |||||
| 4 | 18.4 | 21.2 | 0.1 | 1.0 | 31 | |||||
| 5 | 5.3 | 17.4 | 0 | 6.6 | 32 | |||||
| 6 | 8.6 | 20.0 | 0 | 14.1 | 33 | |||||
| 7 | 33.7 | 36.0 | 0 | 1.9 | 25 | |||||
| 8 | 25.8 | 39.3 | 1.4 | 1.9 | 26 | |||||
| 9 | 19.3 | 20.5 | 0.1 | 2.7 | 27 | |||||
| 10 | 34.9 | 35.1 | 0 | 1.5 | 27 | |||||
| 11 | 13.2 | 16.3 | 0.8 | 3.3 | 19 | |||||
| 12 | 50.6 | 51.1 | 6.8 | 6.9 | 20 | |||||
| 13 | 17.2 | 23.9 | 17.2 | 23.9 | 21 | |||||
| 14 | 12.0 | 14.4 | 4.0 | 6.6 | 22 | |||||
| 15 | 24.3 | 26.8 | 3.3 | 5.9 | 16 | |||||
| 16 | 24.3 | 26.8 | 3.3 | 5.9 | 17 | |||||
| 17 | 43.3 | 47.4 | 14.6 | 19.7 | 18 | |||||
| 18 | 24.3 | 26.8 | 3.3 | 5.9 | 19 | |||||
| 19 | 21.3 | 21.9 | 0.32 | 3.1 | 14 | |||||
| 20 | 46.6 | 48.0 | 2.98 | 3.5 | 13-14 | |||||
Source: Own elaboration.
Table 2 shows that on some occasions, the tests were carried out between 2 and 3 times in the same well during different periods, due to these offered conditions to make the measurement with a probe of the water level below the surface of the ground. The wells where the pumping tests of variable flow were carried out were of varied uses, including residential, industrial and recreational types.
Fig. 3a-3b show the twenty variable flow pumping tests carried out in the San Diego aquifer, where it is observed that the tests were carried out mostly starting from zero flow until reaching the maximum pumping flow according to the capacity of the equipment installed to extract flows from the well. Fig. 3a-3b and Table 3 show that the highest flows were measured in pumping wells located in areas of industrial use (15.6 L/s, test 2) and (14.1 L/s, test No 6), recreational (23.9 L/s, test 13) and educational (19.7 L/s, test 17). In general, the water levels were found closer to the ground surface as the flow was decreased, which can be explained by the fact that the transmissivity of the groundwater flow towards the pumping well was greater than the pumping flow rate of the well. The greatest decreases in water levels were recorded in the wells for industrial use (test 2) and residential in the areas with the highest density of inhabitants (test 20).
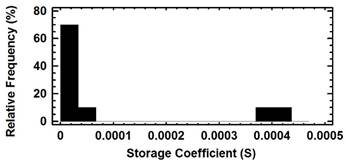
Fig. 4 shows that the values obtained for transmissivity and the storage coefficient resulted in the highest frequency of occurrence (85%), corresponding to transmissivity values between 0 and 77 m2/day. Regarding the values of the storage coefficient, values associated with high frequency (70%) were found in the order of 10 -5 (Fig.5).
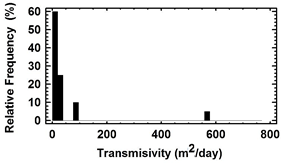
Figure 4 Frequency of occurrence of the transmissivity estimated by the Theis method from the variable flow pumping tests of the San Diego aquifer, Carabobo State, Bolivarian Republic of Venezuela, in the period 2015-2019.
3.2. Results of the calibration of groundwater flow transport models in confined aquifers
3.2.1. Results of the model calibration to estimate drawdown in the pumping well from a confined aquifer
Table 4 presents the results of the calibration of the drawdown models (ho - h), in the pumping well from a confined aquifer. The fit parameter in eq. 3 is  , which takes a mean value of 16.65. The value of 𝑎 could be found in an interval with a confidence level of 95%, whose lower and upper limits range from 12.68 to 20.62. In the interval estimation of the parameter 𝑎, the standard error of the statistic and the length of the confidence interval are small in relation to the magnitude of the mean of the parameter and the confidence level assumed, which indicates that there is adequate precision or quality of the information for the estimation of the response variable, represented by the abatement using eq. 3 41-42.
Table 4 Calibration parameters of Eq. 3.
| Parameters of Equation 3 | ||||||
|---|---|---|---|---|---|---|
| Parameter | Mean | Standard Error | 95% confidence interval | |||
| Lower limit | Upper limit | |||||
| 𝑎 | 16.65 | 1.67 | 12.67 | 20.62 | ||
| Statistical adjustment parameters of Equation 3 | ||||||
| R2 | R2 adj | EEA | MAE | DW | dL | d v |
| 0.764 | 0.764 | 8.35 | 20.62 | 1.79 | 1.08 | 1.36 |
R 2: coefficient of determination, adjusted R 2: adjusted coefficient of determination, EEE: Standard error of estimation, MAE: Mean Absolute Error, DW: Durbin -Watson statistic.
Source: Own elaboration.
Table 4 shows the statistical adjustment parameters of the calibration for eq. 3, where it is observed that the results were equal to the determination coefficient (R2), and the adjusted coefficient of determination (R2 adjusted), which is a measure of the proportion of the variability of the data that is explained by the model 41-42, equal values were obtained. According to 41, when there are many terms in a statistical model, R2 adjusted is preferred over R2, since the latter increases with each term that is added to the model, even if it is a term that does not contribute significantly to the answer explanation. In the case of eq. 3, the variables entered as independent are two, represented by the flow rate (Q) and the transmissivity (T). For the eq. 3, both terms are found to be significant in explaining the response variable. The R2 and R2 adjusted coefficients were equal to 0.764 (Table 4). According to 42, it is correct that 0<R2 <R 2 adjusted<1, and in general, for a model to have a satisfactory fit, it is necessary that both coefficients have values greater than 0.70. In accordance with this criterion, the calibration of eq. 1 is satisfactory, in terms of the ability of the model to predict drawdown. Regarding the errors, the standard error of estimation was 8.35 and the mean absolute error was 20.62 (Table 4). The Durbin-Watson (DW) statistic was slightly higher than the interval of the Durbin-Watson test statistics (dL and dV), since DW is greater than dV, with independence between the consecutive residuals, therefore the measurements between tests that support the database for calibration were performed without influencing each other 42.
3.2.2. Results of the model calibration to estimate the transmissivity in the pumping well from a confined aquifer
Table 5 presents the results of the calibration of the transmissivity models (𝑇) in the pumping well from a confined aquifer. The adjustment parameter in Eq. 4 is (u), which takes a mean value of 1050.64. The value of u could be found in an interval with a confidence level of 95%, whose lower and upper limits range from 664.32 to 1436.94. In the interval estimation of the parameter 𝑢, the standard error of the statistic and the length of the confidence interval are small in relation with the mean magnitude of the parameter and the assumed confidence level, which indicates that there is adequate precision or quality of the information for the estimation of the response variable, represented by the transmissivity using Eq.4 41-42.
Table 5 Calibration parameters of eq 4.
| Parameters of eq. 4 | ||||||
|---|---|---|---|---|---|---|
| Parameter | Mean | Standard error | 95% confidence interval | |||
| Lower limit | Upper Limit | |||||
| 𝑏 | 1050.6 | 139.13 | 664.32 | 1436.94 | ||
| Statistical adjustment parameters of eq.4 | ||||||
| R2 | R2 adj. | EEA | EAM | D.W. | dL | dv |
| 0.85 | 0.85 | 3.96 | 2.82 | 0.83 | 1.08 | 1.36 |
R2: coefficient of determination, R2 adjusted: adjusted coefficient of determination, EEE: Standard error of estimation, MAE: Mean Absolute Error, DW: Durbin-Watson statistic.
Source: Own elaboration.
Table 5 shows the statistical adjustment parameters of the calibration of eq. 4, where it is observed that the coefficient of determination (R2), and the adjusted coefficient of determination (R2 adjusted) resulted equal values, from a magnitude corresponding to 0.85, being greater than 0.70, resulting in a calibration of eq. 4 satisfactory, in terms of the ability of the model to predict transmissivity. Regarding the errors, the standard error of estimation was 3.96 and the mean absolute error was 2.82 (Table 5). The Durbin-Watson statistic was slightly lower than the interval of the Durbin - Watson test statistics (dL and dV), since DW is less than dL, therefore there is a slight to null correlation between the residuals consecutive 41.
Tables 6 and 7 show the results of the validation of the models for depletion (eq. 3) and transmissivity (Eq . 4), by comparing the errors, mean absolute error (MAE) and mean error (ME), between the calibration and validation stages, using a second set of data. It is observed in both cases that there is an increase in errors between the results of the observations and the model, therefore the amount of data to perform the calibration-validation adjustment should be increased by performing a greater number of field tests.
Table 6 Comparison of statistical adjustment parameters of the calibration and validation stages of Eq. 3.
| Stage | n | MAE | ME |
|---|---|---|---|
| Calibration | 8 | 4.81 | 1.74 |
| Validation | 12 | 32.52 | -6.98 |
n: number of data, MAE: Mean Absolute Error, ME: Mean Error.
Source: Own elaboration.
4. Discussion
Regarding the geophysical parameters, the effective porosity varied in agreement with that for unconsolidated sediments 40. The San Diego aquifer includes alternating layers of soil material predominantly between well graded sand and low plasticity clay, being a confined aquifer. Gravel is the only aquifer material in the three profiles near the mountainous area identified as: P25, P26 and P27 where the recharge zones could be located. The effective porosity corresponded to a coarse-grained soil material 40. According to 40, the water-filled pore space cannot be completely drained by pumping or evaporation, a fraction of the water binds to the surface of the mineral grain by adhesion. The drainable pore space defines the effective porosity. The amount of bound water is strictly related to the internal surface of the pore space. Material with a small grain size has a high internal surface area, for example, clay up to 100 m2/g compared to silt (approximately 1 m2/g) and sand (approximately 0.1 m2/g). A large amount of bound water reduces the effective porosity. Therefore, despite the high porosity of clay, the effective porosity of clay is very small. Typical values of effective porosity are: clay <5%, fine sand 10-20%, coarse sand 15-30%. For aquifers that are classified as composed of coarse material, the effective porosity is only slightly smaller than the total porosity. As can be seen, the San Diego aquifer has a porous space that gives it a high capacity to be drained.
Regarding the hydraulic parameters, according to 40 the transmissivity of less than 10 m2/day is very low, between 10 and 100 m2/day corresponds to low, between 100 and 500 m 2/day is medium, greater than 500 m2/day, is high to very high. In the aquifer of the San Diego municipality, transmissivity values were predominantly found that can be classified at a medium level, which were obtained in the area of residential use of the aquifer (Fig. 6). Regarding the storage coefficient, values were found varying in an interval between 10-4 and 10-5, these values could correspond to a type of karstic-confined aquifer, composed of limestone and dolomite 40. According to 16-17 in the total area of the San Diego aquifer, corresponding to 117 km2 , there are four types of waters, whose composition is as follows: 1) Calcium and/or magnesium bicarbonate, 2) Sodium bicarbonate, 3) Calcium and/or magnesium sulfate or chloride, 4) Sodium sulfate and/or chloride. These water classes have been located in the aquifer regions as follows: 1) North and Middle: the water contains predominantly calcium and/or magnesium bicarbonate in an area of 95.17 km2) Middle and South: the water contains sodium bicarbonate in an area of 19.32 km2, 3) South: the water contains two constituents: sodium sulfate in an area of 0.96 km 2 and magnesium and/or calcium sulfate in an area of 1.68 km 2. Similar results in the composition of the water extracted from the wells used for human consumption in the San Joaquin municipality were reported by 43, which is located in the vicinity of the San Diego municipality, both located in the western region of Carabobo state. The results of the predominance in the composition of bicarbonated calcium waters were reported in 52 of 66 wells located in Valencia Lake and Aragua State by 44. According to 40, the karst aquifer is formed by the dissolution of carbonate rocks (limestone, dolomite. Karst phenomena occur not only on the surface but also at greater depths in the aquifers 40. The reason is that the dissolution of the carbonate is a comparatively fast process, but it still takes some time, while water can cover quite a long distance along a fracture According to 45, the regions of Venezuela that present karst aquifers comprise about 20% of the territory The most significant karsts in the north of Venezuela are distributed by the states: (1) Zulia (2) Falcón (3) Miranda (4) Monagas (5) Scattered minor outcrops in the Andes (Táchira, Mérida, Trujillo and Lara), Anzoátegui (Guanta, Turimiquire, Bergantín) and Sucre (headwaters of Neverí, Cumanacoa ), plus some coastal and insular karsts .(6) In the south of the country, quartzite karsts occur in numerous tepuys, mainly in the Caroní basin, Sarisariñama plateau (in the upper Caura) and Tepui Autana .
Regarding the parameters of the calibration model, for Eq. 3 that allows estimating the drawdown (ho-h) as a function of the flow rate (Q) and the transmissivity (T) expressed as (ho -h f(T, Q)), the interval of the values found by adjusting 𝑎are coincident with those 𝑊 𝑢 in the well function that are related to 𝑢vary between 10-6 and 10-12. The drawdown values in the pumping well were mainly found in the field tests between 6 and 50 meters, for pumping flows varying between 129 m3/day (1.5 L/s) and 1503 m3/day (17 L/s) and transmissivity between 5 and 96 m2/day. As previously described, the predominant demand for water in the San Diego aquifer is residential (77%) and the rest is covered by other uses such as industrial, sports and recreational, so the response in the associated interval The coefficient 𝑎, which is dimensionless, can be attributed to a flow regime in a confined aquifer, whose aquifer strata are made up of fine to coarse material (well-graded sand to gravel) for withdrawal flows requiring medium transmissivities.
Regarding the fit of Eq. 4 representing transmissivity (T) depending on the storage coefficient (S) and the relation (r 2 / t), expressed as T f(S, r2/t), the interval of values 𝑏estimated by calibration can be found in the function of the well associated with values of W (u) less than 10-5 (10 . The values used in the calibration for T varied between 5 and 96 m2/day, S between 10-4 and 10-16 and r 2 / t between 105 and 108 m2/day. These values entered in Eq. 4 led to obtain a coefficient 𝑏varying in the order of 10 to 102 m2/day, which allowed predicting values of T concordant with those obtained from the pumping tests and the Theis function, with an adequate approximation between observations and estimates. These results indicate that parameter 𝑎and 𝑏calibration values corresponding to Eq. 3 and 4 of depletion and transmissivity, which constitute a proposal for the generalization of the application of the Theis equation, contributing to the evaluation of the dynamics of the groundwater flow towards wells in the aquifer of the San Diego municipality, Carabobo state.
5. Conclusions
The lithological characteristics of the San Diego aquifer show that it contains alternating layers of soil material predominantly between well graded sand and low plasticity clay, whose strata have been explored and exploited at depths up to 175 m below the ground surface. Gravel is the only aquifer material in the three profiles near the mountainous area, where the recharge zones could be located.
Regarding the geophysical parameters, the permeability and effective porosity associated with the constituent material of the aquifer strata correspond to areas where the total and effective porosity were similar, which represent coarse sand to gravel.
With respect to the hydraulic parameters, the pumping tests at variable flow and the application of the Theis equation led to the finding that the transmissivity can be classified as low in those tests carried out in areas of mainly residential use (pumping tests No. 3, 5, 7, 8, 9, 14, 15, 19, 20) due to the magnitude of pumping flows extracted in the north-central regions of the San Diego municipality aquifer. The installed pumping capacity in the wells in the residential area was found to be adjusted for low flows (from 2 to 7 L/s), while the drawdown varied mainly in an interval from 10 to 40 m between the observation well and the pumping well. This fact of finding high drawdowns for small extraction flows suggests that it could be justified by a lack of maintenance of the hydraulic seal of the wells, finding a very fine material (clay) that very possibly made it difficult for the water to pass into the well. Another cause could be due to the location of few slots along the well pipe and their placement at depths close to the bottom of the wells, between 70 and 100 mbgs, restricting the use of the water contained in the aquifer strata, located between the ground surface and a depth of at least 70 mbgs. Also due to a lack of saturation of the aquifer strata due to a slight to null recovery of the volume of water stored during the rainy periods of each year, leading to a potential overexploitation of the aquifer of the San Diego municipality. Likewise, the storage coefficient was determined in an interval that confirms that it is a confined aquifer with the presence of limestone and dolomite-based material, whose origin comes from three geological bands that have been the result of the correlation between the formation of the Serranía del Litoral towards the Serranía del Interior in the direction from east to west of the Cordillera de la Costa, including the Caracas metasedimentary association, Las Brisas schists and Las Mercedes schists.
Based on the characterization carried out, a modification of the Theis model for a confined aquifer was calibrated and validated, finding satisfactory fits between eq. (3)-(4) for the prediction of the depletion and transmissivity parameters and the values estimated from the realization of 20 field tests in a confined aquifer, made up of fine to coarse material, which correspond independently to different regions within the well function curve proposed by Theis. The proposed models obtained statistics of coefficient of determination and coefficient of determination adjusted in a magnitude from high to very high, understanding the coefficient of determination as the relationship between the variability explained by the model and the total variability, it was found that between 75 and 85% of the observed variability in leeway and transmissivity are explained by the proposed equations, which indicates that the relationships of ho-h f(Q,T) and T f(S, r2/t) were adequately described by the curvature of the proposed functions. The validation stage demonstrates that improvement of the models can be achieved by increasing the variable flow pumping tests carried out in the San Diego aquifer. By obtaining the statistical parameters 𝑎 and 𝑏 for a confidence interval of 95%, it was possible to adapt the Theis model for a confined aquifer under a non-permanent flow regime and allowing the estimation of the hydraulic parameters related to depletion and transmissivity towards pumping wells within the aquifer of the San Diego municipality; from the knowledge of the pumping flow, the storage coefficient and the distance between the pumping and observation wells. In this way, the study represents a contribution due to the fact of providing a method that can be extended for its application in other aquifers in order to have hydraulic parameter estimation tools that facilitate managers to make decisions and operational actions that protect and prolong the useful life of the pumping systems of wells under control

