


 English (pdf)
 Article in xml format
 Article references
 Send this article by e-mail
 Cited by SciELO
  Cited by Google
  Similars in
SciELO
Similars in
SciELO  Similars in Google
 Permalink
1. Introduction
In Colombia, natural phenomena cause many damages and losses due to floods and landslides that originate from combinations of natural and anthropic factors [1]. 33% of the events reported to the National Unit for Disaster Risk Management (UNGRD) in 2021 corresponded to some type of mass movement [2], with landslides being the main type of mass removal process. The aim of this study is to estimate the threat of landslides caused by precipitation and seismic activity in the Tunja-Guateque road corridor.
According to the National Institute of Roads (INVIAS), due to the winter season that has occurred throughout the course of 2022, 340 emergencies have been attended to on national roads; most of which generate total and partial closures due to landslides [3].
Likewise, in the latest landslide threat bulletin from the Institute of Hydrology, Meteorology, and Environmental Studies (IDEAM), it is confirmed that given the high amount of rainfall, there is saturation in the soil which could cause landslides in areas with many hillsides and steep slopes. Due to the amount of rainfall and the topography of the Department of Boyacá, it is considered an area that ranges from moderate to high probability of saturation [4]. For the case study, the reference levels include average annual rainfall between 890 and 1900 mm, with dispersion in each of the municipalities that are within the analysis corridor [5].
From 1990 to 2016, 0.7% of the mass movements that took place in Colombia were caused by seismic activity. It is worth mentioning that the most relevant seismic event occurred on June 6, 1994 at a depth of 10 km and a magnitude of 6.4 on the Richter scale in the municipality of Páez in the Department of Arauca, which generated a mud flow in the upper part of the Páez river basin. This movement caused the death of 148 dead, resulted in 508 people missing, 207 people injured, 1,664 homes destroyed, 6 vehicular bridges destroyed, 23 schools destroyed, and 13 affected roads equivalent to approximately 100 km of damage according to the National System for Disaster Prevention and Attention, now UNGRD and INVÍAS [6,7].
Taking this into account, a direct relationship could be established between the emergence of landslides with rainfall, which together with seismic activity, reduces shear resistance due to the decrease in cohesion of soils susceptible to landslides and causes slope instability [8,9].
For the analysis of the estimation of the threat in the study area, the collection of data from mass movements that have been registered was required. This required the critical points that present instability in the slopes of the road to be defined. The Colombian Geological Service (SGC) has an open data portal that allows users to view and obtain information on mass removal processes through the Mass Movement Information System (SIMMA). This platform has a historical catalog that gathers the records of occurrence, place, classification, and effects generated by landslides [10]. Similarly, an inventory was carried out as a result of the technical visits made to the road corridor.
In order to estimate the threat of landslides triggered by rain and seismic activity in the Tunja-Guateque corridor, SIMMA landslides were related to the record of accumulated daily rainfall obtained from IDEAM to determine the probability of slope failure due to rain. Simultaneously, the earthquake variable was included as it is represented by the horizontal acceleration of the area, defined in the General Study of Seismic Hazard of Colombia 2009 [11] to establish the probability of failure by this factor.
With this information, the total failure probability is calculated which is symbolized by a categorical threat scale proposed by Chowdhury [23] and the SGC methodological guide [24]. Likewise, the threat is represented in the Quantum Gis Geographic Information Systems (QGIS). This article explains the methodology, the information used, and the results obtained for the case study.
2. Materials and methodology
2.1. Description of the study area
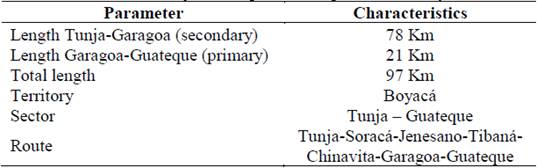
The project is located in the central area of the country, on the Eastern Cordillera of the Andean Region, where the Tunja - Guateque corridor is located. The route crosses the following municipalities in order from north to south: Tunja, Soracá, Jenesano, Tibaná, Chinavita, Garagoa, and Guateque. The road corridor begins on Route 55 of the National Road Network, which connects the municipalities of Soracá-Jenesano-Tibaná-Chinavita, and Garagoa with Route 56.
The Tunja-Guateque road presents slope instability problems. Although these roads have been the object of studies in different projects, the design and construction of stability projects and the monitoring of the road operation by the competent entities persist in presenting problems due to landslides as a result of climatic conditions and geological and geotechnical issues in the area. The project focuses on the analysis of the Tunja-Guateque road in the department of Boyacá, which has the characteristics presented in Table 1.
2.2. Landslide data
Landslide data that occurred in the Tunja-Guateque corridor were obtained from the SIMMA of the Colombian Geological Service and from field visits through visual inspection of unstable sites and critical points. Before processing the data in QGIS, the landslides are filtered, and a grid of 500 m is made on each side of the road corridor. This grid is made up of square cells of 100 m on each side. For the processing, the landslides that are located within the grid were taken into account, which correspond to 134 landslides.
2.3. Geological units
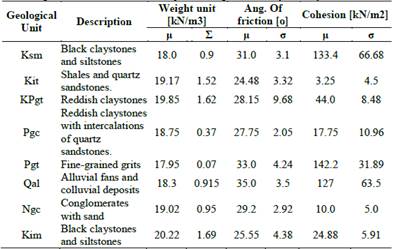
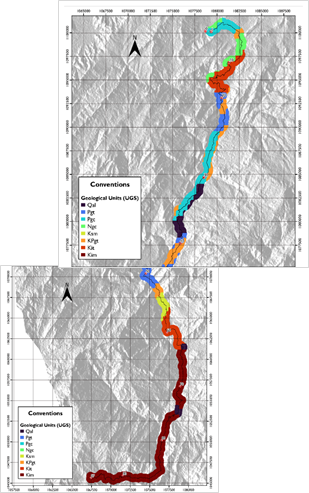
The geology and geomorphology of the corridor from the city of Tunja to the municipality of Tibaná, is located on the Machetá fault, the Guayabal fault in the municipality of Chinavita, and the Puente Tabla fault in the municipalities of Garagoa and Guateque. The predominant materials in the area correspond to colluvial deposits, mass composed of clay matrix blocks. From the geological map of Colombia [14], the geological units present in the Tunja-Guateque road corridor were determined, as shown in Fig. 1. For each type of soil present, the resistance and unit weight parameters shown in Table 2 were assigned. For each soil, the denomination used in the geological map and the corresponding mean (μ) and standard deviation (σ) values are presented for each parameter.
Source: Own creation.
Figure 1 Geological Road corridor map Tunja- Guateque from PR0+000 to PR97+000.
2.4. Precipitation data
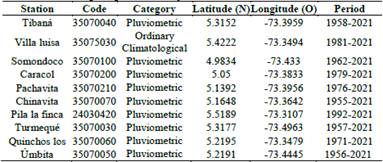
The daily precipitation data obtained from the ordinary fluviometric and climatological stations of IDEAM close to each of the registered landslides were downloaded.
2.5. Seismic data
Due to the fact that the area does not have a seismic microzoning study, the hazard curve of the capitals defined in the General Study of Seismic Hazard of Colombia 2009 [11] is applied. For the road corridor, there is an acceleration of 0.20g from PR+00 to PR4+00 and PR15+00 to PR16+00, according to table A.2.3-1 of the Colombian Earthquake Resistant Construction Regulation (NSR-10). This is considered an intermediate seismic hazard zone and from PR4+00 to PR15+00 and from PR16+00 to PR97+00 an acceleration of 0.25g is determined which is considered a high seismic hazard zone [12].
2.6. Definition of critical rainfall thresholds
To compare the effect of precipitation with landslides, the accumulated rainfall for each event was evaluated. In order to find the critical threshold, the possible combinations of accumulated rainfall (LA) of 1, 3, 5, and 7 days were plotted against the antecedent accumulated rainfall (LAA) of 5, 10, 15, 30, 60, 90, and 120 days for each of the 134 landslides.
Subsequently, descriptive statistics were applied to determine the scenario that presents the greatest number of landslides and the least amount of dispersion within the rainfall ranges [9, 16]. It was found that the failure threshold for the case studied corresponds to the LA scenario of 3 days with an LAA of 15 days, where 54% of the landslides are found and is represented by the following equation:

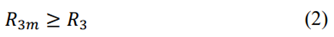
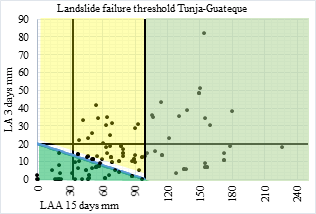
Table 4 Distribution of landslides that exceed the saturation threshold in the Tunja-Guateque road corridor.
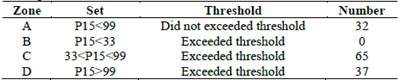
Source: Own creation
Where R 3m corresponds to 3 days of accumulated rain provided by the data of the ordinary fluviometric and climatological stations used and R3 is the accumulated rainfall calculated from the equation (1) [17]. Table 4 shows the distribution of how many landslides of the 134 that have occurred in the road corridor exceed the saturation threshold.
2.7. Analysis of seismic activity
To determine the effect of seismic activity, a pseudostatic method was used in which the force of the earthquake is represented by a fraction of the weight of the mass that slides along the fault surface [8]. Below are the expressions used for the infinite slope model used in this case study, calculating the Dynamic Safety Factor (FSD).
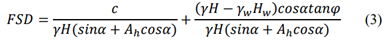
Where H is the depth of the failure surface [m], 𝐻 𝑤 depth of the water table measured from the top of the slope [m], c is the soil cohesion [kPa], φ is the internal friction angle of the soil [º], γ is the unit weight of the soil [kN/m3], 𝛾 𝑤 is the unit weight of water [kN/m3], α is the slope of the terrain [º] and A h is the characteristic acceleration of the study area.
This pseudostatic analysis was applied to different depths of the fault surface and water table. In order to carry out a deep analysis, different depths of the fault surface at 5, 10, and 20m and different heights of the water table of 0, 3, and 5m were considered. So, equation (3) was taken and the FSD was calculated for each of the depths to be analyzed, and a decrease in the FSD was observed as the water table and the depth of the fault surface increased.
2.8. Reliability and probability of failures
To calculate the probability of failure, the First Order Second Moment method, FOSM, was applied. The mean value of the dependent variable is found from the mean values of the independent variables. The moments of equation (3) were analyzed with respect to the independent variables, which in this case were the angle of friction, unit weight, and cohesion. Next, the standard deviation was calculated in terms of the calculated moments of the dependent variable with respect to each independent variable and the variance of the input parameters [15].
Since this probabilistic method was applied, where the uncertainty of the geotechnical parameters is modeled. The use of reliability techniques is recommended, in which reliability is interpreted as the efficiency of a system when performing the functions for which it was designed. This was determined by means of a reliability index that relates the probability of failure and the safety factor calculated with equation (3), taking 1 as the critical value [18,19]. This is how it is defined by Baecher and Christian [20] through the following expression:
Where E[FSD] is given by equation (3), and σ[FSD] is the standard deviation of FSD. It should be clarified that equation (4) corresponding to the reliability index that is applied to the FSD formula, in which the independent variables have a behavior that adjusts to the normal Probability Distribution Function (PDF).
According to the above, we have the function of random variables FSD = f (X1, X2, …, X n ), the expected value of the function is:

Where
 correspond to the mean value of each independent variable, in this case cohesion, friction angle, and unit weight.
Where V(X i ) is the variance of each of the independent variables X i , in this case cohesion, friction angle and unit weight. E[FSD] is the mean of 𝑓 calculated from equation (3) and V[FSD] is the variance of f. In order to find the failure probabilities and by obtaining E[FSD] y σ[FSD], the reliability index was calculated at different depths of the water table. Thus, H w = 0 m was considered as the unsaturated condition and H w = 5 m as the critical saturated condition. In order to apply the normal PDF and obtain the probability of failure for the two mentioned conditions.
2.9. Probability of total failure
For the calculation of the probability of total failure, it was considered to apply the total probability theorem used by Hidalgo [15], where two conditions are considered. One where the water level coincides with the failure surface, the critical condition being saturated, and another when the slope is not saturated, that is, the water level is zero. The failure probability of a slope is defined by Fenton and Griffiths [21] as follows:

Where 𝑃𝑓t is the probability of total failure, 𝑃𝑓t is the probability of slope failure due to seismic activity in saturated condition, 𝑃𝑓t is the probability of failure in unsaturated condition, 𝑃𝑃𝑠𝑠is the probability of soil saturation and (1-𝑃𝑠) is the probability that the soil is not saturated.
The stability analysis in terms of probability of failure by earthquake involves seismic activity when considering a failure surface at a depth of 5 meters and a water table of 0 and 5 meters, which represents the unsaturated and saturated condition, respectively. Similarly, the calculation of 𝑃 𝑠 was carried out by counting the number of times that the saturation threshold was exceeded for each slip. This number of events was divided by the total number of events that exceeded the threshold in the road corridor, to obtain the exceedance probability and finally the Poisson Distribution was applied to determine the marginal probability that the soil is saturated [22].
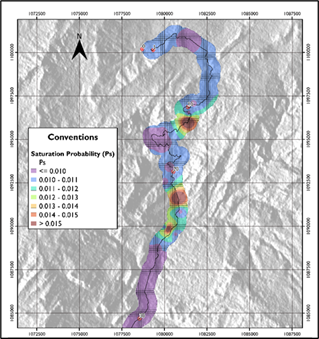
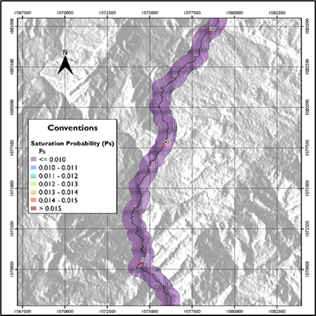
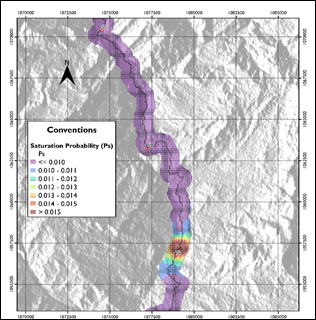
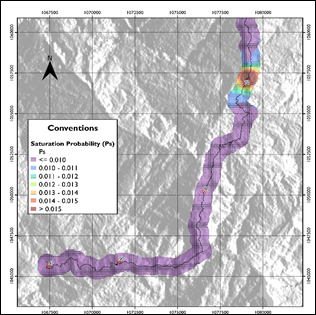
Fig. 3-a, 3-b, 3-c, and 3-d represent the distribution of the probability of soil saturation in the Tunja-Guateque road corridor. It was observed that in the areas where there is a greater probability of saturation, coincides with the location of landslides, which confirms that the main triggering factor in these events was precipitation. Similarly, it was observed in Fig. 3-a that from PR0+000 to PR25+000 there were greater probabilities of saturation. This sector coincides with the municipalities of Tunja, Soracá, and Boyacá which present more than 1000 mm of average precipitation annually. A similar effect is observed in Fig. 3b in PR70+000, which coincides with the municipality of Garagoa, which has an average rainfall of more than 1,300 mm per year [5]. After calculating each one of the probabilities to find the probability of total failure described in equation (7), the probability of total annual failure corresponding to a return time of 475 years was calculated.
2.10. Threat categorization
The threat was categorized based on the probability of total annual failure, according to Chowdhury [23] the threat is very high when (annual PF>0.2), high (0.02-0.2), medium (0.002-0 .02), low (0.002 -0.0002), and very low (<0.0002). In order to have a perspective of the categorization of the threat in the analyzed road corridor, Table 5 was made where it is observed that the threat is medium at 0.14, low at 0.65, and very low at 0.20.
Table 5 Relative frequency of hazard categorization in the road corridor Tunja- Guateque according to Chowdhury [23]
| Categorization according to Chowdhury | |
|---|---|
| Medium | 0.14 |
| Low | 0.65 |
| Very Low | 0.2 |
Source: Own creation
Table 6 Relative frequency of hazard categorization in the Tunja-Guateque road corridor according to the SGC Methodological Guide [24].
| Categorization according to SGC | ||
|---|---|---|
| Low | 0.39 | |
| Medium | 0.61 | |
Source: Own creation
Similarly, the criterion of the SGC Methodological Guide [24] was used, which states that the level of threat can be classified based on the annual probability of failure at high (annual PF>0.16), medium (0.001 -0.16), and low (<0.001).
The categorization was carried out by the two proposed sources and in Table 6, it was observed that according to the Methodological Guide of the SGC, the threat from landslides triggered by precipitation and seismic activity is at 0.61 which is a medium and at 0.39 the threat is low. Therefore, the SGC Methodological Guide is more sensitive to the total annual failure probability data.
Source: Own creation
Figure 3-a Distribution of the probability of soil saturation in the Tunja-Guateque road corridor from PR0+000 to PR30+000.
Source: Own creation
Figure 3-b Distribution of the probability of soil saturation in the Tunja-Guateque road corridor from PR30+000 to PR55+000.
2.11. Model programming
A model was made to represent the threat of the road corridor analyzed in the QGIS software through the probability calculations obtained for different scenarios and taking into account the types of detonating agents that have been studied in this study as a result of precipitation. and seismic activity.
3. Analysis of results
When performing the pseudostatic analysis for a failure surface depth of 5 m and a water table height between 0 m and 3 m, the FSD decrease is 23.37%. For a water table height between 3 m and 5 m the decrease of FSD is 18.46%. For a failure surface depth of 10 m and a water table height between 0 m and 3 m, the FSD decrease is 12.96%, and for a water table height between 3 m and 5 m, the FSD decrease is 9.46%. For a fault surface depth of 20 m and a water table height between 0 m and 3 m, the FSD decrease is 6.86%, and for a water table height between 3 m and 5 m, the FSD decrease is 4.79%. Considering the above, as the water table increases its depth, the FSD decreases.
Taking into account that the landslides recorded in the road corridor are superficial due to the volume of the material that has slid, a failure surface depth of 5 m was considered, and the probability of failure due to an earthquake was calculated in an unsaturated condition with a water table at H w = 0 m and saturated with a water table at H w = 5 m.
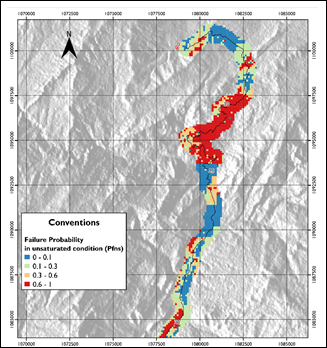
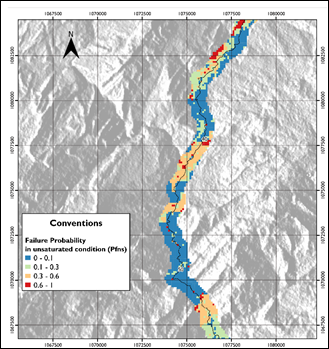
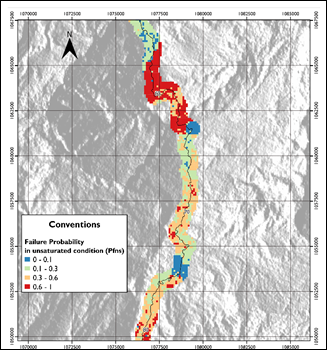
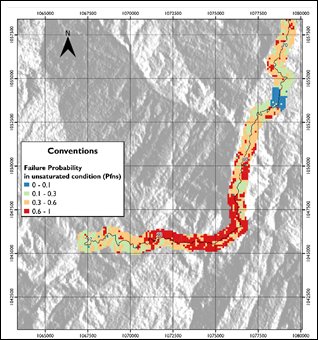
In Fig. 4-a, 4-b, 4-c, and 4d, the failure probability distribution in unsaturated condition P fns was represented and was determined that in areas where it is higher coincided with the data from Fig. 1 from PR10+000 to PR20+000 and PR55+000 to PR65+000. This Geological Unit belongs to an area resulting from the weathering of the rocks of the Arenitas de las Juntas Formation and is characterized by having geomechanical properties of a soil with a low cohesion level that is likely that due to the fact that there is a greater probability of failure in the unsaturated condition from the areas represented in red.
Similarly, the probability of failure in a saturated condition P f s , was analyzed, and was determined that the area where P f s are greater than 0.60 coincides with the area where they have a topography with slopes between 20°-40°, considering a direct relationship with the topography and the saturated condition of the soil. Taking into account the above, all the probabilities necessary to calculate the probability of total failure P f t , according to equation (7), obtained values between 7.726𝑥10 −6 and 0.998. Therefore, it is considered that the probability of total failure incorporates the two triggering factors studied.
However, the greatest probabilities of total failure occur from PR9+000 to PR18+000, due to the high probability of soil saturation due to the behavior of precipitation in this zone at the height of PR30+000 and PR60+000 there was a higher probability of failure due to the passage of the Guayabal Fault combined with abrupt slope changes and pronounced topography as well as from PR80+000 to PR90+000 due to the passage of the Puente de Tabla Fault.
Similarly, the probability of total annual failure corresponding to a return time of 475 years was calculated and the results were between 1.626x10⁻⁸ and 2.102x10⁻³.
According to the probabilities obtained and considering that the landslide hazard can be classified based on the annual probability of failure as high (annual PF>0.16), medium (0.001-0.16), and low (<0.001) according to the SGC Methodological Guide [24]. The Tunja-Guateque road corridor was classified as 39% in low threat conditions due to landslides caused by precipitation and earthquakes, and 61% in medium threat conditions.
Source: Own creation
Figure 4-a Failure probability distribution in unsaturated condition 𝑃 𝑓𝑛𝑠 Tunja-Guateque road corridor from PR0+000 to PR30+000.
Source: Own creation
Figure 4-b Failure probability distribution in unsaturated condition 𝑃 𝑓𝑛𝑠 Tunja-Guateque road corridor from PR30+000 to PR55+000.
Source: Own creation
Figure 4-c Failure probability distribution in unsaturated condition 𝑃 𝑓𝑛𝑠 Tunja-Guateque road corridor from PR55+000 to PR75+000.
Source: Own creation
Figure 4-d Failure probability distribution in unsaturated condition 𝑃 𝑓𝑛𝑠 Tunja-Guateque road corridor from PR75+000 to PR97+000.
Source: Own creation
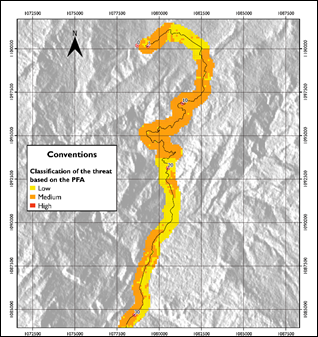
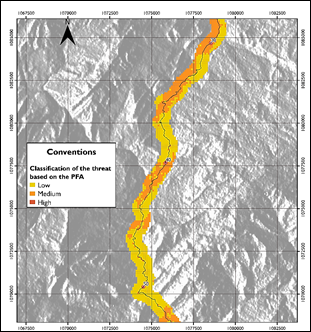
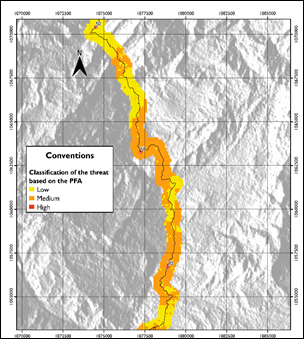
Figure 5-a Distribution of the Tunja-Guateque road corridor threat from PR0+000 to PR30+000.
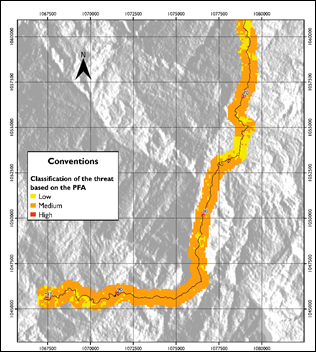
The distribution of the hazard in the road corridor is represented in Fig. 5-a, 5-b, 5-c, and 5-d where it is observed that the areas where the hazard condition is medium coincide with the areas where the probability of saturation increases according to Fig. 3-a, 3-b, 3-c, and 3d. That said, it is a good idea to reaffirm that the consistency of the model is satisfactory, since the critical areas where there are greater probabilities of saturation (precipitation) and failure in the different conditions (seismic activity) coincide with a medium threat categorization being the most critical presented in the road corridor.
Source: Own creation
Figure 5-b Distribution of the Tunja-Guateque road corridor threat from the PR30+000 to PR55+000
Source: Own creation
Figure 5-c Distribution of the Tunja-Guateque road corridor threat from the PR55+000 al PR70+000
4. Conclusions
The failure threshold due to precipitation corresponds to 3 days of accumulated rain with prior accumulated rain of 15 days, where 54% of the landslides were found and is given by the equation R3 = 20 - 0.20R15.
The calculated safety factors are directly impacted by the depth of the failure surface and the saturated condition of the soils as a result of the level of precipitation.
It was observed that the areas of the road corridor where there is a higher probability of total failure are directly related to areas where the topography is pronounced, and slopes are greater than 20°. It can be established that the landslides presented in the Tunja-Guateque road corridor are not triggered only by a triggering agent, be it precipitation or seismic activity, but rather a mixture of them and exacerbated by the topography present in the area.
The model allowed the estimation of the threat in terms of probabilities, which allowed them to be appropriately categorized. As a result, it was determined that 39% of the Tunja-Guateque road corridor were considered to be low threat conditions due to landslides caused by precipitation and earthquakes and 61% in medium threat conditions.
5. Recommendations
It is recommended to continue with the study of the road corridor in such a way that the adequate analysis and risk assessment are achieved with the purpose of proposing and implementing an Early Warning System consistent with the present conditions.
It is suggested that this methodology, which aims to achieve the estimation and analysis of threat, vulnerability, susceptibility, and risk, can be considered as a route selection criterion for the definition of the layout of road infrastructure projects in the prevailing conditions of climatic variability in such a way so as to seek to reduce the damages and losses that may occur in these types of projects.

