


 Inglés (pdf)
 Articulo en XML
 Referencias del artículo
 Enviar articulo por email
 Citado por SciELO
  Citado por Google
  Similares en
SciELO
Similares en
SciELO  Similares en Google
 Permalink
1. Introduction
Climate change is an issue of global scope and concern, being the human being the main responsible. This phenomenon is caused specifically by the concentration of greenhouse gases in the atmosphere, which leads to changes in temperature, humidity and wind speed, causing repercussions on all living beings [1].
The Carbon Footprint (CF) measures the impact of all GHGs such as carbon dioxide (CO2), methane gas (CH4), nitrous oxide (N2O), hydrofluorocarbons (HFCs), perfluorocarbons (PFCs) and sulfur hexafluoride (SF6) produced by day-to-day activities, either in tons (tCO2eq) or kilograms (kCO2eq) of carbon dioxide equivalent [2]. Different methodologies have been designed for their calculation, but the most widely used in public and private organizations are the Green House Gas Protocol (GHG Protocol) or the ISO 14.064-1 standard [3]. It is also an environmental indicator that brings a series of benefits with it, such as the reduction and neutralization of GHG emissions and adds value to the institution in terms of its contribution, commitment, environmental responsibility and awareness of climate change issues [4].
The carbon footprint in Peru was designed by the Ministry of Environment as a tool to know the progress and achievements of public and private organizations in reducing their greenhouse gas emissions, as well as the actions taken to reduce them[5].. The official guide for the operation of the carbon footprint tool was approved by Ministerial Resolution 237-2020-MINAM, formalizing the basis for the measurement and reduction of GHG emissions and detailing the procedures for obtaining and recognizing the management of emissions through verification, reduction, and neutralization of companies and institutions [6].
The objective of this study is to estimate the carbon footprint at the National University of Jaen, Peru for the year 2021 using the methodology proposed by GHG Protocol and ISO 14064-1:2006, this will allow us to know the contribution of the university community to the emission of GHG, besides being the basis of reference for future work in the constant search for the reduction of emissions produced as a result of functional activities.
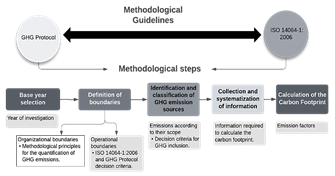
Fig. 1 shows the graphical representation of the methodological steps to be followed to calculate the carbon footprint, with their respective criteria as proposed by the GHG Protocol and ISO 14064-1:2006.
2. Materials and methods
The research was conducted in the local 01 (SML01) of the National University of Jaén located in the province of Jaén, department of Cajamarca, Peru. When it had an average of 30 administrative offices, 80 administrative workers, and 2,292 students. Using an organizational approach, we worked with the methodology proposed by the GHG Protocol and ISO 14064-1:2006 [7].
2.1. Delineation of GHG emission sources
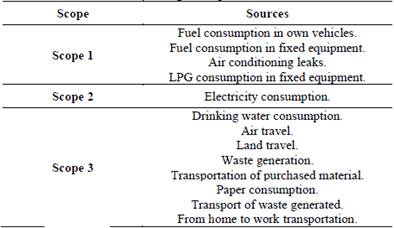
The institutional organization chart was reviewed to determine the operational offices in 2021, then an on-site visit was made to the University's facilities in order to recognize the emission sources associated with administrative activities: fixed equipment, air conditioning leaks, LPG consumption in canteens, SEIN electricity consumption, drinking water consumption, ink and toner consumption, waste generation and GHG paper consumption.
The methodological criteria established by the GHG Protocol and the International Standard ISO 14064-1 were followed.
2.1.1. Boundary definition
For the organizational boundary, the five principles established in the GHG Protocol [8] and ISO 14064-1:2006[9]., all this is presented in Table 1. All of which are presented in Table 1. In addition, the pre-specialty factor of office operations for 2021.
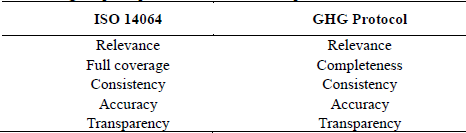
Table 2 details the decision criteria for the operational limit as proposed by ISO 14064-1:2006 and the GHG Protocol, which provide categories by type of emissions: Scope 1, Scope 2, and Scope 3 [7,10].
2.1.2. Identification and classification of greenhouse gas emission sources
The different sources of emissions were identified and classified, and then an inquiry was made with each of the administrative workers who perform on-site work about the use of energy for office equipment. This information is part of the inputs for preparing a mitigation plan.
For the operational limit, the GHGs considered in the national inventories and determined in the Kyoto Protocol were identified: CO2, CH4, N2O, SF6, HFC and PFC [11,12]. For the analysis, only three GHGs (CO2, CH4 and N2O) were incorporated under the decision criteria established in ISO 14064-1:2006: the significance of the emissions with respect to the total, representativeness of the activity and/or processes in the organization and the availability of data [9].
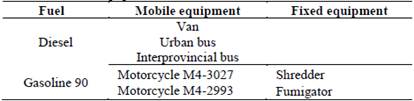
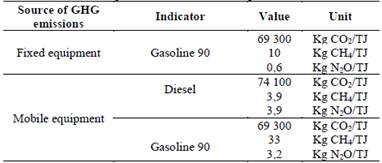
For the identification of GHG sources, direct emissions from the combustion of mobile and stationary equipment in operation in 2021 were taken into account. Table 3 classifies mobile and stationary equipment according to the type of fuel used at the UNJ.
2.2. Collection and systematization of information
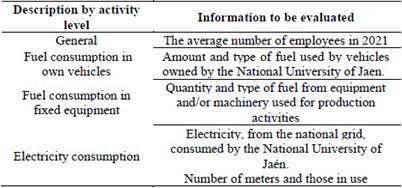
Table 4 details the information requested from the heads of the different administrative areas of the UNJ.
To facilitate the systematization, standardization, and processing of the data, a spreadsheet format was prepared in Excel application software, where monthly information was recorded on consumption by the level of activity (fuel and electricity consumption). The formats were adapted from the Eco-efficiency Guide for Public Sector Institutions [6].
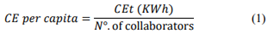
For the calculation associated with per capita energy consumption (CE per capita), the total consumption of electrical energy (CEt) was divided by the number of UNJ workers (N°. of collaborators) [13], as shown in Eq. (1).
2.3. Carbon footprint calculation
For the calculation of HC, based on Scope 1, the guidelines indicated by the Intergovernmental Panel on Climate Change were verified for the preparation of national inventories in 2006 [14], and for Scope 2 those established by Peru [10].
Next, the equations for calculating the carbon footprint are presented, the same ones that were adapted by Rita E. Morales, [7].
a. Conversion and emission factors were selected and these values were recorded in order to quantify the GHG emissions (CO2, CH4, and N2O) generated by activity level.
b. For fuel consumption, the equivalent associated with each fuel was calculated, in terms of heat, expressed in Terajoule (TJ), by multiplying the total fuel consumption per level of activity, expressed in physical units consumed by the caloric value according to the type of fuel, according to Eq. (2).

Where U is the physical units of fuel consumed expressed in Gallons (Gal); V, the calorific value expressed in terajoule over gallons (TJ/Gal); E the energy consumption of the fuel expressed in terajoule (TJ).
The values of V were extracted from [15], which are the calorific powers established for fixed and mobile equipment as detailed in Tables 5 and 6.
c. With the energy consumption data for each fuel, the conversion to GHG emission equivalent was performed, the operation is represented in Eq. (3).

Where, GHG emissions are CO2, CH4, and N2O emissions expressed in Tons (t); NA expresses the level of activity as fuel consumption expressed in terajoule (TJ) and energy consumption expressed in kW/h; FE is the emission factor expressed in Kg/TJ for fuel consumption. The emission factors used are detailed in Tables 7 and 8.
Table 5 Calorific values used by fuel type for fixed equipment
| Fuel | Caloric value | Unit |
|---|---|---|
| Gasoline 90 | 1.20E-04 | TJ/gal |
Source: MINAN (2016).
Table 6 Calorific values used by fuel type for mobile equipment
| Fuel | Caloric value | Unit |
|---|---|---|
| Diesel | 1.35E-04 | TJ/gal |
| Gasoline 90 | 1.18E-04 | TJ/gal |
Source: MINAM (2016).

d. To quantify GHG emissions (CO2, CH4 and N2O), total GHG emissions were calculated, expressed in tons of carbon dioxide equivalent (tCO2). The calculation was made by multiplying the GHG emissions (CO2, CH4 and N2O) expressed in tons, by their corresponding global warming potential. The operation is expressed in Eq. (4).


Where, GHG ET, are the total GHG emissions expressed in tCO2eq; GHG Emission, those Emissions of CO2, CH4 and N2O expressed in tons; GWP, the Global Warming Potential of GHG.
3. Results
3.1. Delimitation of GHG emission sources
Table 9 shows the list of the 29 administrative offices that were in operation on a face-to-face basis at the National University of Jaen for 2021.
Table 10 shows the operational limit of the UNJ which is divided into direct emissions (fuel consumption) and indirect emissions (electricity consumption).
Emission sources were divided by scope and by activity, where own and stationary vehicles were placed in scope 1 and electricity in scope 2, as shown in Table 11.
3.2. Collection and systematization of information
Table 12 shows the total fuel consumption by mobile equipment, which was 1,574.66 gallons, while the consumption by fixed equipment was 12 gallons, resulting in a total of 1,586.66 gallons for both sources.
Table 10 Operational limit of the National University of Jaen according to direct and indirect emissions.
| Scopes | Activity | |
|---|---|---|
| Direct Emissions | Scope 1 | Fuel Consumption |
| Indirect Emissions | Scope 2 | Electricity Consumption |
Source: The authors.
Table 11 Emission sources at the National University of Jaen
| Scopes | Activity | Emission source |
|---|---|---|
| Scope 1 | Fuel consumption | Own vehicles Fixed equipment |
| Scope 2 | Electricity consumption | Electricity |
Source: The authors.
Table 12 Monthly fuel consumption by mobile and fixed equipment
| Month | Emission Source | Consumption (Gal) | |
|---|---|---|---|
| Mobile equipment | Fixed equipment | ||
| January | Mobile fuel consumption | 124.4 | 0 |
| February | 105.53 | 0 | |
| March | 120.21 | 0 | |
| April | 248.84 | 0 | |
| May | 122.44 | 4 | |
| June | 160.465 | 4 | |
| July | 121.42 | 4 | |
| August | 125.88 | 0 | |
| September | 82.59 | 0 | |
| October | 109.38 | 0 | |
| November | 142.25 | 0 | |
| December | 111.25 | 6 | |
| Total | 1574.66 | 12 | |
Source: The authors
The UNJ consumed a total of 1,341.66 gallons of diesel (D-EM) fuel and 233 gallons of gasoline for its mobile equipment (G90-EM), while the consumption per fixed equipment was 12 gallons of gasoline (G90-EF) as shown in Fig 2. The low consumption of diesel fuel is due to the fact that the university only used diesel fuel for the use of two motorcycles, which were used for short trips.
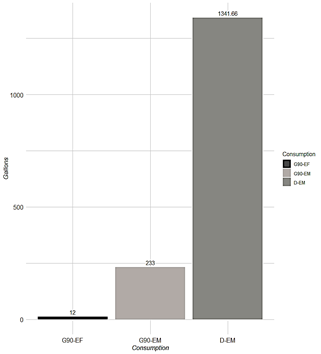
Table 13. Type of Meters of the National University of Jaen.
| Meter | 1 | 2 | 3 |
|---|---|---|---|
| Nº serial | 00018569384 | 607906171 | 000JB005228 |
| Connection type | 3φ | 1φ | 1φ |
Source: The authors.
In 2021, the UNJ provided its academic and administrative services at its main headquarters, which was located on Cuzco Street and had two meters (single-phase and three-phase). For storage operations, it was supplied with a single meter (single-phase) for electricity consumption. These offices are no longer part of the UNJ since June 2021. Table 13 shows the serial number and connection type of the meters mentioned above.
According to Table 14, electricity consumption in 2021 was 87,629.05 kW/year, with February being the month of lowest consumption with a value of 4,282.18 kW and November the highest with 12,168.92 kW, also from September-December electricity consumption is higher.
According to equation (1), per capita energy consumption was 1 091.61 kWh per year, that is, each administration accounted for 1.24% of total electricity in 2021.
Table 14 Monthly electricity consumption in Scope 2 in the year 2021
| Month | Emission Source | Consumption (kW/ month) |
|---|---|---|
| January | Electric power | 4,532.09 |
| February | 4,282.18 | |
| March | 5,367.75 | |
| April | 4,401.77 | |
| May | 5,461.62 | |
| June | 4,952.00 | |
| July | 5,315.07 | |
| August | 7,845.72 | |
| September | 11,047.50 | |
| October | 10,311.40 | |
| November | 12,168.92 | |
| December | 11,943.04 | |
| Total | 87,629.05 |
Source: The authors.
3.3. Carbon footprint calculation
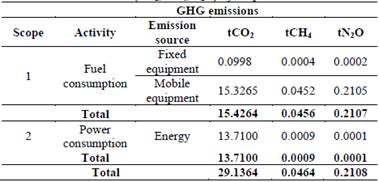
A total of 29.1364 tCO2, 0.0464 tCH4, and 0.2108 tN2O were generated. The fixed equipment emission source was the one that emitted the least GHG with a representation of 0.0998 tCH4, 0.0004 tCH4 0.0002 tN2O, (Table 15).
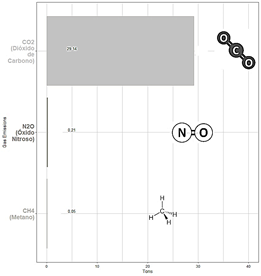
More tons of CO2 and less CH4 were released, with a range difference of 28, 9256 t, as seen in Fig. 3.
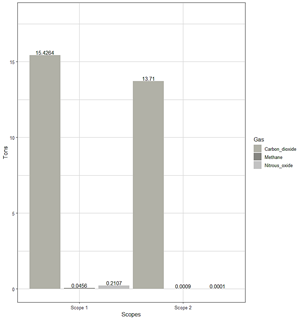
Scope 1 emitted 15.4264 tCO2, 0.0456 tCH4 and 0.2107 tN2O and scope 2: 29.1364, 0.0464 and 0.2108 t for CO2, CH4, N2O (Fig. 4).
3.3.1. Carbon footprint
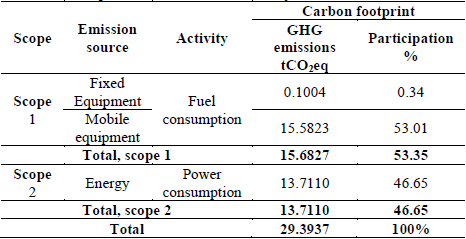
The National University of Jaen generated a total of 29.3937 tCO2eq, with Scope 1 responsible for the emission of 15.6827, with 0.34% of intervention due to fuel consumption in fixed equipment and 53.01% in mobile equipment. On the other hand, Scope 2 showed an amount of 13.7110 tCO2eq equivalent to 46.65% of intervention due to electricity consumption, as detailed in Table 16.
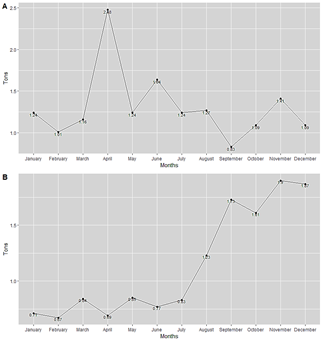
Fig. 5 shows the comparison of total monthly CO2eq emissions by scope, where scope 1 (Fig. 5 A) showed that fuel consumption in April produced 2.4792 CO2eq, the highest value, and September the lowest with 0.8301 CO2eq. Meanwhile, in scope 2 (Fig. 5 A), for energy consumption, November and February were the months that generated the most and least tCO2eq, respectively.
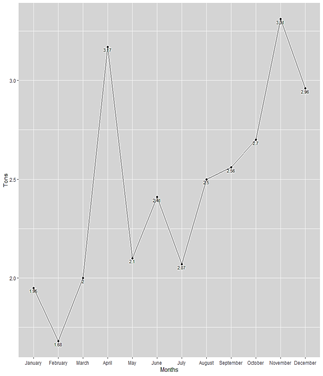
In November 3.3127 tCO2eq was produced, which is the highest during 2021, while February showed an estimate of 1.6807 ttCO2eq, which is the lowest for this year, as shown in Fig. 6.
3.4. Statistical data information
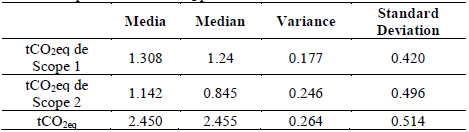
The monthly median carbon emissions resulting from electricity use (Scope 2) showed a significant difference (p = 0.021) during the study period. In contrast, gasoline use (Scope 1) showed no significant difference in carbon footprint (p = 0.139). Regarding the carbon footprint the monthly mean is 2.450 tCO2eq, the median 2.455 tCO2eq, the variance 0.264 tCO2eq and the deviation has a value of 0.514 (Table 17).
4. Discussion
The National University of Jaen generated a total of 29.3937 tCO2eq in the year 2021. When comparing the results of this work with other universities, large differences can be found. In particular Kiehle in his study obtained 19,072 tCO2eq of emissions at the University of Oulu for the year 2019 [16], in contrast Geneidy points out that the University of Jyväskylä reported a carbon footprint of 40,873 tCO2eq for the same period [17]. Although there are differences such as infrastructure and number of students in the universities, the main disagreement is that the University of Oulu decided to exclude scope 2 from its assessment, while the UNJ includes electric energy and therefore has higher emissions of tCO2eq, this indicator was considered due to the constant use of fans, it should be noted that the UNJ is located in a very hot area and the environments (infrastructure) are usually enclosed spaces.
In terms of emissions generated, Scope 1 is responsible for 53.35% for both fixed and mobile equipment. On the other hand, Scope 2 has an equivalent of 46.65% of intervention due to electricity consumption. Undoubtedly, most of the carbon impact of the National University of Jaen is due to the use of fuels with a consumption of 1,586.66 gal/year, on the contrary, Helmers reports that the percentages of electrical energy consumption have a greater impact on universities, because they have a share of up to 76.8% [4].
Scope 1 generated a consumption equivalent to 1,586.66 gal/year for the year 2021, the major source being diesel with 1,341.66 gal, on the contrary scope 2 has as main indicator electric energy generating a total energy expenditure of 87,629.05 kW/year. Thus, February was the month with the lowest energy consumption, with an increase in September (100%), mainly due to staff attendance at the university campus. The behavior of emissions has a tendency to increase due to the fact that between September-December the administrative staff of the UNJ began to go more frequently to their respective areas, due to the easing of the restrictions implemented by the Peruvian government to curb the COVID-19 pandemic.
During the COVID-19 epidemic in 2021, the carbon footprint decreased slightly (January-August), probably due to the reduction in the number of workers performing face-to-face work. The results support the findings of Moroka and Raya, who indicated that the cofinancing measures imposed to reduce the impact of the pandemic had shown a considerable reduction in carbon emissions [18,19].
5. Conclusions
The National University of Jaen for the period 2021 estimated a carbon footprint of 29.3937 tCO2eq, with CO2 being the most predominant GHG with a total of 23.1364 tCO2, followed by N2O with 0.2108 tN2O and lastly 0.0464 tCH4.
The sources of GHG emissions at the National University of Jaen were delimited by scope and also by activity, where in scope 1 I consider fuel consumption and in scope 2 electricity consumption.
Scope 1 generated 13.7110 tCO2eq, while Scope 2 generated the most GHG emissions, with a value of 15.6827 tCO2eq.
The data collection of emission sources according to the prioritized activities identified that fuel consumption in mobile equipment was supplied with 1,341.66-gal Diesel and 233.00-gal Gasoline 90, on the other hand, for fixed equipment there were 12 gal of Gasoline 90, in the field of energy use it was identified that the university consumed 87,629.05 kWh.
The UNJ in 2021 generated a per capita consumption of 1,091.61 kWh of electricity per year.
November generated the highest amount of greenhouse gases of 3.3127 tCO2eq due to higher energy consumption.

