


 Inglês (pdf)
 Artigo em XML
 Referências do artigo
 Enviar este artigo por email
 Citado por SciELO
  Citado por Google
  Similares em
SciELO
Similares em
SciELO  Similares em Google
 Permalink
1. Introduction
In this contribution, the manufacturing operations of an organization engaged in producing "non-standardized products" in the metal-mechanic sector are examined. For this entity, its occupational hazards and manufacturing competitive advantages were analyzed. This way, the following factors were identified as priorities: "non-conforming" ratio generated by worker fatigue, sound intensity, lighting level penalty, processing time and direct personnel costs.
In particular, from the social dimension of sustainability, the evaluation of "occupational hazards" is a fundamental element that aims to maintain and improve people's physical and emotional health in the workplace [1-3]. In this sense, what has been previously explained is related to the specific content of the eighth sustainable development goal in the 17 goals designed in this area by the United Nations Organization and whose compliance goals are defined for the year 2030 [4]. This goal points out, among other aspects, the need to ensure people's health and the protection of healthcare systems in the workplace.
Based on the above, regarding the "nonconforming" proportion generated by worker fatigue, it is mentioned that the company is intensive in the use of labor, so the probability of obtaining defective products increases as the working day goes by [5-6]. Likewise, the company detected that fatigue in the workstations comes from exposure to handling heavy materials, vibrations and ambient temperature.
Likewise, concerning the sound intensity variable, it is stated that the company uses equipment with the capacity to emit sound intensity levels close to or higher than 90 decibels. Therefore, when the optimum process time is identified, this intensity level will increase because several pieces of equipment will operate simultaneously [7].
In turn, in the case of the lighting level penalty, the aim is to detect those work organization programs close to the optimum process time, whose implementation allows the tasks to be executed in the presence of natural lighting or, failing that, under normal operating conditions of the artificial lighting system.
Regarding the processing time, the company establishes it using dispatch rules (SOT, EDD, FCFS, LCFS, LOT). In this regard, implementing these rules causes a low level of productivity in the manufacturing systems. [8-9].
Regarding direct personnel costs, the entity's highly variable demand causes inconveniences in establishing the organizational form of the operations system associated with the lowest cost.
Globally, it is aimed to define the planning horizon of the production system, able to meet the following conditions: minimize labor risk (minimum exposure to vibration, weight handling and ambient temperature, which in turn results in obtaining a lower proportion of non-conforming production; the minimum level of sound intensity emitted; and lower level of lighting penalties), achieve the due delivery opportunity in the manufacturing process (identification of the minimum process time) and also, detect the minimum personnel cost.
By evaluating the above, it is stated that this study develops the process of multi-objective sustainability reduction of the following social and economic variables: "non-conforming" proportion generated by worker fatigue, sound intensity, lighting level penalties at the work site, processing time and direct personnel costs.
In addition, it is noted that the detection of the minimum value corresponding to the "non-compliant" fraction caused by worker fatigue will lead to the control of exposure conditions to weight handling, vibrations and ambient temperature.
Regarding the observed variables, it is necessary to establish the minimum processing time in the first step. Consequently, the parameter estimation in question, since there are "JT" jobs and "PC" processing centers, implies the analysis of JT!PC solutions [10-12]. Therefore, the difficulty arises to explore with the necessary timeliness JT!PC feasible points [13-6]. Thus, an algorithm structured from "multi-objective genetic algorithms" technique concepts [17-19] is developed in this paper. Thus, the designed algorithm would allow the simultaneous optimization of the selected factors once the processing time is established.
Similarly, some developments of the technique called "genetic algorithms" are illustrated below. For this purpose, the following "classes" are defined. Operator redefinition in the production of "non-standardized goods," determination of algorithms in the production of "non-standardized goods," sustainability analysis with a primary focus on energy consumption evaluation, and, finally, multi-objective evaluation in the production of "non-standardized goods." These "classes" are shown below:
Operators in the production of "non-standardized goods" are redefined. This category includes three documents. The papers seek to ensure the highest dominance of solutions in the new generations. The above is achieved by restructuring the crossover and mutation operations [20-21-22].
Determination of algorithms in the production of "non-standardized goods." Four contributions are recorded for this purpose, whose perspective seeks parallel minimization of processing time and direct personnel costs [23-26].
Sustainability analysis with a primary focus on the evaluation of energy consumption. Eleven articles are identified in this case that considers the exclusive study of energy consumption as a criterion for sustainability analysis [13,27-36]. The above documents do not examine other environmental aspects or other relevant factors of a social nature, as is the particular case of occupational health and safety.
Multi-objective evaluation in the production of "non-standardized goods." In this class, ten contributions are identified. These contributions can be categorized into exact techniques or heuristic techniques. Concerning the perspective of exact techniques, two articles oriented to examine multi-objective sequencing in "Job Shop" were detected. Thus, the first of these articles incorporates the following methods in its analysis: Monte Carlo simulation, Markov chains, and waiting lines [14], while the second article uses the Branch and Bound technique [37].
Exact technique implementation evolved towards the design of heuristic techniques due to the existing limitations in treating complex problems. Accordingly, the other eight contributions correspond to the field of heuristics. In particular, three papers deal with the structuring of multi-objective algorithms. In turn, four other developments propose the solution of specific problems through the design of hybrid algorithms. Finally, the last contribution exposes the trends of multi-objective sequencing in obtaining "non-standardized" goods.
The review of the three articles based on the definition of multi-objective algorithms shows that they focus on analyzing certain parameters not reported in the literature in relation to some relevant research situations.
Thus, in the first application, an algorithm is implemented in a dynamic environment (random occurrence of adverse events) to minimize the manufacturing system's processing time and instability [38]. Regarding the second development, an algorithm that improves the protocol's performance defined in NGSA-II is structured [39]. Regarding the third one, an algorithm that minimizes both the processing time and the deterioration of the machines according to their utilization level in real time is defined [40].
The following four developments correspond to a series of hybrid protocols that aim to detect the minimum values of the variables discussed below: processing time, total working weight, and maximum working weight [41-44].
In addition, the eighth development synthesizes, among others, the evolution of the production-sequencing problem of "non-standardized" goods and obtains the projection of its trends [45].
The literature review shows that the simultaneous analysis of the variables examined in this study has been carried out superficially in the contributions evaluated. Similarly, the issue of occupational health and safety has been scarcely studied in depth in the sequencing of manufacturing processes at a multi-objective level [46-48].
Additionally, it is stated that the organization under review will also achieve other benefits, such as a reduction of the level of noise emitted to the community of influence. In Addition, attenuation of the proportion of people affected by occupational hearing loss in the regional and national health systems since the sound intensity coming from the operation of machines and equipment will be controlled. Reduction of metal waste and carbon dioxide emissions generated during the reprocessing of "nonconforming" products in the manufacturing system; and reduction of the number of people affected by musculoskeletal diseases since the level of vibrations, ambient temperature, and weight handling will be reviewed.
Finally, this paper will set out the materials and methods; later, the results will be recorded, followed by their discussion, and, finally, the conclusions will be structured. Next, the previously mentioned stages will be presented.
2. Materials and methods
In this section, steps 1 to 6 describe the operation mode of the redesigned genetic algorithm (first method). In contrast, in step 7, the operation mode of the algorithm corresponding to the execution of weighted sums (second method) is shown. Similarly, step 8 compares the results obtained by executing both methods.
Step 1 Obtaining start-up population
Based on the characteristics of the evaluated company, n orders to be examined are observed. These orders by exchanging positions constitute n! solutions. Each solution includes six subsolutions. The segments of Table 1 represent a subsolution: "Solution," "work rotation," "working hours," and "works 6 or 7 days a week".
Thus, in the "solution" segment, the individual is illustrated as an example: "6-3-8-9-9-1-4-7-5-2". This solution comes from one of 9! possible permutations (nine working orders in total: from the first order in the example, which corresponds to order 6, to the last order in the same example, i.e., order 2). In the individual named above, it is pointed out that "order 6" would be equivalent to the first order to be transformed; thus, "order 2" would correspond to the order processed in ninth place. Six "ways" of structuring the work shifts are identified for each solution. These "forms" can be seen in the segments of Table 1: "Work rotations" and "working hours." According to the data in these segments, it is defined that a sollows: one 8-hour shift, two 8-hour shifts or three 8-hour shiflution can be scheduled in three types of shifts each day, as fots (first shift: 6 a.m. to 2 p.m.; second shift: 2 p.m. to 10 p.m.; third shift: 10 p.m. to 6 a.m.). Similarly, in the segment: "Work 6 or 7 days a week", it is indicated that the solution can be analyzed in two work schedules: up to Saturday (6 days) or with a Sunday holiday (7 days). Table 1 is recorded below.
Each sub-solution recorded in Table 1 will be treated from this point of the document as a specific solution. Consequently, the scheme concerning the organization of a solution is recorded in Table 2. In the scheme, 11 segments are observed. In new of them, the work orders are arranged. For the case, "segment 1" is associated with "order 6", representing that such "order" would be scheduled first. When the segment number is increased to "segment 9", it is established that "order 2" is assigned to this segment; therefore, the order above will enter the production plant in ninth place. Likewise, "segment 10" shows the number of hours worked each day (in the example, 8 hours: starts at 6 a.m. and ends at 2 p.m.). Finally, "segment 11" refers to the number of days scheduled per week (7 for the example, since it includes the term "with Sunday").
According to Table 2, "S" solutions are randomly generated.
Table 1 Ways to structure work shifts.
| Sub-solution number | Solution | Job rotations | Workdayhours | Work 6 or 7 days a week |
|---|---|---|---|---|
| 1 | 6-3-8-9-1-4-7-5-2 | 6 a 14 | 8 | Up to Saturday |
| 2 | 6-3-8-9-1-4-7-5-2 | 6 a 14 - 14 a 22 | 16 | Up to Saturday |
| 3 | 6-3-8-9-1-4-7-5-2 | 6 a 14 - 14 a 22 - 22 a 6 | 24 | Up to Saturday |
| 4 | 6-3-8-9-1-4-7-5-2 | 6 a 14 | 8 | Inc Sunday |
| 5 | 6-3-8-9-1-4-7-5-2 | 6 a 14 - 14 a 22 | 16 | Inc Sunday |
| 6 | 6-3-8-9-1-4-7-5-2 | 6 a 14 - 14 a 22 - 22 a 6 | 24 | Incl Sunday |
Source: prepared by the authors.

Step 2 Group definition
Size A population is divided into five groups. Each group will allow the evaluation of one objective and will be composed of A/5 solutions. The solutions per group are analyzed and sorted in ascending order. Subsequently, 30% of the solutions with a higher value are removed per group.
Then the processing time of each group is established. The variable in question is estimated from the application of eq. (1):
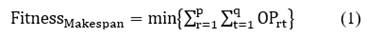
In eq. (1): "p" = the number of orders; "q" = the number of equipment; "r": index varying from 1 to total orders; "t": index fluctuating from 1 to total equipment; "Ost" = operation time of order "p" on equipment "q"; and FitnessMakespan = processing time of the evaluated orders.
The groups are then examined with estimation techniques as follows:
Estimation technique for the "non-conforming" proportion. This technique is based on the data processing corresponding to the "non-conforming" fraction established by the organization examined. Thus, the "non-conforming" proportion allocated over the scheduling horizon, given that there are orders in process at the hourly level, is totaled and multiplied by 100.
Sound intensity estimation technique. The first step to implementing the method under consideration is identifying the sound intensity in each working hour. Then, its percentage participation to 90 decibels is determined. This participation is recorded in each of the hours that make up the production horizon. Then, the sum of the participation previously mentioned is added up. Finally, the previous sum is related to the projected number of shifts.
Lighting level estimation technique. The hourly Lighting level in a particular work area is first established in this case. Later, the degree of hourly compliance is estimated as far as lighting level is concerned. This degree of compliance is determined by finding the mathematical equivalence between the actual and required lighting levels in the evaluated area. For example, if the lighting needs of such an area amount to 2000 lumens and the direct measurement yields a result of 500 lumens, a degree of compliance of 25% would be achieved. Subsequently, the penalty level per hour is obtained, which is given by calculating the difference between the ideal goal of 100% and the degree of compliance defined for the area under analysis. Finally, the penalties identified for each of the hours that make up the projected production plan are consolidated. Thus, the total score to be examined is quantified.
Technique for estimating direct personnel costs. This estimation is obtained from the following work schedules: 6 a.m. to 10 p.m. (16 hours for the first and second shifts combined) or 10 p.m. to 6 a.m. (8 hours for the third shift) on working days or Sundays. Each production schedule's hours, depending on the day (working or Sunday), is assigned a specific score. This score comes from the percentage overpayment concerning the standard working day wage base. Consequently, the sum of the score defined for each hour and work center observed in the projected production plan is added.
Step 3 Establish the first population structure
The first population structure is integrated: each group of 0.7A/5 solutions is divided into five segments. From each of the segments, 0.02A solutions are randomly removed. Together the groups provide 0.5A solutions to the first population. These 0.5A solutions are affected with a crossover ratio of 97%. The task is run until an additional amount corresponding to 42% of the population is generated. Such crossover is performed by exchanging those genes that include the work orders between solutions. In turn, 7% of the solutions are determined by applying the mutation operation with a 12% probability to 90% of the population of size A already created. In addition, the remaining 1% of the solutions are extracted from the total number of possible solutions to strengthen diversity. Additionally, it is indicated that to execute the operations of the genetic algorithms, crossover, and mutation, the segments (genes) related to the hours or days projected respectively per day or week are not considered.
Step 4 Determine the Pareto structure in the defined population
The solutions of the first population are evaluated in the various objective functions; then, the estimated values for each solution are compared with those determined for the other solutions in the population in question. Consequently, the "dominant" solutions are segregated, i.e., the solutions whose values are strictly lower in the various objective functions or, failing that, which, being equal in some of them, have lower values in the other functions. Concerning the above, the first group of solutions obtained constitutes the first Pareto front. Then, the previously explained process is applied to the dominant solutions of the population until a new level of best individuals is identified each time.
Step 5 Establish the second population structure
The second population structure is made up as follows: 0.5A solutions come from the first Pareto fronts established in step 4; for this purpose, the level of dominance corresponding to each front is used as the order of priority assignment. In addition, 0.3A solutions originate from the random crossing of the individuals that make up the first three fronts; if there were only two or a single front, the crossing operation would be carried out between the solutions of the existing fronts. In addition, 0.19A solutions come from the random mutation of the 0.8A individuals previously obtained. To close 0.01A solutions, they are taken randomly from the complete set of solutions to ensure population divergence.
Step 6. Define the Pareto structure of the population identified in step 5
The Pareto structure of the population identified in step 5 is determined as recorded in step 4.
Step 7. Performance evaluation of a linear function by solution (second method)
The activities described below are carried out in each program cycle. Randomly generate A solutions; estimate the objective functions for each solution generated; establish the performance of the linear function per solution; and, finally, choose the solution that corresponds to the highest value of such linear function. Then, consolidate the selected solutions into a single population; re-estimate the performance of the linear function per solution for the chosen solutions; and, finally, identify the best-performing solution, i.e. the solution with the highest performance in terms of the linear function applied.
Eq. (2) shows the form of estimation relative to the weighted valuation of each solution in each function analyzed.
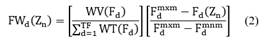
In eq. (2): Fd= Each function analyzed; Fdmxm = upper value in the set of response solutions per function examined; Fdmnm = lower value in the set of response solutions per function evaluated; Fd(Zn) = response value of each Zn solution per function; Zn = number of revised solution in each function; n = number of solutions in each response population (n varies from 1 to the total number of response solutions in each population); WV(Fd) = weighted value of each function (its determination comes from the decision of the work team in the company, being able to fluctuate between 0 and 100%); WT(Fd) = total weighted factors of the functions (the consolidated is 1); TF = total functions to be evaluated; d = index varying from 1 to the total functions to be examined (TF); FWd(Zn) = weighted valuation of each solution in each function analyzed.
After estimating FWd(Zn), the total weighted valuation of each solution for the set of evaluated solutions is established in eq. (3).
In eq. (3): FWT (Zn) = weighted total rating of each solution for the set of evaluated functions.

Step 8 Check the designed methods
The analysis of the populations identified according to the proposed methods is carried out using the value corresponding to the C-Metric indicator (dominance indicator when comparing the results of the multi-objective methods) [49-50-51] as a comparison parameter [49-51].
3. Results
The populations determined through the application of the methods designed and the methods in question are then analyzed.
Population established according to redesigned genetic algorithm implementation (first method)
As described in the section "materials and methods", Table 3 shows the results of two solutions concerning the 220 specimens that make up the response population structure. The values corresponding to the average and variation coefficient for each variable examined are also shown for this population. The estimates are recorded in points in Tables 3, 4, 5 and 6.
According to the contents of Table 3, the following characterization in the number of solutions in the Pareto structure is determined: 71 on the first front, 63 on the second front, 36 on the third front, 29 on the fourth front and 21 on the fifth front.
The population is determined according to method implementation based on a linear function by weighted sums (second method)
Table 4 reports the results from step 7 of the "materials and methods" section. Two solutions of the 220 solutions detected in the final response population are recorded in this regard. Likewise, the values concerning the average and the variation coefficient per variable are recorded for the latter population.
Table 3 Results summary (first method).
| Position solution in the population | Makespan (hours) | Makespan (weeks) | Estimate costs | Estimated ratio | Estimate sound | Estimated lighting |
|---|---|---|---|---|---|---|
| 8 | 210 | 2,18 | 0 | 1720 | 842 | 1522 |
| 137 | 218 | 1,51 | 2015 | 1985 | 881 | 1738 |
| Average | 248,70 | 2,27 | 1408,21 | 1832,26 | 786,26 | 1758,23 |
| Coefficient Variation | 0,12 | 0,63 | 1,04 | 0,23 | 0,47 | 0,42 |
Source: prepared by the authors.
Table 4 Results summary (Second method).
| Position solution in the population | Makespan (hours) | Makespan (weeks) | Estimate costs | Estimated ratio | Estimate sound | Estimated Lighting |
|---|---|---|---|---|---|---|
| 6 | 228 | 2,38 | 0 | 1524 | 773 | 1396 |
| 205 | 195 | 2,03 | 0 | 1650 | 846 | 1462 |
| Average | 203,44 | 3,08 | 0 | 1628,37 | 828,25 | 1478,23 |
| Coefficient Variation | 0,042 | 0,32 | 0/0 | 0,15 | 0,18 | 0,17 |
Source: prepared by the authors.
Likewise, the dominance analysis of the second response population allows us to conclude that the solutions as a whole constitute a single Pareto front.
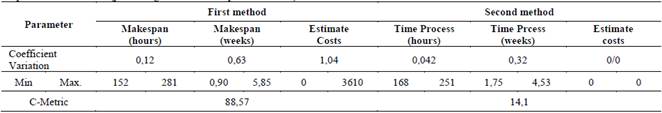
Comparison of proposed methods
When evaluating the information recorded in Tables 5 and 6, it is determined that the values examined (coefficient of variation and maximum value) are higher when comparing "method one" with "method two". Due to the fact described above, it is pointed out that the modified genetic algorithm shows better ability concerning the detection of the solutions dispersion that integrates the whole set of possible answers. Consequently, the C-Metric indicator corresponding to "method 1" amounts to 88.57 points, i.e. 88.57% of its "non-dominated" solutions (62 out of 71 solutions on the first Pareto front) retain this characteristic after comparison with the "dominant" solutions found using "method 2" (220 solutions on the optimal front). Thus, it is noted that, for the indicator in question, the "modified genetic algorithm" outperforms the "weighted summation" method by 528%.
Based on the above, the examined company decided to implement the "first method" in its production system's scheduling. Thus, for the solutions belonging to the first Pareto front, a specific grouping of data by process time (in weeks) is established in consensus with the company's management team. This grouping is shown in Table 7.
The company must determine the market demand trend for the time of the year under analysis by studying the data recorded in Table 7. This way, it will proceed to segregate that individual whose processing time corresponds to the shortest time within the respective interval. Subsequently, the company will define and apply decisions related to the other variables of interest: direct personnel costs, "non-conforming" ratio, sound intensity, and lighting level. Table 8 shows some of the general actions that the company could take depending on the individual chosen for each specific interval.
Table 5 Dispersion and C-Metric (processing time and direct personnel costs).
Source: prepared by the authors
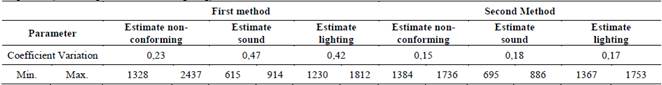
Table 7 Systematization of first front information (method one).
| Number Segment | Lower elevation (Time weeks) | Upper elevation (Time weeks) | Quantity solutions | Percentage (%) | Demand trends |
|---|---|---|---|---|---|
| 1 | 0,90 | 1,95 | 14 | 19,72 | In constant growth |
| 2 | 1,95 | 3,15 | 37 | 52,11 | Constant with periods of growth |
| 3 | 3,15 | 3,85 | 08 | 11,27 | Constant |
| 4 | 3,85 | 4,65 | 07 | 09,86 | Constant with decreasing periods |
| 5 | 4,65 | 5,85 | 05 | 07,04 | Decreasing with normalization periods. |
Source: prepared by the authors.
Table 8 Description of general actions to take.
| Number Segment | Performance overall process time | Overall description of performance of the other variables examined | General actions to be taken |
|---|---|---|---|
| 1 | Very small | Very high level of risks and direct personnel costs. | Coordinate the use of sound isolation methods at the source. Evaluate the possibility of using another solution that, in the same interval, makes better use of natural lighting. Adjust the number of lamps according to the specific lighting needs of the workstations. Review the operating conditions of the workstations to reduce exposure to high ambient temperature, handled weight and vibrations. |
| 2 | Small | High intensity level, in terms of the behavior of the variables recorded in segment 1. | Actions to implement would be equivalent to the actions recorded in interval 1. In this regard, it is clarified that the levels of investment required to implement the solution chosen in interval two would be lower than the levels of investment required to apply the individual chosen in interval one since, in this second interval, less exposure to the occupational hazards evaluated is generated. |
| 3 | Middle | Middle intensity level, around the performance of the variables examined. | The actions to be executed are similar to those recorded for intervals 1 and 2. Likewise, the levels of investment required for this case are lower than the levels required for applying the solutions chosen in the intervals mentioned above. |
| 4 | High | Low level of intensity of the variables evaluated. | In this interval, the exposure to occupational hazards would be significantly reduced since the processing time is high. However, given the decrease in demand, the company, in order to seek a balance in terms of sustainability, should project its products to new markets. |
| 5 | Very high | Very low level of intensity of the variables analyzed. | Exposure to occupational hazards would decrease dramatically in the present interval since the longer process time would be implemented. In turn, the company should develop new products to target either current or new markets. |
Source: prepared by the authors.
4. Results discussion
Independently of the fact that in the literature reviewed [9,10,13,28,41-43,45,46,52] and its theoretical support, research developments in manufacturing processes concerning the production of "non-standardized" goods using techniques based on metaheuristic methods have been widely extended since the late 1990s. It is noted that the variables associated with certain occupational hazards (high sound level, poor lighting and factors affecting the behavior of the proportion of "non-conforming" production -exposure to vibrations, weight handled and ambient temperature-) and, also, with certain economic indicators (processing time and direct personnel costs), have not been assessed simultaneously, nor have they been analyzed in the required depth: vibrations, weight handled and ambient temperature). Moreover, likewise, certain indicators of an economic nature (processing time and direct personnel costs) have not been simultaneously assessed, nor have they been analyzed with the required depth. Similarly, the problem area is of vital importance since it allows the application of sustainability in the operations of manufacturing organizations, based on two complementary theoretical references on the one hand, the management of occupational hazards and, on the other hand, the manufacturing missions (flexibility and costs). Consequently, it seeks to ensure the projection of the organization in a global market that requires entities to act socially responsibly.
When considering two critical evaluation indicators, it is found that the first method outperforms the weighted sum method (second method). Thus, the first of the indicators mentioned corresponds to the C-Metric indicator. In this case, it is found that the value of this parameter is higher by 528% when the respective comparison of the "redesigned genetic algorithm" is made about the "weighted sums" method. Consequently, it is stated that, between the two protocols examined, the first method is more skillful in detecting dominant solutions. In turn, the second indicator refers to the higher number of fronts established through the application of the first method, thus evidencing its greater ability to represent diverse solutions in a Pareto optimal structure.
Likewise, it is also detected that the minimum values in the several variables examined are lower when method one is compared with the weighted summation method, as follows:
By 10.5% as regards processing time (expressed in hours), by 94.44% as regards processing time (expressed in weeks), by 4.21% as relates to the proportion of "non-compliant" production, by 13% as regards the sound intensity variable and, finally, by 11.13% as regards the lighting level penalty variable.
It is also expressed that the company should evaluate market trends, selecting from the interval of interest the individual with the shortest manufacturing time. However, it is necessary to analyze whether implementing the previous individual generates occupational risk situations in the production system, whose impact could be potentially harmful to people's health. Based on the above, it is indicated that the organization must take appropriate measures, given the identification of the risk above situations. Thus, the above actions should focus on noise, the isolation of the source, and lighting, the installation of efficient systems, under which natural lighting is prioritized as far as possible.
5. Conclusions
Based on what has been defined in the previous sections, it is concluded that: 1) the structured method shows relevant performance characteristics such as a significant number of dominant solutions, a representative amount of Pareto fronts, and detection of minimum values in the different variables of interest. 2) The detailed exposition of the steps related to the designed methods facilitates their replication by the academic community interested in this topic. 3) Given that a certain value of process time is selected, to adapt the organization to the predominant market trends, it is necessary to evaluate the possible effects on workers due to the potential increase in exposure to certain occupational hazards. Thus, for those cases required, the corresponding preventive measures must be defined and implemented. 4) The decision to give greater importance to a certain value of process time is related to the behavior of the economic system; therefore, it is essential to complement this decision by incorporating relevant criteria of a social nature.
In addition, the need to integrate relevant concepts of uncertainty and some relevant trends of dynamic programming at the multi-objective level into the present study is also established. In this way, a robust model capable of holistically explaining the behavior of the operations subsystem, both in the context of the organization and the context of the market, would be structured under a sustainability perspective.

