


 Inglês (pdf)
 Artigo em XML
 Referências do artigo
 Enviar este artigo por email
 Citado por SciELO
  Citado por Google
  Similares em
SciELO
Similares em
SciELO  Similares em Google
 Permalink
1. Introduction
The company is a basic unit of the economy that plays a determining role in the generation of wealth and employment and is a driving force for the development of a country [1]. This sector makes an enormous contribution to job creation, technological innovation, and economic production [2-4]. This sector makes an enormous contribution to job creation, technological innovation, and economic production [5-7]. Colombia, according to [1] presents participation in the economy above 99% of the national conglomerate for 2016, micro-enterprises represented 92.1%, small companies 5.9%, medium-sized 1.5%, and large 0.5%, respectively. Therefore, reflects its importance in Colombia. However, the survival rate of companies at 5 years of birth is lower than that observed in countries of the Organization for Economic Cooperation and Development (OECD) such as France (52.7%), Italy (48.3 %), Spain (39.9%) and the United Kingdom (37.5%). In Colombia, this survival varies with the initial size of the company: the economic units that start their operations in the segment of large companies register a rate of 71.4%, the medium ones 68%, and the small ones 60%; however, in the case of micro-enterprises, their survival rate is 29.1%. This behavior remains indistinct in the sector where companies carry out their activity [1]. In addition to the situations presented above, in the case of Latin America, a lower level is reflected in the financial systems and the absence of a structure for generating and attracting financing, compared to both, more advanced countries and those with per capita income. Similarly, this low level has raised obvious costs for investment financing, especially among relatively small companies, and has directed the scarce long-term credit to large and medium-sized companies with higher capacity to provide guarantees [8]. These shortcomings in financial systems mean that small companies find it more difficult to obtain financing at an adequate cost and term due to their greater risk [9-10]. Moreover, according to research carried out by the Colombian Association of MSMEs - ACOPI [11], their financing comes mainly from their resources from the company's profits, followed by access to bank loans, suppliers, leasing, government resources, and factoring. In this regard, the National Association of Financial Institutions - ANIF [12], in its results report of the largest SMEs survey of the second half of 2017, presents the reasons why they do not seek credit, among which are the fact of keeping the level of indebtedness of their company under control, having excess liquidity, not having guarantees to back up the credit or not being able to pay for it, and finally not trusting the financial system. Besides, the authors [13-19], have analyzed the causes by which SMEs choose a preferred method of financing, the correlation of the macroeconomic context, the changes that take place as the life cycle of the company and their owners modify the hierarchy of funding sources or the internal circumstances that condition the decision. Other research has focused this issue on listed companies or large companies [20-27], or in identifying the differences in the capital structure between countries with different legal and institutional environments [28]. Likewise, there is a lack of studies in the field of financial risks, particularly around liquidity management, debt, and portfolio management [29]. On the other hand, there are studies in which the relationship between liquidity and capital structure decisions is analyzed [30-33], as well as its impact on the competitiveness of the company [34-36], in the reduction of the financing limit by creditors when the liquidity costs of the agency are high [37]. However, this research has not been carried out in SMEs, which is why the study was made to answer the question: What relationship exists between liquidity risk and the determination of the capital structure in SMEs from the city of Cartagena? To answer the previous question, the main objective was to analyze the liquidity risk in SMEs in the City of Cartagena from the determination of their Capital Structure. To achieve the above the following specific objectives were established: analyze liquidity risk in SMEs in the city of Cartagena, to know the different levels of liquidity risks to which SMEs in Cartagena are exposed to. Following, it sought to analyze the behavior of the capital structure in Cartagena city SMEs, which was to know the different combinations of capital structure and the possible risks that these can generate for the enterprises. Finally, it sought to analyze the relationship between liquidity risk and the determination of the capital structure in SMEs in Cartagena to identify the levels of liquidity risks and capital structure that are favorable to managing the decision-making of SMEs.

Source: Own elaboration based on the information of Decree No. 957 of June 5, 2019. Retrieved from
Figure 1 New classification of Colombian companies
1.1. A journey through SMEs
A wide range of definitions and measures, varying the term SME are broadly recognized and used throughout the world, covering its meaning from one country to another for different purposes [38-40]. Most countries define SMEs according to their size, total assets, total sales revenue, and the number of employees [41-42]. However, according to [38], the most common definition base used is employment, with a variation in the definition of the upper and lower size limit of an SME, which some sources locate in a cutoff range of 0-250 employees. However, “SMEs have an important position in the world economy. The accounting information provided by these companies must have the same role” [39]. For this reason, “there is more and more literature that indicates that small and medium-sized enterprises (SMEs) are relevant for macroeconomic growth. For much of the last decade, European SMEs have experienced impressive growth” [43]. In Colombia, the SMEs classification is regulated in Law 590 of 2000 known as the SMEsLaw and its amendments (Law 905 of 2004). This regulation was modified by Decree No. 957 of June 5, 2019, as detailed in Fig. 1.
1.2. Risk management
According to the PMBOK® Guide, project management is based on a set of interacting, interrelated and interdependent management activities and capabilities that work in unison to achieve desired project results, including risk management [44]. According to [45], "risk management represents an inseparable and important part of project management." "Risk management comprises the processes of conducting risk management risk planning, identification, analysis, response planning and risk control in a project." [46]. Since the objectives of project risk management are to increase the probability and impact of positive events and decrease the probability and impact of negative events on the project [44], it is clear that this is an important area of Project Management, and its underuse can result in chronic problems in project Information Systems [46]. Therefore, there are several standards and norms developed in various spheres of business activity that address this.
1.3. Liquidity risk
"Risk is always related to uncertainty about the future: this may be more favorable than initially expected or, on the contrary, more adverse than expected" [47]. Given the above, companies seek various ways to control their resources, tending to lessen the impact of future events. One of these resources for the company is undoubtedly liquidity, which "is simply the ability to obtain cash when necessary" [48]. The term liquidity is widely known as the availability of cash or cash equivalents, which allow the company to respond to short and long-term commitments. “Liquidity allows expected and unexpected obligations to be met when necessary, so that daily business affairs can continue without interruption” [49]. Therefore, the inability to attend to such financial matters or commitments as they expire is a Liquidity Risk [50]. According to the Self-regulator of the Colombian Stock Market - AMV [51], this risk translates into the difficulty of selling or liquidating an investment at a fair price. For its part, the Financial Services Authority - FSA [52], defines it as “a basic commercial risk that most (if not all) companies face, to some extent, although it is more important for some than for others”. However, to better understand liquidity risk, it is pertinent to distinguish between funding liquidity, asset liquidity, and joint liquidity. According to [49], funding liquidity refers to the availability of short-term and long-term unsecured liabilities that can contribute to creating cash.
1.4. Capital structure
For some time, the topic “Capital Structure” was considered a technical area of the company, which involved one or two company employees [53]. However, this issue has become one of the most important in corporate finance at a theoretical and practical level. According to [54], the study of this topic is one of the most complicated and prolific areas of research within finance, and since its inception [55], many studies have been done. In the beginning, [55], established their theory on the capital structure, addressing the incidence of the capital structure on the company value, in an initial thesis supported by a set of unrealistic assumptions. The term "Capital structure" refers to the combination of debt and equity utilized by a company to finance its operations [24,53,56-57].
Source: own elaboration
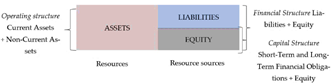
Figure 2 Capital structure in the Balance Sheet. The location of the capital structure within a company's Statement of Financial Position or Balance Sheet is shown.
“The decision of the capital structure includes the forms of financing, the number of funds, and the mixing ratio” [58]. [24], states that most of the research on the capital structure has focused on the proportions of debt vs. heritage; although there is no universal theory of the choice of such a mixture, and there is no reason to expect one. Fig. 2 shows the location of the capital structure inside the Statement of Financial Position or General Balance of a company.
1.5. Liquidity Risk and Capital Structure
Risk plays a relevant role in capital structure [59]. [2,60-61] states that the Trade-off theory suggests that companies at risk or have a high probability of default should not have a high level of leverage. “The risk and uncertainty of obligations arising from sources of capital increase as we move forward in time. For the same reason, equity financing is considered riskier than debt” [62]. Therefore, liquidity risk is negatively associated with debt because a company with high risk or high volatility in earnings is likely to fail and therefore tends to avoid using external financing [63]. Other authors [64-70], have shown that the relationship between risk and capital structure is negative, in fact, its liquidity risk increases with the decrease in the company's debt. However, [71] suggests a positive relationship between risk and the debts market value when the market has a higher growth. Considering this, companies with more risk have more long-term debt [72]. Consequently, companies that maintain a high level of liquidity prefer internal financing to external financing, thus requiring less debt [63,73]. On the other hand, [74] states there is a negative relationship between the current ratio and the debt ratios at each risk level, as a negative relationship between the cash ratio and the debt at lower risk levels. On the other hand, companies with higher liquidity ratios could use a relatively higher debt ratio due to their ability to meet short-term obligations at maturity [33]. [75] suggests that liquidity and debt have a negative relationship, which in turn is linked to the level of risk involved. This is how the most indebted companies have lower levels of cash [76]. In this way, the negative relationship between short-term indebtedness and the company's liquidity reflects that SMEs borrow more in the short term, to be able to meet their obligations, due to liquidity problems that they handle [77]. Furthermore, other researchers have demonstrated a negative correlation between liquidity ratios and debt ratios [65,78]. Finally, other studies [79-82], affirm that there is no such relationship between business risk and debt ratios.
1.6. Relationship between financial measurement and project formulation
The planning of financial resources is related to the formulation of projects, the inflows and outflows of money from the organization and from the projects that are executed in it, have a direct impact on the liquidity indices, increasing the associated risk if it is not considered rigorous planning [83]. By the way, the business model is considering one of the four factors that can explain the sustainability of the project, this factor is related to variables such as Financial performance (return on investments, solvency, profitability, and liquidity) and Cost management (resources) [84]. It is clearly established that the general objective of a project is to obtain an expected return according to the requirements of the stakeholders [85].
2. Methodology
2.1. Data Description
This research is quantitative since "quantitative data on variables are collected and analyzed" [86]. The figures contained in the financial statements as of December 31, 2016, the period with the largest number of SMEs, in which they had to report their financial statements for the first time under International Financial Reporting Standards - IFRS, were reviewed. The analysis presented a vertical-type characteristic, with a sample of 260 companies, through non- probabilistic sampling for convenience [87-88], since not all the companies reported their financial statements uploaded information from both the Statement of Financial Position and the Statement of Income, and the Statement of Cash Flow. Assumed sample was distributed as presented in Table 1. According to the International Uniform Industrial Classification - ISIC, revision 4 adapted for Colombia (A.C.).
Table 1 Sample Distribution according to ISIC classification
| *No. | % | CIIU | Description of the sector |
|---|---|---|---|
| 5 | 1,9% | A | Agriculture, livestock, hunting, forestry. |
| 2 | 0,8% | B | Mining and quarrying. |
| 28 | 10,8% | C | Manufacturer industries. |
| 2 | 0,8% | E | Water distribution; evacuation and residual water treatment, waste management and environmental sanitation activities. |
| 51 | 19,6% | F | Construction. |
| 67 | 25,8% | G | Wholesale and Retail; repair of motor vehicles and motorcycles. |
| 16 | 6,2% | H | Transportation and storage. |
| 24 | 9,2% | I | Lodging and food services. |
| 1 | 0,4% | J | Information and communication. |
| 7 | 2,7% | K | Financial and insurance activities. |
| 23 | 8,8% | L | Real state ac. |
| 13 | 5,0% | M | Scientific, professional, and technical activities. |
| 17 | 6,5% | N | Administrative and support service activities. |
| 2 | 0,8% | P | Education. |
| 1 | 0,4% | R | Artistic, entertainment and recreation activities. |
| 1 | 0,4% | S | Other activities. |
* No. Of business
Source: own elaboration based on information Supersociedades (2016) and DANE (2019). https://sen.dane.gov.co:8143/ProyWebCiiu/html/jerarquica.html
2.2. Hypothesis
To achieve the objective authors worked with a correlational approach [86-89], and sought to corroborate the following hypothesis: H1: There is a positive relationship between capital structure and liquidity risk. Capital structure was taken as an independent variable and liquidity risk as a dependent variable to prove that the higher the indebtedness, the higher the level of liquidity risk and vice versa:
2.2.1. Positive relation
[63] state that there is a positive relationship between liquidity and debt/capital structure ratios, since according to the TOT, companies must guarantee sufficient liquidity through the receipt of debt to meet their commitments, and, taking this theory into account, there must be a relationship.
2.2.2. Negative relation
Some authors [37,63,65,73-74,78], sustain that according to the POT, AT, and FCFT theories, there must be a negative relationship between liquidity and capital structure, since companies with sufficient liquidity require less external financing and loans.
2.2.3. Hypothesis / Theory
H: There is a negative relationship between liquidity ratios and debt ratios.
Theory of compensation - Trade-Off Theory (TOT).
Hierarchical Order Theory of the capital structure - Pecking Order Theory (POT).
Agency Theory - Agency Theory (AT)
Free Cash Flow Theory (FCFT)
For the development of the research, it was divided into three stages:
2.3. Analysis of the liquidity risk in the SMEs of Cartagena
With the information downloaded and grouped, the financial indicators of liquidity and turnover were calculated, such as acid test - pa, working capital ratio - rkt, cash ratio - reflect, and portfolio turnover - rcxc. With this, we required to know the different levels of liquidity risks to which the SMEs of Cartagena are exposed.
2.4. The behavior of the capital structure in SMEs in Cartagena
Indicators of indebtedness, solvency or leverage were calculated, such as Total indebtedness - endt, financial indebtedness - endf, Total leverage - apt and financial leverage - apfin, to know the different combinations of capital structure and the possible risks that these may generate in the SMEs of Cartagena.
2.5. Analysis of the relationship between liquidity risk and the determination of the capital structure
Finally, we proceeded to analyze the relationship between liquidity risk and the determination of the capital structure in the SMEs of the city of Cartagena, through a bivariate correlation analysis applying the correlation coefficient of [90], since the variables to be analyzed do not have a normal distribution and, both are quantitative [91], with a Bilateral significance test.
2.6. Analysis of principal components
In order to group the indicators into factors, a principal component analysis was performed in R software with the FactomineR package.
2.7. Data analysis strategies
The software R Version 4.2.3 used descriptive statistical analysis, as well as the indicators analysis grouped by their frequency in percentiles, managing to locate in three ranges (high, medium, and low) the levels of liquidity risk in which the companies under study can be found. Finally, to evaluate the third objective bivariate correlation analysis was performed.
3. Results
3.1. Analysis of the Liquidity Irrigation in the SMEs of Cartagena
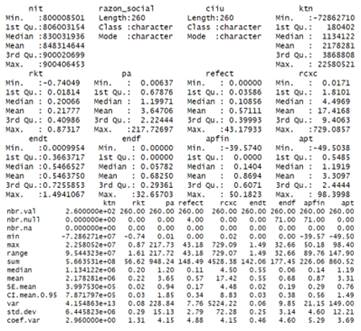
From Fig. 3, results suggest that the cash-effect ratio indicator presents a higher dispersion of the data (488% compared to the average), thus reflecting the relationship between the level of cash and current liabilities that the target companies have a subject of analysis, which can take values between 0 and 43.1793 of cash for each peso owed in the short term. On the other hand, the portfolio rotation - rcxc and acid test - pa, presented a standard deviation equivalent to 72.27 times in the year of portfolio recovery and 15,1275 pesos for each liability that is owed in the short term, respectively. In both indicators, the coefficient of variation registered was 415%. It is worth mentioning that such indicators ranged between 0.01707 and 729.086 and 0.00637 and 217.727. The previous reflects companies’ behavior in their ability to meet their short-term commitments and the heterogeneity of the data. Regarding the indicator of working capital ratio - rkt presents a lower standard deviation equivalent to 0.28540 (variation coefficient 131% concerning the mean) cents of net working capital for each peso invested in total assets, presenting levels between -0.74049 and 0.87317. The aforementioned metric illustrates the ability of certain analyzed companies to generate net working capital per peso invested in total assets, while simultaneously generating additional requirements or needs. In sum, according to the analyzes carried out for each selected indicator, it can be concluded that less than half of the companies are located at medium levels of liquidity risk, represented in net working capital, resources that are easily settled or converted to cash, and efficiencies in portfolio management that can cover short-term commitments. Similarly, it is crucial to highlight the importance of monitoring the actual resources available to the company, particularly those exhibiting higher volatility or deviation from the mean, along with its working capital.
3.2. Behavior of the capital structure in SMEs in Cartagena
In this order of ideas, from the results of Fig. 3, it can be concluded that the financial leverage indicator - apfin presents a higher dispersion of the data (529% compared to the average), thus reflecting the ratio of financial liabilities to equity, which can take values between -39.5739 and 50.1823 pesos owed to financial entities for each peso represented in equity. To point out that negative values indicate that the company's equity is negative given the recurring losses, which is why the levels of financial leverage increase for the company. Subsequent, there is financial indebtedness - endf (460% concerning the average), which can take values between 0 and 32.6570 pesos owed with financial entities for each peso sold, thus reflecting the impact or participation of the obligations financial results of the company's sales. Regarding the total leverage indicator - apt, evidence suggests that it presents a standard deviation equivalent to 369% for the average, whose companies under analysis can take values between -49.5038 and 98.3998 pesos owed to third parties for each peso represented in equity, thus reflecting the ability of some companies under study to leverage their operations with resources from third parties other than owners or shareholders.
However, for some companies, the analysis of the results was negative, this indicates that the levels of leverage will increase since their equity is negative and therefore presents higher needs in terms of financing with third parties. Finally, the indicator in total indebtedness - endt presents a deviation equivalent to 46% to the average, taking values between 0.00099 and 1.49411 pesos owed for each peso (COP) invested in total assets, which reflects the impact on some companies with high levels of indebtedness with their resources. From the analysis carried out previously, it can be concluded that less than 50% of the companies are located at medium levels of capital structure, reflecting the weight that creditors represent within the participation of the company's financing, as well as the impact on sales levels. In this sense, these can represent between 40.67% and 69.5% of the company's assets, impact between 0.0459% and 23.55% on sales levels, and constitute the financial liabilities of the company. The company is between 0.0361% and 51.89% of the equity and represents the total liabilities more than double the equity, between 64.90% and 210.10%.
3.3. Relationship between the liquidity risk and the determination of the capital structure
According to [91], this coefficient is a measure of linear association that uses the ranges, and order numbers, of each group of subjects and compares these ranges. This correlation coefficient is known as Spearman's rho (rs), and it can be calculated with the following formula:
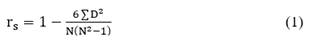
Where rs is the Spearman rank correlation coefficient, D is the difference between the corresponding statistics of an order of (x - y). N is the number of data pairs. The interpretation of Spearman's rho coefficient agrees on values close to 1, indicating a strong and positive correlation. Values close to -1 indicate a strong and negative correlation. Values close to zero indicate that there is no linear correlation. There may be another type of correlation, but it is not linear.
Positive or negative signs only indicate the direction of the relationship; a negative sign indicates that one variable increases as the other decreases or vice versa, and a positive sign indicates that one variable increases as the other also decreases if the other does likewise [91]. The correlation technique is to assess the presence and strength of a potential association between the variables of interest.
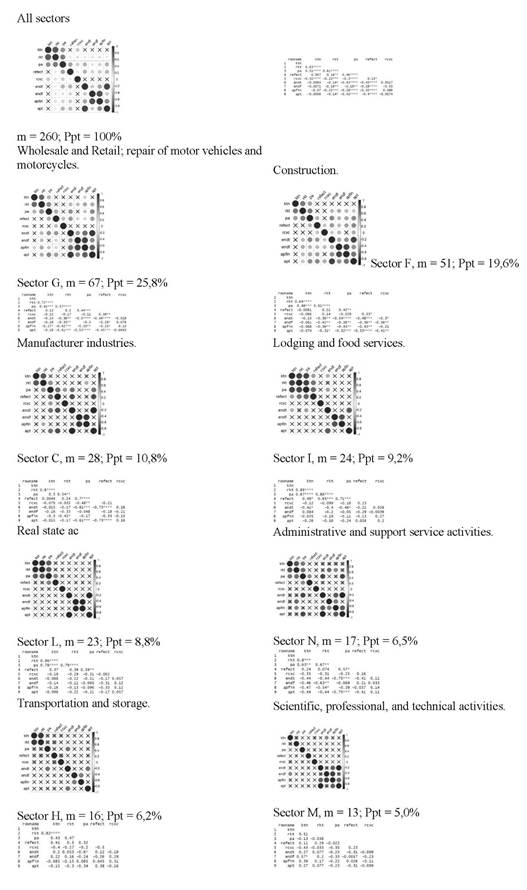
It can indicate whether the correlation between the variables is positive or negative. The analysis helps to determine the degree of correlation or association between the variables [92]. Before analyzing the results in Fig. 4, it is important to note that these are presented at the 0.01 ** and 0.05 * levels of bilateral significance. In this order of ideas, according to the working capital ratio indicator - rkt, it presents significant negative correlations at the 0.01 with the financial indicators of indebtedness - endf (-, 186) and financial leverage - apfin (-, 223), and significant negative correlations at the 0.05 level with the indicator’s total debt - endt (-, 136) and total leverage - apt (-, 141). Following the previous, the null hypothesis is rejected, and the researchers' hypothesis is accepted since there is a negative correlation between the variables analyzed: endf and apfin, at 99% confidence; and endt and apt, at 95% confidence, as explained, which leads to corroborate the existence of a positive relationship between capital structure and liquidity risk. Regarding the acid test indicator - pa, a significant negative correlation is established at the 0.01 level with all the debt indicators analyzed: endt (-, 433), endf (-, 193), apfin (-, 285), and apt (-, 416). Considering this, the null hypothesis is rejected, and the researchers' hypothesis is accepted since there is a negative correlation between the variables analyzed at 99% confidence, which denotes a positive relationship between the capital structure and liquidity risk. About the cash ratio - reflect indicator, a significant negative correlation is detected at the 0.01 level with all the debt indicators analyzed: endt (-, 429), endf (-, 276), apfin (-, 322) and apt (-, 400). In consequence, the null hypothesis is rejected, and the researchers' hypothesis is accepted, since there is a negative correlation between the variables analyzed at 99% confidence, which confirms a positive relationship between the capital structure and liquidity risk. Finally, when analyzing the portfolio turnover indicator - rcxc, no significant correlation is established at the levels of 0.01 ** and 0.05 *, with the analyzed debt indicators: endt (.002), endf (-, 050), apfin (. 086) and apt (-, 007). As per the information provided, the null hypothesis is accepted, and the researchers' hypothesis is rejected, since the results of the correlation are not significant.
3.4. Design of a composite financial leverage index
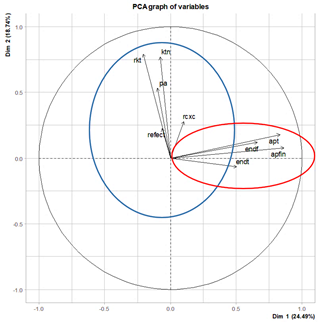
With the objective of knowing the level of composite leverage of the companies, an index was designed by applying principal component analysis (PCA) in R. Fig. 5 presents the result of the PCA processing, where dimension 1 (blue circle) gathers 24.49% of the variability and dimension 2 (red circle) 18.74%, this identification of factors will allow the design of the leverage indicator.
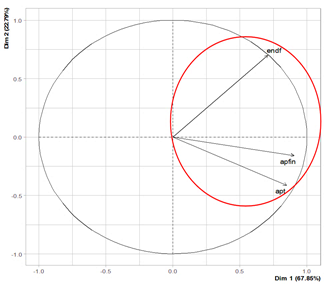
As mentioned above, the variables grouped in the red circle will be used for the design of the leverage indicator, where this new factor gathers 67.86% of the variability from these variables (Fig. 6). The variable endt is suppressed because it has a low correlation with these three variables. Fig. 6 presents the results of the information processing, where it can be observed that the variable apfin is the one with the highest contribution to the component with 40%, besides being the one with the highest correlation represented in the cosine of the angle of 0.817.
Source: own creation using R software
Figure 4 Principal component analysis of liquidity and debt indicators.
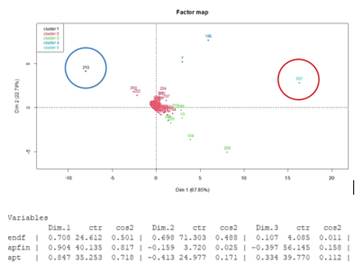
According to the information presented, the Composite leverage Index (CLI) = (Endf*0.25+apfin*0.40+apt*0.35). According to this new performance metric, the analysis in Fig. 7 presents data 257 as the most leveraged and data 215 as the least leveraged. This allows to compare the companies with this new risk metric, allowing to generate strategies around risk management.
4. Discussion and conclusions
Small and medium-sized enterprises (SMEs) play a crucial role in the global economy as they constitute over 95% of businesses worldwide [1-2,4]. Accordingly, in the case of Colombia, the results obtained confirm the importance of SMEs in the country's economy, which together with microenterprises make up 99% of the national conglomerate. However, the growth of these companies has decreased due to different factors as difficulties in obtaining financing at adequate costs and terms, lack of guarantees to support credit, or lack of confidence in the financial system, among others [9-11]. For these reasons, some research has focused on analyzing the causes by which SMEs make certain types of decisions regarding how to finance their activities [13-14], [15-19], as well as analyzing the relationship that may exist between this form of financing and the liquidity risk generated in operations [30-33]. However, there is still little research concerning issues in SMEs. In line with the theories addressed in the research, the results reflect that 40% of the companies analyzed present average levels of liquidity risk, represented in net working capital, and easily liquidated resources, or conversion to cash and efficiencies in portfolio management, which allow short-term commitments to be met. Of these indicators, the cash-effect ratio presented higher dispersion of the data (488% with respect to the mean), which reflects the heterogeneity of the cash levels with respect to the current liabilities managed by the companies (between 0 and 43.1793 of cash for each peso owed in the short term). On the other hand, the portfolio rotation - rcxc and acid test - pa, presented variation coefficients equivalent to 415%, taking values between 0.01707 and 729.086 (times in the year of portfolio recovery) and 0.00637 and 217.727 (pesos for each liability that is owed in the short term). Finally, the working capital - rkt ratio presented a variation coefficient of 131%, taking values between -0.74049 and 0.87317 (cents of net working capital for each peso invested in total assets). This type of liquidity risk behavior in SMEs reduces uncertainty about the availability of resources to cover the needs of the operation and try to formulate projects to strengthen the companies with the resources that may be available as surplus. In the same way, less than 50% of the companies are in medium levels of capital structure, reflecting the weight that creditors represent within the participation of the financing of the company, as well as the impact on sales level. Of these indicators, the financial leverage - apfin presented an increasing dispersion of the data (529% for the average), which reflects the heterogeneity of the levels of financial liabilities to the equity of the companies (between -39.5739 and 50, 1823 pesos owed to financial entities for each peso represented in equity). On the other hand, financial indebtedness - endf presented a variation coefficient equivalent to 460%, taking values between 0 and 32.6570 pesos owed with financial entities for each peso sold, thus reflecting the impact or participation of the financial obligations of the company's sales. This wide dispersion of those identified in the data set makes it necessary to analyze the particular cases of each company in order to establish whether the appropriate conditions are in place to formulate new projects without this having negative implications related to leverage risk. Also, the total leverage indicator - apt, presents a coefficient of variation equivalent to 369%, taking values between -49.5038 and 98.3998 pesos owed to third parties for each peso represented in equity, thus reflecting the capacity of some companies under study to leverage its operations with resources from third parties other than owners or shareholders. The total indebtedness - endt indicator, presented a lower coefficient of variation equivalent to 46%, taking values between 0.00099 and 1.49411 pesos owed for each peso invested in total assets, which reflects the impact on some companies of the high levels of indebtedness concerning own resources or assets. Within the scope of this search, certain authors posit a positive correlation between liquidity and debt/capital structure ratios [63], while others contend that a negative correlation should exist between liquidity and capital structure [37, 63, 65, 73-74, 78]. Based on the above ideas, the existing correlation between the liquidity and indebtedness variables is negative, except for the accounts receivable turnover indicator -rcxc, which does not present a significant correlation with those variables of indebtedness. To conclude, with higher levels of indebtedness, the company's liquidity risk tends to increase, with which the hypothesis established in the research is accepted. The calculated CLI complements the liquidity risk analysis for SMEs, generating a performance metric. In this sense, the levels of indebtedness can represent a determining aspect to consider when companies decide to formulate new projects, given that they can generate a vulnerable condition by not having a rate of generation of resources from their operation in a sufficient magnitude as so as not to depend on the resources that come from external actors.

