


 Inglés (pdf)
 Articulo en XML
 Referencias del artículo
 Enviar articulo por email
 Citado por SciELO
  Citado por Google
  Similares en
SciELO
Similares en
SciELO  Similares en Google
 Permalink
1. Introduction
As we move further into the Fourth Industrial Revolution and prepare for the widespread deployment of 5G, the development of low-cost sensors is becoming increasingly important. In this drive for innovation, RFID chipless technology has emerged as a promising alternative to traditional, expensive silicon chips. It has been shown to offer cost-effectiveness and robustness, making it attractive for various applications. According to Liu [1], RFID chipless technology can improve food supply chain management through the tracking of food products. Li [2] has demonstrated its potential for real-time patient monitoring. Singh [3] also highlights its potential integration into smart city transportation systems for improved traffic flow.
In this study, we aim to demonstrate the capabilities of off-the-shelf technology [4] in detecting and characterizing RFID chipless geometries using a Radio Programmed by Software-SDR. Through comparison with electromagnetic simulations, we will examine the behavior of the S21 curve in both line and slit configurations in an open field setting. The potential for RFID chipless technology is enormous, offering new ways for innovation and the ability to transform the way process management such as food supply chains, patient health and smart city transportation [1].
The use of programmable radio technology has gained importance in recent years due to its versatility and flexibility. Software-Defined Rradio (SDR) technology enables users to modify and customize the radio's operating parameters, making it an ideal solution for various applications, including telecommunications, military communications, and industrial and commercial applications. One of the advantages of programmable radio technology is the its ability to support multiple frequency bands and communication standards, making it a versatile and flexible solution.
Another advantage of programmable radios is their ability to be reconfigured remotely, making them suitable for use in remote or difficult-to-access locations. They can also be updated with new software or firmware to add new features or correct any issues. In this study, programmable radio technology was used to measure the S21 information of RFID chipless geometries in an open field setting.
Overall, this study provides valuable insights into the accuracy and effectiveness of simulation software in predicting the behavior of antenna systems in real-world scenarios. The use of programmable radio technology, particularly SDR technology, has significant potential in various applications and can be a versatile and flexible solution for different communication standards and frequency bands. As technology continues to advance, it is likely that the use of programmable radio technology will become increasingly prevalent in various industries.[2]
Methodology
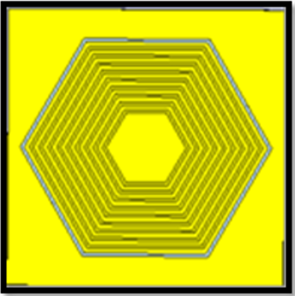
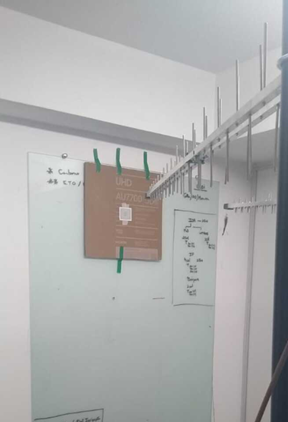
The study presented here focused on the comparison of the accuracy and effectiveness of simulation software to the behavior of antenna systems in real-world scenarios. The resonance points in frequencies from L1 to L5 (the tag configured as “line” - please refer to figure 1) were simulated using electromagnetic software, and the results were compared to actual readings taken in an open field environment using a quadripolar antenna setup (Figure 2). The coherence of the simulations and measurements was assessed, and the comparison provided valuable insight into the accuracy of the simulation software.
There were made at least 74 measurements of each tag for each given frequency in step of 0,01 GHz in the range of 0 to 3GHz and an average value was obtained from the measurements (from each given frequency step). The SDR used in this test was Great Scott Gadget HackRF One. The antennas used in this test were Aquario Quadri band for cell phone CF-4000. We have not made any statistical assessment of our data since the data collected was a result of a 74 measurements average for each frequency step. We have confirmed empirically the repeatability of the values in different tests. All tests were performed in an indoor open environment. After the test completion, the data was extracted and plotted in MATLAB version 2020.
Measurements were taken considering the "line" label configuration and investigated which resonant region the curve rises above the baseline configuration (with fully substrate without any metallic ink printing). Similarly, in the "slit" configuration, a region will emerge where the encoded curve will be below the baseline (in this case, the fully substrate printed with metallic ink). These aspects constitute the main differences the two configurations while the geometry is basically the same.
The antennas used in these tests are regular quadripolar antennas CF-4000, commonly used for cellular signal amplification, with gains of 12 dBs in the bandwidth of 800 MHz to 3 GHz.
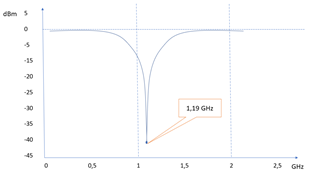
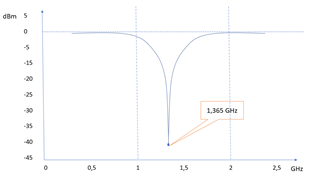
In the simulation (Figure 3), we will note at about 1.19 GHz, there will be a resonance point. The simulation was done in a electromagnetic simulator software for each label and using a bi-static antenna configuration and the result is related to a S21. The resonance area is coherent to the frequency of resonance as defined by the equation [4], where c is the speed of light and 𝜀r is the relative permittivity of the substrate and L0 is a physical length of the geometric resonator.
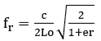 [4]
[4]
3. Results and Discussion
An SDR (Software Defined Radio) can help detect RFID chipless tags by demodulating the radio frequency signals that are emitted by the tags. By using software to process the signals, the SDR can extract information about the tags, such as their unique identification numbers. This information can then be used to determine the location and identity of the tagged objects.
To detect chipless RFID tags specifically, the SDR must be configured to receive signals at the right frequency and modulation scheme used by the tags.
Looking at Figure 3, we can see that in from 1 GHz to the 1.4 GHz the red line was positioned below the baseline (blue line). We can observe at about the surroundings of the resonance point indicated in the simulation; the red line is positioned slightly below the baseline.
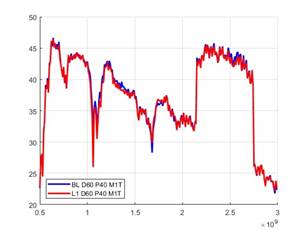
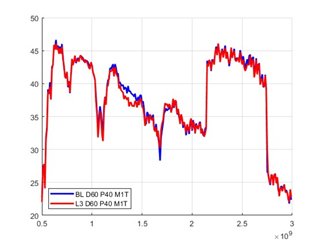
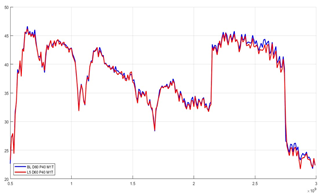
Firstly, we will explain the label in the measured data. Looking at Figure 4, BLD60P40M1T means baseline measured at 60 cm, with radio calibrated with power 40dBM. Likewise, the acronym L1D60P40M1T means line1 measured at 60 cm, with radio calibrated with power 40dBM. Since there were many measured to determine the pattern T reflected the number of measurements that was selected.
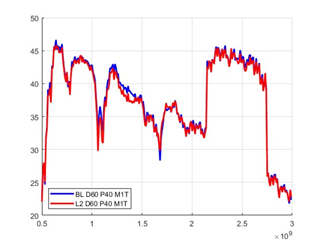
We can observe the behavior is still the same with a slight difference. The larger difference between the L2 and baseline is 1.3GHz. There is still a difference between 1.1 GHz and 1.6 GHz, but it is evident the resonance area is moving gradually to a higher frequency. This is consistent to the simulation as shown in Figure 5 and Figure 6.
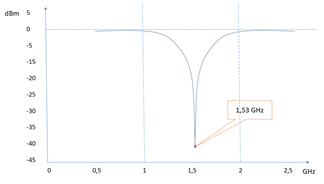
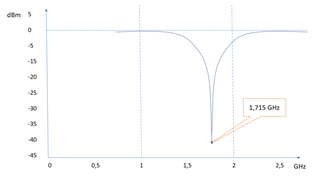
Again, the major difference between coded and baseline is located in 1.4 GHz (Figure 7). We can see there is a slight difference to the simulation that defines 1.5 GHz as the point of resonance, but this is still quite close and consistent to the simulation (Figure 8).
For L4 and L5 (Figure 10 and 12), we can observe that the resonance area is not evident, even compared to the simulations (Figure 9 and 11).
Next, we will compare the performance of the tag in slit configuration. In that setup, tag label will be printed fully with the metallic ink and the hexagon slit will be printed from SL1 to SL5. The larger slit represents the larger slit hexagon.
The baseline in this case, will be the background fully printed with metallic ink.
Note that at the S21 resonance surroundings, the S21 tag curve stays positioned above the baseline, which is totally consistent with the simulation. This pattern (that is reverse to the “line” configuration, where the tag line stayed below the baseline), remains consistent from SL1 to SL5.
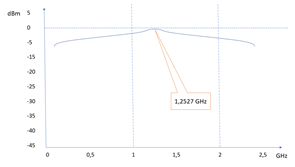
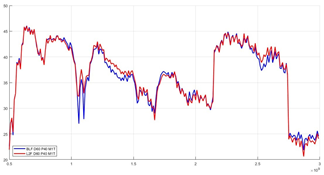
We can clearly see that between 1 GHz and 1.5 GHz the coded line (red) is positioned above the baseline (blue). This is consistent with the simulation (Figures 13) that showed S21 peak is in about 1.2527 GHz.
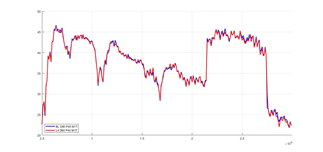
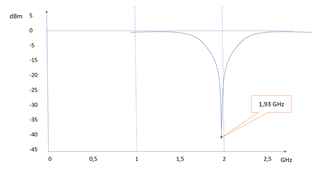
At Figures 14, 16, 18, 20 and 22, we see that the resonance peak moves to the right as a pattern and this is consistent to the resonance peaks as shown in the simulations (Figures 13, 15, 17, 19 and 21).
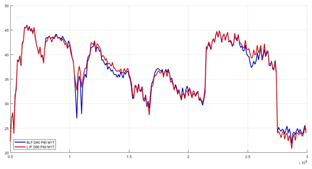
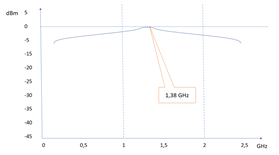
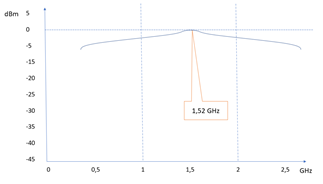
At Figure 18 the same pattern is repeated while the resonance peak is moving rightwards, always compatible with the simulation that displayed the peak at 1.52 GHz.
And finally, on all measurements, the pattern is repeated. The peak is positioned in about 1.7 GHz what is compared to the simulation. Note that at the 1GHz, the difference between baseline and coded line is irrelevant. We see some small differences at 2.5 GHz, but this is attributed to the reflection in the open measurement. It was verified consistency of the measurement in all cases. To this article, we have selected the first measurement of each tag. The legend of the graphics of the tests indicates the parameters described above.
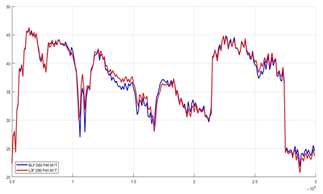
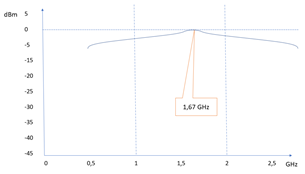
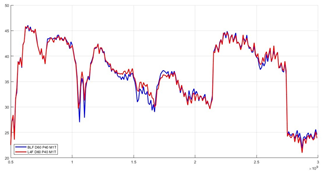
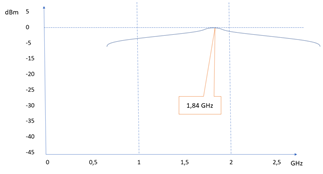
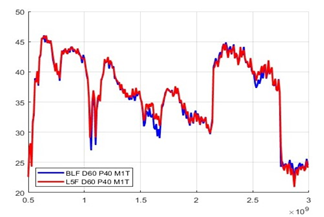
Table 1 Slit and Line configurations results
| Tag characteristics | Line configuration | Slit Configuration |
|---|---|---|
| Tag baseline | Blank substrate with printed geometry in metallic ink | Fully printed substrate with metallic ink with slit geometry without metallic ink |
| S21 tag behavior compared to S21 baseline | Run below baseline | Run above baseline |
| Tag detection performance | For higher frequencies, the detection was not so evident | During the whole frequency band |
Own Source, 2022.
In the table 1, we have described the performance for each configuration (slit and line) as an overview of the observations:
4. Conclusions
Radio-Frequency Identification (RFID) technology is rapidly gaining momentum in various industries, particularly in the 4.0 Industry as the world prepares for the large-scale introduction of 5G technology. One of the most promising advancements in this field is chipless RFID technology, which differs from traditional RFID in that it does not require a silicon chip to function. Instead, chipless RFID relies on printed labels, making it more cost-effective, robust, and versatile in its applications.
In this study, we aim to demonstrate how off-the-shelf technology can be used to detect and characterize a designed RFID chipless label and compare it to an electromagnetic simulation. Through open field tests, we aim to detail the behavior of the S21 curve in both slit and line configurations.
The results of our study show that in all cases of the "line" configuration, the tag curve is positioned below the baseline in the surrounds of the resonance point, as provided by simulation. This situation is reversed in the "slit" configuration, with the coded signal floating above the baseline around the resonance area.
Additionally, for the "line" configuration, the resonance areas were more detectable for lower frequencies, whereas for higher frequencies, the resonances were less detectable (L1 to L3). In contrast, it was possible to detect the resonance areas for "slit" configuration in all tags (from SL1 to SL5).
It is appropriate to say that the S21 approach, although is an indication of the label characterization, it consumes frequency band and other methods should be considered for tag codification. Traditionally with RCS technology [2] radar signals reflected by objects are analyzed to obtain valuable information about their size, shape, and material composition. This characterization is important for various applications such as military surveillance, object detection, and radar system design.
Our findings suggest that slit configuration is more appropriate for detecting the resonance due to the larger metallic ink area, resulting in a more evident signal-to-noise ratio. Although our study has demonstrated the perception of a metallic inked print to a electromagnetic signature, much more has to be developed in order to make a codification of the information embedded in the tags such as filtering the resonance peaks in a thinner band (in order to codify more bits) and improve the overall reading environment.
Chipless RFID technology, which does not require a microchip to operate, has great potential in the industry due to its low cost, ease of deployment, and ability to track and monitor assets without physical contact. This can result in a revolutionary technology that can be suitable for a wide range of applications, including supply chain management, inventory control, and asset tracking.

