


 Inglés (pdf)
 Articulo en XML
 Referencias del artículo
 Enviar articulo por email
 Citado por SciELO
  Citado por Google
  Similares en
SciELO
Similares en
SciELO  Similares en Google
 Permalink
1. Introduction
Aggregates must meet a series of aptitudes in terms of size distribution, shape and lithology to be considered suitable for use as road construction material. Moreover, this material constitutes a large proportion of the volume of concrete and asphalt mixes, making its control more relevant, due to the great impact it will have on the performance of the work in service.
The lithology of the aggregate is a parameter with great incidence in the performance of the roads, whose characteristics cannot be modified with the production process. Quarries will adapt their processes to work with certain aggregate mineralogy and must take into account the variations of the mining front to avoid processing problems. This independence, as they are intrinsic parameters of the rock, means that quarries have practically no control over this quality parameter, once it has been established.
The shape of the aggregates is another factor which affects the performance of asphalt and concrete mixes. The processing methodologies, the equipment used and their variables tend to modify the morphology of the aggregate produced. This dependence on the processing system constitutes an interesting factor from a technological point of view, since the actions taken by those responsible for the operation in a quarry will have an immediate impact on the quality of the aggregates produced. This situation leads to the existence of a variety of studies on the processing system, in which modifications in process variables are analyzed, in order to correlate them with morphological characteristics such as angularity or flakiness and elongation index. Although there are studies on this subject, the large number of variables involved in the processing of aggregates makes it difficult to establish rules that can be adapted to any quarry. The studies are carried out in quarries with their own characteristics, both of the equipment used and of the material processed, making their results limited to those conditions, only replicable by quarries with similar characteristics. Regarding quarries that differ in the processing system or the lithology of the processed aggregate, it will be necessary to evaluate said result "rules" based on quality controls and historical data of the process.
Regarding granulometry, there are few studies on how to control and mitigate the variability in the size distribution resulting from the operation, despite having a proven impact on road performance, this situation results in quarries whose production is often not consistent to the granulometric requirements of customers.
In the production of concrete, the size distribution of the aggregate affects several factors such as the demand for water and cement, workability, pumpability, porosity, shrinkage and its durability [1]. However, in the case of hot mix asphalt (HMA), it is a property that affects its performance, acting on air voids, stability and resistance to permanent deformation and fatigue [2].
Despite this need to produce aggregates with an adequate granulometry, the controls that are exercised are usually not completely exhaustive. The aggregate produced by quarries generally has great variability in the particle size distribution, mainly due to the number of variables that affect the production process and the segregation of the material during transportation and storage. It should be noted that variability can manifest itself both intraday and over long periods. This situation affects customers who require the product to have a maximum level of variation in its granulometry, which means the cumulative percent passing in the different sieves which make up the granulometry must be within an interval which allows it to comply with the specifications required in the standards for both asphalt mixes and concrete.
In Argentina, the Dirección Nacional de Vialidad (National Highway Administration) establishes, in the technical specifications for asphalt mixes, that the grain size distribution resulting from the mixture of different fractions of aggregates must be included within the limits established in the granulometric spindle of said document. These limits will, in turn, have certain tolerances for each size fraction [3]. Furthermore, the technical specifications for concrete pavements establish that the granulometry resulting from the combination of different fractions of aggregates must be within the limits established in the granulometric spindle defined in the IRAM 1627 standard [4,5].
Being able to achieve a Job Mix Formula (JMF) in accordance with the project specifications will require a mixture of fine and coarse aggregates provided by the quarry, whose individual granulometries allow the formation of a resulting size distribution of the aggregate which adjusts to said limits. Achieving this on site involves modifying the percentages of fine and coarse aggregate which will make up the mix, thus adapting the granulometries of each fraction to the specifications of the asphalt or concrete mix to be produced. This possibility of mixing aggregates of different sizes gives some flexibility to those the contractor for preparing the (JMF), so that it meets the required specifications. Despite this, many times the aggregate provided by the quarries is such that it is practically impossible to obtain a mixture of aggregates which is capable of satisfying the granulometric spindle required for the granular skeleton of the mixture. This situation is mainly affected by the lack of specifications regarding the granulometry which the stone aggregate produced by a quarry must comply with. Quarries normally have tools to modify the size particle distribution of the aggregates produced. Such granulometry may be adjusted depending on the configuration of the crushing, sieve and washing equipment. The variability, however, will depend on an extensive list of factors, although to simplify it could be associated with variations in the lithology of the processed aggregate, process variables, damage or lack of maintenance, wear of equipment and parts, due to climatic reasons and segregation problems in the internal movement of the material, in stockpiles, in transportation and dispatch, among other factors. Those quarries which have methodologies and equipment for quality control may carry out daily controls of the granulometry obtained to measure its variability and, if required, attempt corrective adjustments to return to their normal production parameters. In the best of cases, a quarry that has a well-established quality control methodology will be able to verify that the particle size distribution of its products is under statistical control by means of control charts.
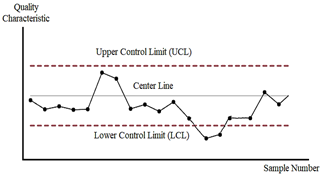
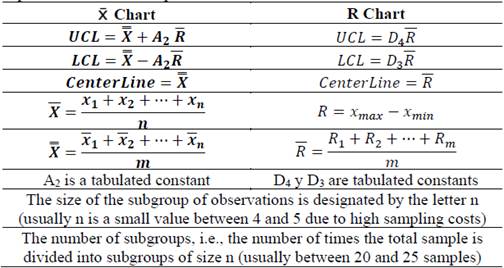
In quality control, control charts are a fundamental tool to determine if a process is in statistical control. A control chart like the one represented in Fig. 1 is made up of a central horizontal line which represents the mean value of the quality variable under study and two horizontal lines that represent the upper control limit (UCL) and the lower control limit (LCL). Joining the sequence of points in the graph facilitates to visualize the evolution of the value the variable takes over time. If one or more points are outside the limits, the process is not in statistical control. In addition, the lack of randomness, trends and periodicities will be indicative of a process out of control. These graphs have different variants, having to select the appropriate type of graph for the variable to be analyzed (qualitative or quantitative) and taking into account the characteristics of the process under study [6]. When a control of the quality variable of the quantitative type is wanted, the usual step is to control the mean value and the variability of said characteristic of the process under study. The control of the mean of the process is usually carried out in graphs of the type x̅, while the control of its variability is carried out in the R diagram. In order to be able to elaborate both the graph of means (x̅) and the range (R), it is necessary to carry out a series of calculations which are summarized in Table 1, in order to determine the upper and lower limits.
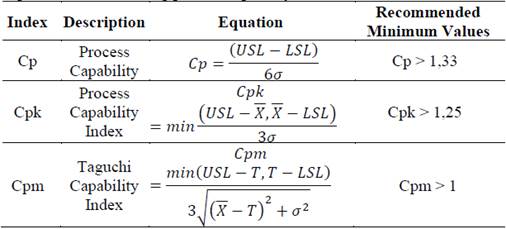
Having implemented control charts, and having a process in statistical control, it would enable to carry out a capacity analysis based on tolerances specified by a standard or client. These specifications will define the upper and lower specification limits (USL and LSL respectively) [7]. Once the tolerances have been defined, all that remains is to measure the capacity of the process to comply with said specification, through a series of indicators indicated in Table 2.
The situation as it has been presented has the following problems:
In Argentina there is no general specification for the granulometry of the aggregates produced by a quarry.
In the absence of such specifications, quarries do not have a way to establish the plant capacity to meet the specifications required by the client.
The process may be in statistical control, but that does not mean that it meets a customer's specifications.
The ability to comply with the granulometry required by (JMF) will depend to a large extent on the possibility of generating mixtures of aggregates of different sizes which allow not exceeding the limits or tolerances established in the technical specifications.
The lack of linkage between data from the quarry production process and the tests carried out on said aggregate makes it difficult to take corrective measures in the event of detecting non-conformities or processes out of control.
The production of aggregates in Argentina does not escape this reality, deepening in some cases these problems, with a lack of equipment to carry out tests on the aggregate produced or laboratories with trained personnel to carry out quality control in the plant. Proposing a work methodology which takes these problems into account could provide tools to the value chain, which results in better quality aggregates and therefore more durable works.
Regarding the lack of specifications for the granulometry of the aggregates produced by the quarries, the development of limit curves for the producers becomes relevant, which allows them to control their production and adapt their processes to the client's requirements.
In the present work, a methodology is developed for the quality control of the stone aggregates produced by Cantera Piatti S.A. This quarry is located in Sierras Bayas, Buenos Aires Province, Argentina, the center of crushed stone production in the country, and is dedicated to the exploitation of granitic rock deposits. The development and testing of the methodology aims to create the bases for its application in other quarries. Regarding the creation of limit granulometric curves for the quarry under study, the way in which these curves can be generated and how their use could address the problem of variability in the gradation of coarse and fine aggregates which affect the quality of the value chain and the performance of road works, will be developed.
2. Methodological procedures
This research work was carried out at Cantera Piatti S.A. It is a quarry located in the Province of Buenos Aires, Argentina, in the northwestern region of the Tandilia System, where the igneous metamorphic basement called the Buenos Aires Complex is exposed [8]. Regarding the lithology of the system, it is mainly made up of migmatite, granitic to granodioritic gneiss and amphibolite intruded by Proterozoic plutonic bodies of essentially granitic to granodioritic composition and diabase [9,10].
In summary, quarry processing includes primary fragmentation by blasting, truck transportation to the crushing plant, and internal plant transportation by means of conveyor belts. The crushing plant is the typical one used to obtain a good morphology of aggregates, which consists of three crushing stages in which its last stage acts as a shape corrector. Primary crushing is carried out in a gyratory crusher which supplies material to a stockpile, which feeds a cone crusher located in a secondary position and the latter feeds another cone crusher that completes the three crushing stages. The plant inserts a series of sieves which, depending on the size of the mesh opening, separates the different products provided by the quarry by size. To limit the development of the methodology, the work included only the 0-6 mm and 6-20 mm products, however, the developed methodology can be adjusted to other product gradations.
Once the processing was described, the quality control carried out in the plant was analyzed, examining the available instruments and the frequency with which the tests are carried out. At the morphological and granulometric level, the quarry has a vibrating sieve and gauges to determine the flakiness and elongation index of the particles in accordance with the specifications of the IRAM 1687 1-2 standard.
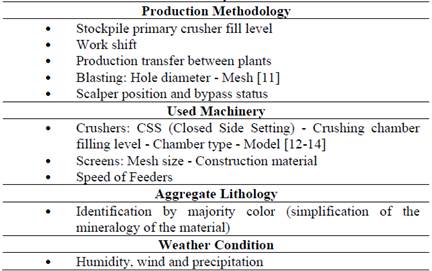
Once the lithology of the material, the procedures and equipment used in the plant and the quality control system were established, it was defined which process variables would be interesting to consider for their analysis. For this, it was resorted to selecting some variables that, based on previous studies on the subject, turned out to have, under specific conditions, a greater effect on shape and granulometric parameters of the aggregate. It should be noted that these variables were not the only ones considered, the system in question included others which do not correspond to previous studies on the subject, but to specific conditions of the quarry that made the analysis possible. They are indicated in Table 3.
The system was proposed to enable the relationship between the quality parameters of the aggregate (obtained from the tests carried out on the samples) and the configuration of the equipment, in order to facilitate the detection of non-conformities, their correlation with process variables and their subsequent correction.
2.1. System design for loading process variables
Linking process variables with test results requires loading said information into a database created for this purpose. Data loaded correctly, avoiding erroneous and/or repeated data, will be the main requirement for its subsequent analysis to be reliable. This information input method requires a reliable upload system, standardizing the information to be loaded. That is why implementing an upload form, with predefined responses, greatly reduces human error and therefore the generation of redundant or erroneous records.
It is important to highlight that in order to ensure traceability it requires that the samples tested be taken directly on the conveyor belt. Traceability makes it possible to analyze the process variables which affected the sample and thus be able to more accurately study the effects of these variables on the quality of the aggregate produced. In this sense, the system automatically assigns a unique code to the data collected from the process, referring to the sample produced. This code will be the same as that assigned to the results of the tests carried out on that sample. Thus, the database which includes the process data is linked to the database that contains the test results.
2.2. System design for granulometric control
For granulometric control, a system was proposed to facilitate the process of selection and filtering of the granulometries carried out. The information is loaded into a database by means of macros and dynamic tables. The purpose of this system is to automate the creation of control charts and the capability analysis for a given size distribution fraction. Being able to ensure a granulometry of the aggregate, whose variability is minimized to acceptable values, requires a control of the production which, from the taking of samples and the realization of granulometries in a systematic way every certain interval of time, allows evaluation by means of control charts whether the process is in statistical control. The criteria used to verify if the process is out of control, could be summarized in a series of patterns in the graphed points which, if fulfilled, will be indicative of anomalous situations in the behaviour of the samples. These criteria respond to the appearance of displacements, points out of limits, trends, periodicities, high variabilities and stratification in the observations [15].
2.3. Process capability analysis
Achieving a process under statistical control is not synonymous with being able to meet the specifications required by a client, which is why the capability analysis of a certain quality parameter is so important. As it was already stated, the granulometry of the aggregate has a great impact on the quality of the works of which it will be a part as a construction material; to measure the capacity of the aggregate processing plant to comply with said specifications would allow to see how capable it is the quarry to produce under these demands. Moreover, the granulometry of coarse and fine aggregates is subject to frequent changes, mainly due to factors involved in the production process, which is why ensuring the client a range of limit variation in a certain fraction of size could be a competitive advantage for the quarry. Carrying out a capability analysis implies knowing the specifications required for the analyzed quality parameter. For this reason, it is necessary for quarries to have a specification for each size distribution fraction which is in line with the granulometric spindles required in the production of asphalt and concrete mixes. By means of capability indicators cp, cpk and cpm, it will be determined to what extent the quarry is capable of meeting the defined requirements.
2.4. General specification for the granulometry of aggregates produced by quarries
A fundamental point of this work is to define the appropriate specification for the aggregates produced by the quarries. There is usually a confusion between the granulometric spindles required in (JMF) for asphalt and concrete mixes, with the granulometry which the quarries should really provide. This problem is manifested in demands by customers in certain particle sizes for a certain product which are often impossible for quarries to comply with. Moreover, as already stated, not knowing a real upper and lower specification limit for a given product makes it impossible for quarries to perform a capability analysis. The percentage of fine and coarse aggregates demanded by asphalt and concrete mixes causes this variation in specifications. This mixture of fine and coarse aggregates can have a variation in its proportions, providing some margin for the producer of the mixture to comply with the granulometric requirements of the work formula, especially when the particle size of the fine or coarse aggregate received is not within of the expected values.
Another issue to take into account when developing this specification for quarries is that rarely will a quarry produce aggregates for only one type of mix, for example, it is normal for a 6-20 mm aggregate to be marketed for use in different types of mixes. In this work, this situation was taken into account, proposing a methodology for cases which require considering different types of mixtures or potential customers for the same product.
Table 4 Granulometric spindles for different types of asphalt mixes and concrete pavements in Argentina.
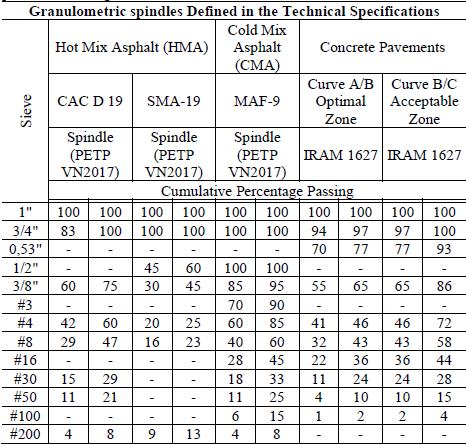
Source: Authors, 2023.
In the specific case of the same product for different uses, it can be noted that the same specification will not result if it is expected to provide 6-20 mm coarse aggregate to customers who produce an SMA-19 (Stone Mastic Asphalt), rather than an A/B cement concrete producer client. Despite this, in specific cases it will be possible to find compatibilities in the granulometry resulting from the mixture for different types of mixtures of the same maximum nominal size.
To search for compatibility between the granulometric spindles, five potential clients were defined, as an example, from which the granulometric spindles required by Dirección Nacional de Vialidad specifications were compiled, as can be seen in Table 4. The search for compatibility between limit curves of different mixtures consists in verifying if the lower and upper cumulative percentage passing allowed for one of the mixtures coincides with the range specified for the other mixture on the same sieve analyzed. It should be noted that it is possible that the compatibility sought does not occur in all the sieves of the series. This situation makes some limits more compatible with each other than others.
Once the potential customers and the existence of compatibility between the limits have been established, a resulting granulometric curve will be defined adjusted to the types of mixture selected. It will be used to establish the specification of the quarry. Previous step, it will be necessary to link the limits defined in the resulting granulometric curve obtained previously, with the possible variation in the percentages of fine and coarse aggregates which will make up the granular structure of the mixture and the variation that the cumulative percentage passing of the aggregate produced by the quarry may have in each sieve. The given situation requires testing many different scenarios in an extensive iterative process that would be difficult to perform without the use of software. This iterative process which allows evaluating how the variation in an acceptable range of one or more variables of the function affects the solution of an equation, keeping the rest fixed, is known as Sensitivity Analysis. In the case of this work, it was carried out in Microsoft Excel, by means of the hypothesis analysis function (Data Table) [16]. This function creates a matrix in which all the values which the resulting granulometric curve would take upon the variation in the percentage of coarse or fine aggregates that make up the mix, and the variation in the cumulative percentage passing of the aggregate produced by the quarry, can be observed. This process must be repeated for the desired sieves to generate the specification. From the different matrices obtained for the analyzed sieves, a series of limit curves were developed which could be used as a specification for a quarry whose potential clients require compliance with a granulometric spindle similar to that of the study. For other target customers, a methodology similar to the one proposed could be presented to obtain the specification curves adapted to the requirements of the quarry.
3. Results and discussion
Previous studies that analyze the issue of using aggregates with particle sizes outside specification limits do so from a perspective focused on the variability of aggregate gradation produced in quarries concerning their commercial typology and the drawbacks associated with their usage in the subsequent performance of asphalt mixes and concretes [17-19]. Despite the importance of this, there is a scarcity of previous studies that analyze how to mitigate this problem, with the scope limited to the application of control charts for statistical control of the gradation produced in quarries [20]. However, as explained in this work, this is not enough, as it would only partially address the issues of variability, but not the production of aggregates that conform to the gradation specifications required by producers of asphalt mixes and concretes. An important issue stemming from the above is the possibility of conducting a capability analysis in the quarry, a situation that becomes impossible without knowing the true requirements that the gradation of the produced aggregate must meet.
This work addresses these issues from a more comprehensive perspective, considering from the outset the difference between the specification limits that aggregate producers should use to control gradation and those established in technical specification documents for asphalt mixes and concretes. Considering this, tools were developed that could be replicated by other quarries, for the loading and linking of process data with laboratory test results, for the generation of X-R control charts, for the creation of limit gradation curves for quarries derived from the gradation range required by clients, and to link all of the above in a dashboard that, through graphs and capability indicators, allows the generation of strategies to meet the quality demands of clients.
3.1. Process data collection system
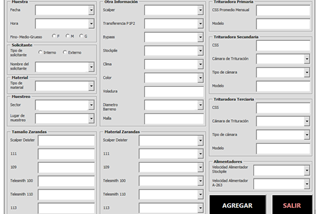
To link process information with the tests carried out, a data entry form was implemented, as represented in Fig. 2. Virtually all fields in the form have predefined values and can be selected from a dropdown menu, minimizing the issue of incorrect data entry. The data is recorded in a database that allows linking it to the test results.
3.2. System for creating X-R control charts
Regarding the load of the granulometric tests, a system was designed which allows, in a six-step process, automated by macros, as can be seen in Fig. 3, to generate X-R control charts for the cumulative percentage passing, recorded in different sieves of the same product.
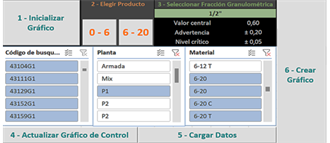
Source: Authors, 2023.
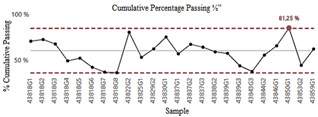
Figure 4 X control chart generated in Microsoft Power Bi for the analysis of the cumulative percentage passing in the ½” sieve of the 6-20 mm aggregate.
Although once the previous process is finished it is possible to analyze the control chart generated in Microsoft Excel, said analysis will be carried out in Microsoft Power Bi, due to the possibility that this program offers to focus on the critical points, in search of special causes of the process that could have affected the granulometry outside the control limits. In Fig. 4, the X control chart created in Power Bi is shown, with a point outside the control limits.
3.3. System for establishing the target granulometric spindle
Having achieved a granulometry under statistical control, this situation would enable the quarry to further enhance the quality assurance of the produced aggregate. For this, it will be necessary to know the limits between which the cumulative percentage passing in a given sieve can fluctuate. Consequently, it is first necessary to know the gradation zones required by potential clients and their compatibilities. By means of a selector developed in Microsoft Excel, up to five granulometric spindle can be compared simultaneously.
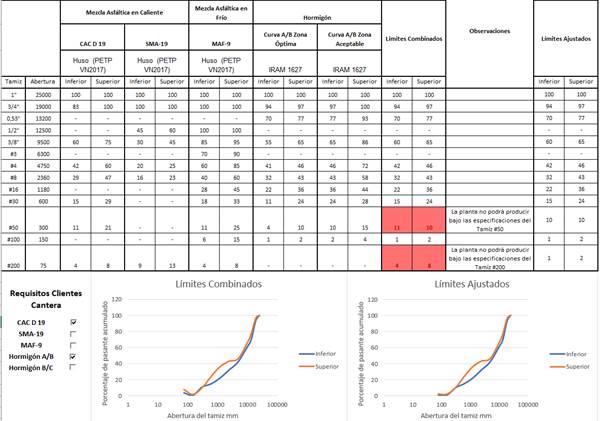
In order to present an example, the compatibility between the granulometric zone required for five types of asphalt mixtures and concrete was analyzed. In this analysis, the combination between the granulometric spindles of hot asphalt concrete of the dense CAC D 19 type and an A/B concrete pavement was found viable.
As can be seen in Fig. 5, the limit curve resulting from the combination of both granulometric spindles would not be compatible in the #50 and #200 sieves, a situation that can be solved with expanded tolerances in these sieves. It should be noted that this curve will serve to create the quarry specification based on the target clients.
3.4. Definition of the general specification for quarries
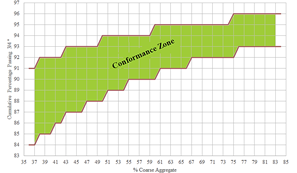
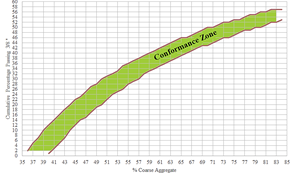
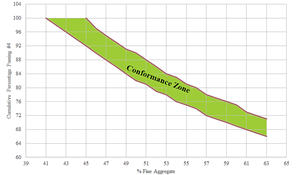
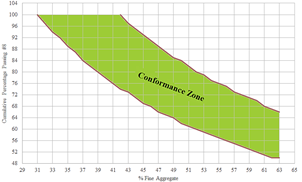
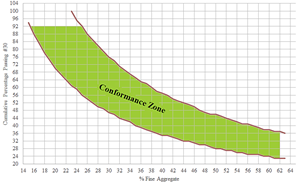
Once the target granulometric spindles associated with the potential clients has been obtained, all that remains is to link it with the granulometry that the quarry should provide in the series of sieves analyzed. For this, the sensitivity analysis was carried out by systematically varying the cumulative percentage passing produced by the quarry and the percentage of composition of coarse and fine aggregates of the granular skeleton of the target mixture. By carrying out this same procedure for all the products and sieves of the series that you wish to control, the specification limits for the quarry in question will be obtained. By performing this same procedure for all products and sieves in the series to be controlled, the specification limits for the quarry in question can be obtained. Based on the results provided by the sensitivity analysis, a series of graphs were generated to represent the specification for the specific case of the proposed example. These are graphed in Figs. 6-10. The graphs represent only five sieves in the series, and they can be extended to more sieves as per the quarry's needs. In green, the area is depicted where, for a certain percentage of cumulative passing, it will be possible to find a combination of fine or coarse aggregate which satisfies the granulometric spindle required in the (JMF).
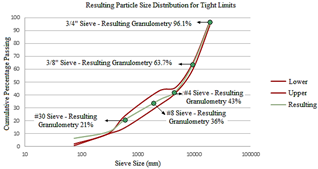
A test was carried out for the CAC D 19 asphalt mix, whose granular structure will have a composition of 49% coarse aggregate and 50% fine aggregate. Among the possible cumulative percentage passing for each sieve controlled by the quarry, a feasible option was found within a range of possible solutions. These can be seen in Table 5. As a result, the granulometry that the quarry should produce to provide an aggregate that meets the customer's requirements is obtained. Considering the intervals obtained under the conditions of the example, the limit granulometric curve for the quarry could be defined and therefore the upper and lower specification limits.
Table 5 Possible granulometries of coarse and fine aggregate which comply with the granulometric spindle required in the example.
| Sieve | Cumulative Percentage Passing of Coarse Aggregates | Cumulative Percentage Passing of Fine Aggregates |
|---|---|---|
| 3/4” | 92 (88-93) | - |
| 3/8” | 26 (19-28) | - |
| #4 | - | 84 (82-90) |
| #8 | - | 70 (62-84) |
| #30 | - | 40 (28-46) |
Source: Authors, 2023.
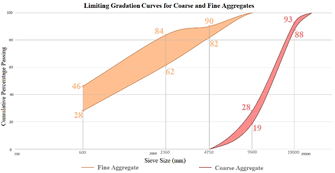
In Fig. 11, the tolerance intervals for each sieve are established, which, if met, will ensure a granulometry suitable for use by producers of CAC D 19 asphalt mix and A/B concrete, according to the conditions of the example.
Each target cumulative percentage passing within the interval will establish a resulting granulometric value. In the event that this percentage belongs to the tolerance interval as indicated in Fig. 12, the resulting granulometry of the sieve will be compatible with the adjusted granulometric range required by the mixture.
Source: Authors, 2023.
Figure 11 Limit granulometric curve obtained under the conditions of the example.
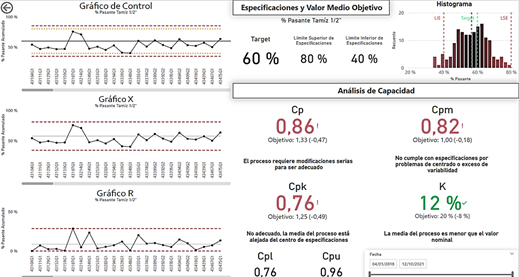
3.5. Development of the dashboard for gradation control and capability analysis
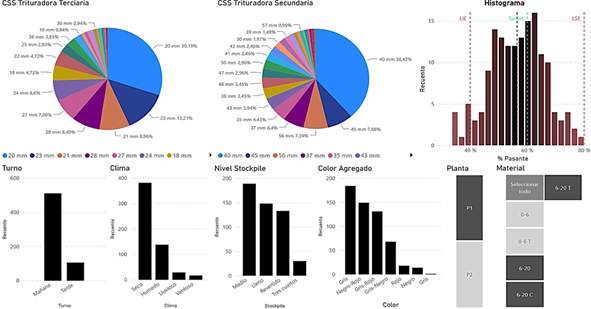
Once the tolerance interval is defined, the quarry will be in a position to carry out capability analysis. To facilitate its visualization and comparison with other variables controlled by the quarry, a dashboard for gradation control and capability analysis was developed in Microsoft Power Bi, like the one represented in Fig. 13. In it, there is a color distinction on the capability indicators. The colors act as alerts depending on their value, being shown in green when customer specifications can be met and in red when corrective measures are required. In addition, a brief description is added under each indicator which makes it easy to identify what the problem is. Moreover, the target value and the current value are displayed in each case. Through Microsoft Power Bi, all the recorded information is displayed in dynamic graphics, which allow interrelation with other dashboard graphics. This way it is possible, among other things, to obtain information of interest from critical or alert points that can be assigned to special causes. The detection and elimination of these special causes due to extraordinary situations is simplified by relating it to process information. Additionally, the interrelation between graphs could facilitate the detection of common causes of variability generally related to inappropriate procedures, equipment maintenance, normal wear and tear, among other factors. Through histograms, it can be verified under which process conditions the greatest amount of granulometries out of specification were produced, greatly simplifying decision making and consequently the quality of the processed aggregate. This interaction can be seen in Fig. 14.
Conclusion
A part of this work was dedicated to developing a methodology that facilitates obtaining process information and, through production traceability, allows its correlation with quality parameters of the aggregate. To achieve this, the way process data and test results should be recorded, and how they would be linked together were defined, enabling the analysis. This system is essential if one intends to investigate the causes of deviations in the quality of the produced aggregate.
Regarding the granulometric analysis, two objectives were established which would allow, on the one hand, to verify if the granulometry produced is in statistical control and, on the other, the possibility of carrying out a capability analysis. To verify if the gradation is under statistical control, it was necessary to develop a system that automates this procedure for each sieve in the analyzed series, generating control charts through a data filtering process. While the use of control charts is widely adopted in the industrial context due to the benefits it brings, for the specific case of aggregate-producing quarries, its application is almost non-existent, limited to quarries seeking to differentiate themselves from the competition with higher-quality aggregates. Therefore, the development of a system that automates this procedure could reduce its costs and consequently be adopted by a greater number of quarries. As a result of the large-scale application of a similar system, the variability of the granulometry of the aggregates produced would be greatly reduced and, therefore, the general quality of the materials of which it will be a part would improve. For those cases in which the granulometric is in statistical control, there is the possibility of carrying out a capability analysis, which allows verifying how capable the quarry is of producing a certain granulometry of aggregate. Although this seems simple, it is not since the specifications necessary to measure the capability will depend on the clients to whom said material must be provided. Furthermore, in Argentina there is no granulometric specification for the production of aggregates in quarries, hence quarries generally produce under certain types of aggregates such as 6-20 mm or 0-6 mm without knowing for sure which granulometry should be supplied to their customers. It is worth noting the conditions customers can demand from quarries, which in many cases are impossible to comply with. A possible scenario is given by the intrinsic variability of the process, which in quarries with little capacity for quality control can generate a process out of statistical control. But there is also the possibility that it is due to the incorrect need on the part of the clients to enforce a certain granulometric spindle required in the Dirección Nacional de Vialidad regulations for asphalt or concrete mixtures, which due to variations in the composition of the granular skeleton of the mix will not be the same as that provided by the quarry. This problem of lack of specification for quarries could be solved through a sensitivity analysis which links the granulometry produced by the quarry with the limit granulometric curves required for asphalt and concrete mixtures.
In this work, the analysis was prepared for a limited test scenario, of a quarry whose potential clients require the production of CAC D 19 asphalt mixes and A/B concretes. As a first instance, a system was developed to verify the compatibility between the technical specifications of both mixtures, resulting in an adjusted limit granulometric curve, feasible to adapt to the quarry's production.
Once this curve was defined, the sensitivity analysis was carried out, from which five graphs were obtained that allow for a straightforward visualization of the limits in which a specific composition of the granular skeleton of the mixture and a certain cumulative percentage passing in a sieve of the analyzed series, allow compliance with the granulometric requirements of the JMF. This general specification for quarries represented in the graphs mainly serves the quarry to establish production objectives that allow measuring capacity with indicators such as cp, cpk or cpm. Although this would be the main use, it could also be used by plants which produce mixtures to analyze cases in which the granulometry provided by the quarry does not conform to the required granulometric spindle, allowing, based on the observation of said graphs, to know what the combination is of coarse and fine aggregates suitable for that granulometry received.
Those quarries that apply a quality control system similar to the one proposed will be able to analyze the morphological and granulometric behavior of the aggregate with respect to variations in production conditions and take corrective measures in the case of deviations. In addition, they will be able to ensure a certain range of variability in the granulometry of the aggregates produced, minimizing the uncertainty of clients when receiving aggregates that effectively comply with the commercially specified granulometry and positively impacting the entire value chain, causing asphalt mixtures and concrete have better performance due to the use of aggregates with more exhaustive quality control.

