


 English (pdf)
 Article in xml format
 Article references
 Send this article by e-mail
 Cited by SciELO
  Cited by Google
  Similars in
SciELO
Similars in
SciELO  Similars in Google
 Permalink
INTRODUCTION
Chalcones are one of the most important classes of flavonoids across the whole plant kingdom [1,2]. The chemistry of chalcones has generated intensive scientific studies throughout the world due to the large number of replaceable hydrogens that allows a large number of derivatives and a variety of promising biological activities to be generated e.g., anti-microbial [3], anti-cancer [4], anti-inflammatory [5], anti-malarial [6], anti-allergic [7], anti-oxidant [8], anti-infective [9], anti-influenze [10], anti-protozoal [11] etc. In modified form, these compounds are widely distributed in foods and beverages such as vegetables, fruits, tea, soy-based foodstuff and spices [12,13].
Chalcones are multifunctional molecules, since one particular structure can show multiple biological activities. These compounds are known to be excellent scaffolds for synthetic manipulation with multiple pharmacological properties [14-17]. Various other industrial and pharmaceutical applications of chalcones have also been reported [18-21]. Nowadays, an emerging interest is focused on the role of chalcones in agricultural systems. Regarding pest defense and weed control, the most interesting biological activities of chalcones are the bactericide, antifungal, antihelmintic, insecticidal, insect antifeedant, antiviral and phytotoxic activities [22-24].
There are a lot of chalcone derivatives that have been synthesized and identified by researchers in the laboratory through different chemical methods [25]. The synthesis of new compounds based on the chalcone skeleton provides a new world of possibilities for biological activities and applications [26-30].
Thus, due to importance of this class of compounds, in the present paper, some novel chalcone derivatives are synthesized and their physicochemical properties such as refractive index, conductance, dissociation constant, acoustical parameters, partition function etc., are studied in N, N, dimethyl formamide and chloroform at 303.15 K, which will be useful for application of these compounds in various fields.
EXPERIMENTAL
Synthesis
An aqueous solution of vanillin was refluxed at 95-97°C for half an hour with stirring. To this solution, few drops of NaOH and diethyl sulphate were added slowly and again the reaction mixture was refluxed for 5 to 7 hrs with stirring. After the completion of reaction, organic layer was isolated and cooled at room temperature. The solid crude product (3-methoxy4-ethoxybenzaldehyde) was isolated and crystallized from absolute ethanol.

A mixture of above synthesized product 3-methoxy4-ethoxy benzaldehyde and substituted acetophenone in methanol was stirred for 24 h in presence of few drops of sodium hydroxide solution. The product was filtered and dried. The recrystallization was done in ethanol.
Similarly, other compounds were synthesized. Table 1 shows the different substitutions and physical parameters of all the synthesized compounds. These chalcone compounds are used for physicochemical studies after crystallization.
Physicochemical studies
The N, N-dimethyl formamide (DMF) and chloroform used was of AR grade supplied by Spectrochem Pvt. Ltd. (Mumbai, India) and was purified according to the standard procedure [31]. The purity of solvents were confirmed by GC-MS (SHIMADZU-Model No.-QP-2010) equipped with column (DB-5MS, 25 m in length, 0.20 mm internal diameter and 0.33μm film) and was found to be more than 99.98%.
Solutions of different concentrations were made in DMF and chloroform for all the synthesized compounds.
Acoustical parameters: The density, sound velocity and viscosity of synthesized compounds are measured in N, N-dimethylformamide and chloroform solutions of wide range of concentrations at 303.15 K. With these experimental data, some acoustical parameters such as adiabatic compressibility (ks), intermolecular free length (L f ), solvation number (Sn), etc., have been computed to study molecular interactions in solutions.
Measurements of Density and Ultrasound velocity: The ultrasonic velocity and density measurements of pure solvents and solutions of different chalcones have been done by using Mittal enterprises ultrasonic Interfermeter (Model No. F81) and pyknometer with accuracy of density and velocity are ±0.05 kg/m3 and ±0.5 m/s respectively. The instrument was fully automated and the temperature was automatically controlled. Calibration was carried out using double distilled water.
Measurement of viscosity: The Ubbelohde viscometer with 25 ml capacity was used for the viscosity measurement with accuracy ±0.06%. The viscometer was calibrated with fresh conductivity water immersed in a water bath that was maintained at the experimental temperature, 303.15 K. The flow time of water (t w ), of pure solvents and the flow time of solution, (t s ) were measured with a digital stop watch with an accuracy of ±0.01 s (Model: RACER HS-10W). The temperature stability was maintained by circulating water from a thermostat (NOVA NV-8550 E, accuracy of ± 0.1 K) around the viscometer. The accuracy of viscosity is ± 0.05%.
Refractive index: The Abbe refractometer was used for the measurement of refractive index of solutions of synthesized compounds at 303.15 K.
Conductance: For all the synthesized chalcones, conductance is measured in DMF and chloroform solutions at 303.15 K. The conductance of each solution was measured by using Equip-tronics conductivity meter (Model No. 664) having a cell constant 0.86 cm-1 at 303.15 K.
Partition coefficient: n-Octanol is of analytical grade. The purity ofsolvent was checked by GC and found to be 99.9%. Milli-Q-water was used throughout for all experiments.
Preparation of standard solution: 10 mg sample was dissolved in n-octanol to give 100 ml solution of 100 ppm. Using this standard solution, λmax was determined using UV spectrophotometer (Shimadzu, UV-1700, Pharmaspec). Suitable dilutions were made from this standard solution (2 μg to 20 μg) and absorbance (OD) was measured. The plot of absorbance versus concentration gives the calibration curve.
A known concentration of the compound solution was prepared in n-octanol. Equal volumes of this solution and water is mixed in oven dried stoppered flask and the mixture was stirred for 24 h at room temperature. After 24 h, the solution was transferred into 250 ml of separating funnel and allowed to stand in order to separate the aqueous and organic layers. The organic layer will be upper one while lower will be aqueous. The organic layer was then analyzed by UV spectrophotometer. Using calibration curve, the concentration of compounds in organic layer was then evaluated.
As partition coefficient is highly influenced by pH, a wide range of pH (0.84 to 8.0) is selected. For 0.84 pH, 0.1 N HCl was taken whereas for 6.0, 7.4 and 8.0, phosphate buffer was used.
Dissociation constant: For each compound, 100 ppm solution was prepared in DMF. This solution was used to determine the λmax using UV spectrophotometer (Shimadzu, UV-1700, Pharmaspec) equipped with 1 cm path length cell, controlled by computer.
An electrical balance (Mettler Toledo AB204-S) with an accuracy of ± 0.1mg was used for solution preparation.
The following sets of solution were prepared.
Set I: 2 ml HNO3 (0.01 M) + 4 ml NaNO3 (0.01 M) + 19 ml DMF
Set-II: 2 ml HNO3 (0.01 M) + 4 ml NaNO3 (0.01 M) + 2 ml compound solution (15 ppm) +17 ml DMF
Thus, total volume of each set was 25 ml and DMF: water ratio was 90: 10 (v/v).
To each set of solution, pH and absorbance were measured after each addition of 0.1 ml NaOH till there is no change in absorbance.
A Systronic pH meter (Model No. EQ-664) was calibrated with buffer solutions of known pH. The buffers used were potassium hydrogen phthalate and sodium borate decahydrate. The pH of all the solutions was measured by pH meter. The accuracy of pH meter was ±0.01 pH unit.
RESULTS AND DISCUSSION
Physicochemical Studies
Acoustical properties: The experimental values of density (ρ), viscosity (η) and ultrasonic velocity (U) of pure solvents and solutions of synthesized compounds are given in Table 2.
Table 2 The density (ρ)*, ultrasonic velocity (U)* and viscosity (η)* of synthesized compounds in DMF and Chloroform at 303.15 K.
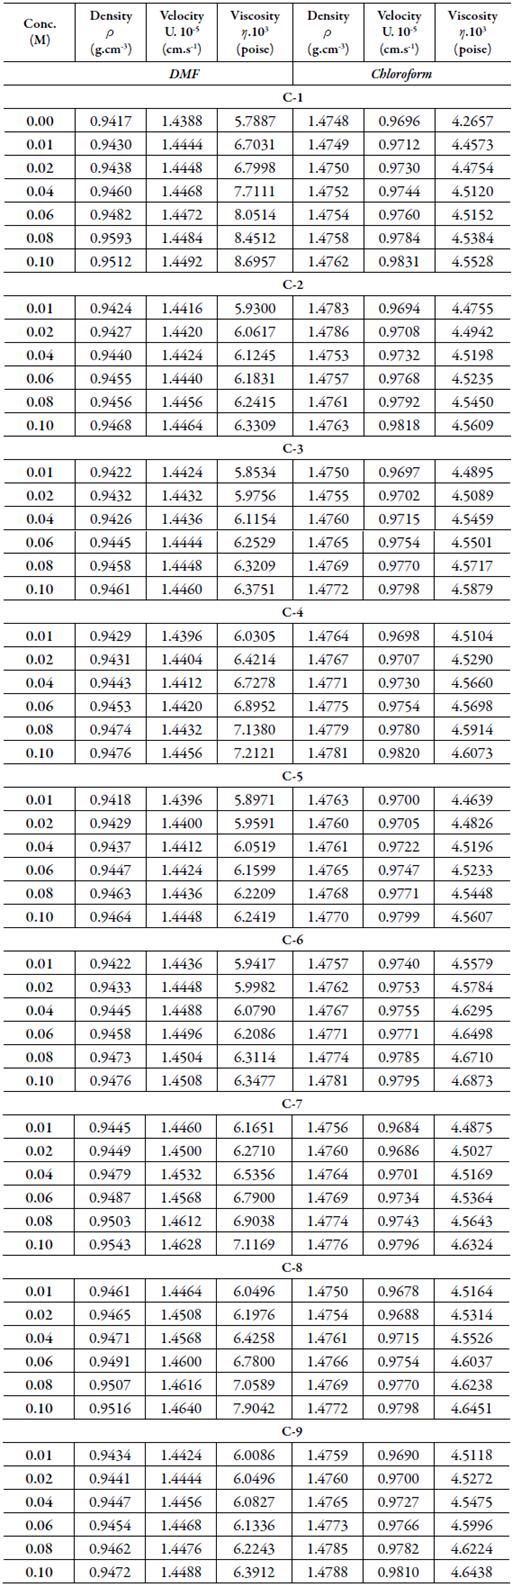
*Uncertainties: Density (ρ): ± 0.0001 g.cm-3; Ultrasonic velocity (U): 0.01 % ; Viscosity (η): ±0.01 s
To study molecular interactions of compounds in solutions, some acoustical and apparent parameters such as intermolecular free path length (L f ), adiabatic compressibility (k s ), relaxation strength (r), Rao's molar sound function (Rm), Van der Waal's constant (b), molar compressibility (W), solvation number (Sn), apparent molar compressibility (φΙ) and apparent molar volume (φυ) were evaluated using experimental data using following equations:
Intermolecular free path length:L
f
=
Where Kj is a temperature-dependent Jacobson's constant (93.875 + 0.375T) χ 10-8.
Isentropic compressibility: x s = 1/U 2 p
Relaxation Strength: r = 1-(U/U0)2, where U0 = 1.6 x 105 cm/s.
Rao's molar sound function: R m = (M/p)U1/3, where M is the molecular weight of solution.
Van der Waal's Constant: b = (M/p) (1-RT/MU 2 (√(1+MU 2 /3RT)-1)) where R is gas constant and T is absolute temperature.
Solvation number: 
Where X is the number of grams of solute in 100 gm of the solution. M 1 and M 2 are the molecular weights and K S1 and K S are adiabatic compressibility of pure solvent and solute respectively.
Some of these thermodynamic parameters are given in Table 3.
Figure 1 shows the variation of ultrasound velocity with concentration in DMF and chloroform. It is observed that overall ultrasonic velocity increases with concentration for all the synthesized compounds in both the solvents. The velocity depends on intermolecular free length (L f ).
Figure 1. The variation of ultrasonic velocity with concentration for compounds in [A] DMF and [B] Chloroform at 303.15 K. ♦: C-1. ■: C-2. ▲ : C-3. ●·: C-4 ♦: C-5. ■: C-6. ▲ : C-7. ·●: C-8. ■: C-9.
The increase inintermolecular free length causes decrease in ultrasonic velocity or vice versa. Thus, ultrasonic velocity is reverse of intermolecular free length. Table 3 shows that intermolecular free length (L f ) decreases with increase in concentration although ultrasonic velocity increases with concentration.
The decrease of intermolecular free length with increase of concentration suggests that the distance between solute and solvent molecules decrease due to increase in solute-solvent interactions, which causes velocity to increase. This is supported by isentropic compressibility (к s ) and relaxation strength (r). Figure 2 shows the variation of isentropic compressibility (k s ) with increase in concentration.
Figure 2 The variation of isentropic compressibility (κs) with concentration for compounds in [A] DMF and [B] Chloroform at 303.15 K. ♦: C-1. ■: C-2. ▲: C-3. ●: C-4.♦: C-5. ■: C-6. ▲: C-7. ●: C-8.■: C-9.
The decrease inisentropic compressibility with increasing concentration might be due to aggregation of solvent molecules aroundchalcone molecules indicating therebypresence of solute-solvent interactions. This is supported by decrease in relaxation strength (r) with concentration in studied systems (as shown in Table 3).
Table 3 shows the increase ofmolar soundfunction (R m ) and Vander Waals constant (b) with concentration for all the compounds. The correlation coefficients for these parameters are in the range of 0.9989-0.9999. This linear increase of these parameters suggests the absence ofcomplex formation in these systems.
The type of interactions between solute and solvent molecules can also be suggested by solvation number (S n ), which gives the information about structure forming tendency or structure breaking tendency of a compound in solutions. Figure 3 shows variation of solvation number of compounds with concentration in both the solvents.
Figure 3 The variation of solvation number with concentration for compounds in [A] DMF and [B] Chloroform at 303.15 K. ♦: C-1. ■: C-2. ▲: C-3. ●: C-4.♦: C-5. ■: C-6. ▲: C-7. ●: C-8.■: C-9.
It is observed that for the studied compounds, the solvation numbers are positive in both the solvents. However, values are higher in DMF than those in chloroform. As evident from Figure, in DMF, S n values increases continuously with concentration for all the compounds. However in chloroform, for all the compounds except C-6, S n values decreases with concentration. This suggests that in DMF, the studied compounds exhibited structure forming tendency due to solute-solvent interaction between solute and solvent molecules which causes an increase in solvation number. As solute concentration increases, solute-solvent interactions also increases which causes increase in aggregation of molecules i.e. structure forming tendency of solute. In chloroform, as concentration increases, structure forming tendency decreases. This indicates that in chloroform, with increase in concentration, solute- solute interactions predominates.
Thus, comparison of solvation number in the two solvents shows that in DMF, structure forming tendency is much higher than that in chloroform. This indicates the existence of considerable amount of solute- solute interactions in chloroform solutions.
Refractive index:Table 4 shows the experimental values of densities and refractive index of solutions of all the ten synthesized compounds in DMF and chloroform at 303.15 K.
Table 4 The density (ρ 12) and refractive index (n) of chalcones in DMF and chloroform at 303.15 K.
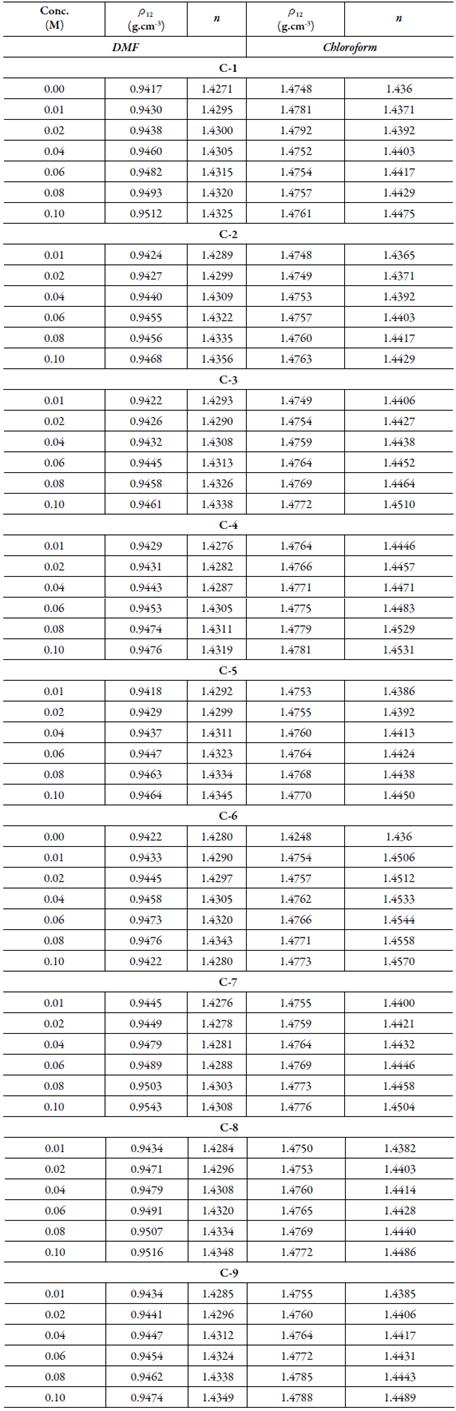
Uncertainties: Density (ρ 12): ±0.0001 g cm-3, Refractive index (n): ±0.0001.
The density of solution (ρ 12) is related to densities of the solvent, solute and their weight fractions g1 and g2 according to the equation:
where ρ 12 is the density of solution andρ 1 andρ 2 are the densities of solvent and solute respectively.
The densities of all the synthesized compounds were evaluated from the slope of plots of 1/ g 1 ρ 12 versus g 2 /g 1 . The inverse of slope gives density of compound (ρ 2). Table 5 shows these calculated densities for all the compounds along with theoretical values evaluated using the following equation [32]:
Here ρ indicates the density of the compound, K is packing fraction which is equal to 0.599 for organic compounds, M is for molecular weight of the compound, N a is the Avogadro's number and ∆ V i is the volume increment of the atoms and atomic groups present in the compound. The density of all the studied compounds have been evaluated and reported in Table 5.
The experimental density values are different from those evaluated theoretically. Further, for the same compound, density in the two different solvents is different. This suggests that solvent plays an important role. In solutions, molecular interactions exists which differs with different solvents. These intermolecular interactions differ due to different substitutions in compounds. The presence of these interactions has also been observed in ultrasonic studies discussed above. Due to these interactions, volume changes which causes change in density.
Further, the molar refraction of a pure liquid (MRD)1 can be calculated using the Lorentz-Lorenz equation [33]:
where n, M and ρ are refractive index, molecular weight and density of pure liquid respectively.
For solutions, the following Eq. (4) was used to determine molar refraction.
where n12 and p12 are refractive index and density of solution respectively. X1 and X2 are the mole fractions and M 1 and M 2 are the molecular weight of the solvent and solute respectively.
From the values of the molar refraction of solution and pure solvent, molar refraction of solid compounds were determined by following equation:

From the density and molar refraction data, the refractive indexes of all the compounds were calculated from Eq. (3). The molar refraction (MRD)2 and refractive index of all the compounds are reported in Table 6 for 0.1 M solution.
Table 6 Molar refraction ((MRD)2) and refractive index (n) of synthesized Chalcones at 0.1 N solution.
Both (MRD)2 and refractive index of compounds are different in each solvent. This again proves that in different solvents intermolecular interactions are different, which affect these parameters. Further, for different compounds,(MRD)2 are quite different whereas refractive index differ only slightly. This suggests that although substitution affect (MRD)2 largely, refractive index only slightly. However, the variation of refractive index of all the compounds in a particular solvent is very less.
Conductance: The measured conductance (k) of each solution was used to determine the specific conductance (k), which is then used for the calculation of equivalent conductance (λc).
The equations used for calculating specific conductance (κ) and equivalent conductance (λc) are:
where θ is the cell constant (0.86 cm-1) and c is the concentration (g.equiv./lit.) of solution.
The conductance of solutions of chalcone compounds in both the solvents is listed in Table 7.
Table 7 The conductance* (mmho) of chalcones in DMF and chloroform at 303.15 K.
*Uncertainty in conductance is ±0.02 mmho.
It is observed that for all the compounds, conductance increases with concentration. Further, conductance is lower in chloroformthan that in DMF.
Figure 4 shows the variation of equivalent conductance with concentrationin both DMF and chloroform solutions.
Figure 4 The variation of equivalent conductance with square root of concentration for compounds in [A] DMF and [B] Chloroform at 303.15 K. ♦: C-1. ■: C-2. ▲: C-3. ●: C-4.♦: C-5. ■: C-6. ▲: C-7. ●: C-8.■: C-9.
In both cases, usually equivalent conductance (λc) increases with dilution. However, for certain compounds in both DMF (C-9) and chloroform (C-2), λ c do not increase continuously but bend downward at low concentrations. This typical behavior may be due to interactions within the molecule thereby causing constriction within the molecule or due to association between compound molecules with solvent molecules. Further, it is evident from these figures that most of the compounds behave as weak electrolytes whereas some of them exhibited slightly strong electrolytic behavior. Further, behavior is different in different solvents.
So for few compounds, λ0 value can be evaluated by extrapolation of plot of λ c versus √C. However, for the solutions where λ C decreases at low concentrations, A0 could not be weak electrolytes, it is difficult to determine λ0. There is an alternate procedure also to determine λ0 using the following equation [34]:
where k and k 0 are the electrolytic conductivity of the solutions and solvent respectively. C is the equivalent concentration and the function ΦΙ denotes the effect of inter-ionic interactions.
The limiting conductivity can be evaluated accurately from the limiting slope of smaller linear portions of the curve of k versus c, provided other derivatives (dk 0 /dc) and d[c ΦI]/dc in differential form of equation (8) are neglected as compared to A0, which can be determined from differential form of equation (8) is:
These λ0 values are reported in Table 8 along with those determined by extrapolation. For the systems where λC decreases at low concentrations, λ 0 could not be evaluated.
Table 8 The limiting equivalent conductance λ0 (mho cm2.equi-1) of studied compounds in DMF and Chloroform at 303.15 K.
From Table 8, it is observed that in both the solvents, calculated values of limiting equivalent conductance (λ0) are in fair agreement with those evaluated graphically suggesting thereby that equation (8) can be used for the studied systems. However, for some cases, deviations are significant suggesting thereby that equations (8) and (9) are not valid for these systems. The deviation may be due to the fact that in equations (8) and (9), inter ionic interactions are ignored which may play an important role in these systems.
Partition coefficient: The log P values for the studied compounds at different pH are given in Table 9. The log P value depends upon the hydrophilic and hydrophobic character of compounds and has inverse relation with hydrophilicity of compounds.
The variation of log P with pH for all the studied compounds is also shown in Figure 5.
Figure 5 The variation of log P for studied compounds with pH. ■: water; ■: 0.1 N HCl; ■: 6.0 pH; ■: 7.4 pH; ■: 8.0 pH.
The selected pH values were due to their existence in human body. As HCl exists in gastric juice in stomach, 0.1 N HCl is taken. Blood has 7.4 pH, so the study is done at pH 7.4. Further, the middle and upper range of body pH is 6.0 and 8.0 respectively, so study was done at these all pH also. It is clear from Figure 7 that log P is maximum for SNC-7 suggesting thereby hydrophobic nature of this compound whereas SNC-1 is highly hydrophilic as its log P is minimum.
All the studied compounds have the same central moiety but different side chains i.e, substituents, as shown in Table 1. Thus the hydrophobic or hydrophilic character of a compound depends not only on pH but also on substituent. As reported in Table 1, C-7 contains hydroxyl group at para position whereas C-1 has chloro group at para position. Thus, the presence of hydroxyl group increases the hydrophobicity (as in C-7) in comparison to chloro group (as in C-1).
However, the hydrophilic or hydrophobic nature of chalcone compounds varies with pH. In 0.1 N HCl, again C-7 is highly hydrophobic whereas C-5 containing 4-methoxy group is found to be hydrophilic. Thus, in gastric juice, C-7 will not be absorbed whereas C-5 can be easily absorbed.
At pH 6.0, log P is maximum for C-6 containing 4-bromo group whereas 4-hydroxy group containing C-7 has lowest value of log P. Thus, at this pH, C-6 exhibits maximum hydrophobicity whereas C-7 is most hydrophilic. It means that in blood, C-7 can be easily absorbed.
At pH 7.4, among all these compounds, C-2 containing 4-nitro group has minimum log P whereas maximum is observed for C-5 containing 4-methoxy group. Thus, C-5 will not be absorbed in blood and is less likely to spread in the body. However, it is more likely to accumulate in fatty tissues [35,36].
When pH is 8.0, maximum and minimum log P values are exhibited by C-7 and C-2 respectively. Thus, again in alkaline pH, C-7 will not be absorbed in bloodbut can be accumulated in fatty tissues [35,36].
Thus, it is concluded that the position of functional group is also important in the hydrophobic-hydrophilic character of the compound. Overall observation shows that C-7 exhibited hydrophobic character in neutral, acidic and alkaline systems although it contains hydroxyl group.
Dissociation constant: The dissociation constants or pKa of studied compounds are determined from the plot of absorbance versus pH.
Table 10 shows the pKa values for the studied compounds. It is observed that substitution group affects the dissociation constant as expected. Table 1 shows different substitutions in studied chalcones. The presence of bromo group at para position causes C-6 most basic whereas due to hydroxyl group at para position, C-7 is most acidic. The two dissociation constants in C-7 are due to two replaceable hydrogen. This is in agreement with the reported results of increase ofacidic character of compounds due to presence of hydroxyl group [37-39].
CONCLUSION
It is concluded that physicochemical properties of a compound depends on its structure and solvents in which it is dissolved. For compounds having same central moiety, nature of substitution plays an important role in solution due to which interactions changes in different solvents thereby affecting properties. Further, position of substitution in a compound also affects physicochemical properties.

