


 Inglês (pdf)
 Artigo em XML
 Referências do artigo
 Enviar este artigo por email
 Citado por SciELO
  Citado por Google
  Similares em
SciELO
Similares em
SciELO  Similares em Google
 Permalink
INTRODUCTION
Blepharitis is a common chronic eye condition that causes eyelid inflammation, with a prevalence of 8.1% among subjects aged 40 years or older [1]. It mainly affects palpebral margins, specifically the eyelash follicles and the sebaceous glands located near them. Symptoms include inflamed, irritated, sticky and itchy eyelids, flaking of the skin, sensitivity to light and red, watery eyes [2]. Complications of the condition can often lead to permanent alterations to the eyelid margin or vision loss from superficial keratopathy, neovascularization of the cornea and ulceration [3].
Blepharitis has been linked to a wide arrange of conditions. Among them, seborrheic dermatitis, Staphylococcus aureus infection, Rosacea, Meibomian gland dysfunction, and mite infestation have been the most cited [3-6]. However, the exact cause of blepharitis remains to be elucidated, as its emergence could be attributed to multiple skin conditions being simultaneously present.
Blepharitis has been categorized based on the anatomical location of disease: Anterior blepharitis occurring due to a staphylococcal infection and seborrheic dermatitis, which cause inflammation at the base of the eyelashes; Posterior blepharitis due to meibomian gland dysfunction (MGD), a condition characterized by abnormalities and blockage of the meibomian glands, stopping the secretion of enough oil into the tears, which affects the posterior lid margin that comes into contact with the cornea and bulbar conjunctiva; and marginal blepharitis, including both anterior and posterior [3]. On the other hand, high numbers of Demodexfolliculorum, a mite commonly found on human skin, have been found around the lash follicles and sebaceous glands of patients with blepharitis [7]. This mite might have a role in both anterior and posterior blepharitis since it could block the hair follicles, or induce an inflammatory immune response after its demise [7].
Depending on the location, different treatments have been proposed to control, but not cure, blepharitis. For anterior blepharitis, topical antibiotics such as tobramycin and neomycin, in combination with steroids such as dexamethasone, have provided some symptomatic relief during acute face, and have been effective in clearing bacteria from the eyelid margins [8]. For posterior blepharitis, tear-free baby shampoo has been used for MGD treatment, offering symptom relief in some patients. The use of Baby shampoo has been a common medical practice suggested by physicians to patients, since it allows the cleaning of the eyelids with relative ease [9]. Moreover, supplements rich in omega-3 fatty acids have been shown to improve MGD symptoms [10]. Terpinen-4-ol, a component of Tea tree oil (TTO), has been found useful in treating MGD and promoting bacterial and Demodex eradication [11].
Even though different treatment alternatives exist for all types of blepharitis, no single treatment has been found to be effective in curing the condition. Once the diagnosis has been made, patients are usually placed in a short course of antibiotics in combination with a steroid agent. The condition usually stabilizes for a few weeks till a relapse occurs. Considering the risk of antibiotic resistance and side effects produced by continued steroid use in chronic blepharitis conditions, patients are eventually subjected to a standard indefinite daily cleaning regimen of the eyelids. This treatment relies on warm compresses and the use of eyelid scrubs soaked in a solution of water with baby shampoo for the mechanical removal of debris, scales and the prevention of MG blockage.
Various eyelid cleaning foaming solutions have recently entered the market. These solutions have been marketed as effective treatments for Demodex eradication in the eyelids and optimal control of blepharitis since they commonly contain TTO, which has been demonstrated to possess acaricidal, antibacterial, antipruritic, anti-inflammatory, and wound healing effects [12]. Therefore, in order to control blepharitis, ophthalmologists often prescribe these formulations as adequate eyelid cleaning solutions.
Nevertheless, a standardization of TTO concentration which provides effective treatment of the condition has not been reported and usually isn't defined on the commercial eyelid cleaning solutions. Also, being a chronic condition, blepharitis requires indefinite use of an eyelid cleaning solution which, in the majority of cases, has a minimum price of 20 USD per 80 g bottle and lasts, on average, one month. For those patients unable to afford the treatment, physicians have been recommending the use of a do it yourself (DIY) solution containing Johnson's Baby Shampoo in water or other similar shampoos. This alternative has eventually become the most common way of treating blepharitis and has been recognized by the American Academy of Ophthalmology (AAO) as a viable lid hygiene option [13]. However, the efficacy of DIY eyelid solutions might fluctuate according to the type of blepharitis present in the patient. Moreover, an inadequate pH stabilization of the solution might promote additional itchiness, irritation, and dryness of the skin and eyes [14].
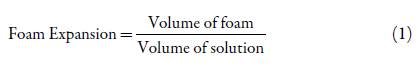
For the above reasons, it is clear that a low cost effective and standardized eyelid cleaning solution for the treatment of chronic blepharitis has not been reported. Thus, this work proposes an optimized DIY solution prototype for symptom management in patients with chronic blepharitis. Through the creation and execution of an I-optimal mixture experimental design, an optimized formulation of water, TTO, baby shampoo and sodium lauryl sulfate (SLS) was found. The aim of the design was to find the proportion of each component in the mixture that allowed an optimal pH, ideally equal to skin pH of 5.0 [14], an optimal capacity to form foam for correct application of the solution on the eyelids and increased TTO penetration [15], and a minimum TTO proportion that resulted in effective eradication of ocular Demodex, bacteria, decrease in inflammation and itchiness and, eventually, a state of remission in the condition. Therefore, pH and foam expansion, defined in equation 1, were the response variables of the experiment. Statistical analysis was performed for determining the statistical validity of the results, and a regression model was determined for each response variable. Through a multiple response optimization algorithm provided by the software Design-Expert version 11 and an overlay contour plot of pH and foam expansion, an optimal point of operation and design region were determined for the design solution.
METHODOLOGY
Materials
Concentrated TTO was purchased from Droguerías Juliao S.A. (Barranquilla, Colombia), 70% (w/v) SLS was purchased from Uniquímicos Ltda. (Barranquilla, Colombia) and Johnson's Baby no more tears Shampoo was purchased from Olímpica S.A. (Barranquilla, Colombia).
Experimental protocol
Thirty grams of solutions were prepared as follows. We placed a 100 ml beaker in an OHAUS AV64C balance and weighted it. 70% (w/v) SLS was added to the beaker using a 10 ml syringe and weighted until desired mass was reached. The balance was tare weighted again, and tap water was added with another 10 ml syringe to the beaker and weighted till desired mass was reached. The mixture was then placed in a magnetic stirrer at 80 °C and 300 rpm for 30 minutes till SLS was solubilized entirely, and was left for 30 minutes for the temperature to decrease to ambient conditions (between 20 °C and 23 °C). The beaker was again placed on the balance which was tare weighted, and Shampoo was added and weighted to the desired mass. The balance was tared weighted, and TTO was added to the desired mass. The mixture was then placed in a magnetic stirrer at 500 rpm in ambient temperature for 10 minutes till the solution was thoroughly mixed.
pH measurements were made using Fisher-Scientific Accumet pH-meter. The device was first calibrated with 4.0, 7.0 and 10.0 pH solutions, provided by the manufacturer, to ensure accurate measurements. Five consecutive pH measurements were performed for each solution, and the mean value was registered. The pH-meter bulb was thoroughly rinsed with tap water before and after each measurement was made.
Foam expansion was measured after pH measurements were made. 10 ml of each freshly prepared solution were added to a 100 ml graduated cylinder using a 10 ml pipette previously rinsed with tap water. A glass stopper was inserted on top of the cylinder. The solution was vertically shaken as vigorously as possible for 10 seconds while holding the stopper with one finger. As soon as shaking was finished, the total volume of foam was noted. Three consecutive measurements were made for each solution, and a mean foam volume was recorded. Foam expansion was calculated using equation 1.
Design of experiment (DoE)
The purpose of this work was to find an optimal operating condition in which the solution pH was maintained as close as healthy skin pH, which has been reported as being less than or equal to 5.0 [14]. Besides, in order to maximize Demodex and bacterial eradication and symptom relief in patients with blepharitis, TTO proportion had to be maximized without incurring in a deficient ability to form foam and an increased risk of skin irritation. Therefore, four design factors were selected as ingredients of the solution: Water (A), TTO (B), Baby Shampoo (C) and SLS (D) and two response variables were defined: pH and Foam expansion. According to Myers et al. [16], when the design factors are ingredients or components of a mixture and their proportions are dependent on one another, the appropriate design is a mixture design. In this type of design, the response variables are a function of the proportions of each ingredient and not of the total amount of each ingredient in the mixture. Mixture designs are special cases of response surface designs, being prediction and optimization the main goals of most mixture experiments [17].
In this work, 30 grams solutions were prepared. The sum of the masses in grams of the four factors had to be equal to the former amount. All experimental runs were carried out in lab conditions by the same operator. Ambient temperature varied between 20 °C and 23 °C but wasn't measured during each experimental run. Hence, it was considered a non-controllable nuisance factor. Similarly, relative humidity was not measured and was considered a non-controllable nuisance factor.
While the common mixture experiments allow the construction of lattice designs which permits the exploration of the entire simplex region, the nature of some experiments restrict it by putting multiple constraints on the component proportions [18]. Quite often, one is faced with upper and lower bounds for every component. These constraints are usually determined by reasonable bounds on the relative proportion of components that produce useable results [16]. Such was the case of the mixture design proposed in this document. Table 1 shows the constraints placed for each component of the mixture formulation. The sum of the proportions of the components in each formulation had to be equal to 1.
Table 1 Component proportion constraints for the defined mixture formulation.
| Lower bound (Li) | Component | Upper bound (Ui) | ||
|---|---|---|---|---|
| 0.600 | ≤ | A: water | ≤ | 0.750 |
| 0.010 | ≤ | B: TTO | ≤ | 0.100 |
| 0.050 | ≤ | C: shampoo | ≤ | 0.200 |
| 0.010 | ≤ | D: SLS | ≤ | 0.120 |
| A+B+C+D | = | 1.000 |
TTO: tea tree oil; SLS: sodium lauryl sulfate.
TTO ratio was defined based on previous experiments which showed that higher ratios increased solution viscosity and required higher surfactant proportion for emulsion formation and foam production. In addition, previous studies have reported notable skin irritation following application of 50% TTO lid scrubs for ocular Demodex eradication [11, 19]. TTO contact allergy has also been reported in patch tests with as little as 5% oxidized TTO [20]. Lee et al. [21] have suggested that TTO should be used at less than 10% for acne treatment to prevent skin irritation. For these reasons, the proportion of TTO was left between 1% and 10% of total solution mass.
Previous studies showed that baby shampoo could be used for skin pH stabilization, emulsion and foam formation, increasing wetting ability and detergent properties, surface tension reduction and skin protection due to its pH buffering capabilities and other skin care components [22-24]. However, previous experiments showed that a ratio of more than 20% induced higher solution viscosity and did not account for a significant variation in pH or higher foam production. Therefore, shampoo proportion was maintained between 5 and 20%.
SLS proportion was established based on previous studies which deined concentrations of less than 10 % to be an ideal point between foam production and the risk of skin irritation [15]. In addition, various studies have shown that the application of solutions containing 0.5%-10% SLS cause slight to moderate irritation and those with 10% - 30% caused skin corrosion and severe irritation [25, 26]. SLS induced skin irritation is caused by its capability to reduce surface tension. However, its ability for altering the stratum corneum, the outermost layer of the epidermis, makes it useful to enhance penetration of other substances in patch tests and animal assays [27]. For these reasons, a range between 0.1% and 12% was found adequate for improving foam formation and TTO penetration and not massively increasing the risk of skin irritation and dryness.
Tap water was found to be needed in at least a 60% proportion of the mixture formulation for ensuring adequate solubility of components, emulsion formation, and foam production. The higher bound of 75% was defined considering the proportion of the other components, which had to be present in at least their lower bound in every solution.
To check the consistency of each constraint and see if every upper and lower bound was attainable, a defined number of inequalities needed to be satisfied [18]. Equation 2 shows the conditions that were evaluated for the definition of adequate bounds.
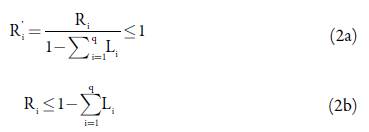
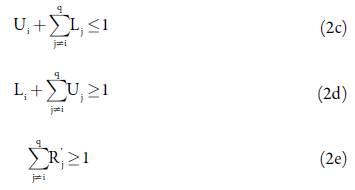
Table 2 shows the result for the left side of each inequality of equation 2 using the specified component constraints. Since all the inequalities were met, every component constraint was attainable.
Table 2 Consistency checking of upper and lower bound constraints.
| Component | Li | Ui | Ri | 2a | 2b(≤0.33) | 2c | 2d | 2e |
|---|---|---|---|---|---|---|---|---|
| Water | 0.6 | 0.75 | 0.15 | 0.45 | 0.15 | 0.82 | 1.02 | 1.06 |
| TTO | 0.01 | 0.1 | 0.09 | 0.27 | 0.09 | 0.76 | 1.08 | 1.24 |
| Shampoo | 0.05 | 0.2 | 0.15 | 0.45 | 0.15 | 0.82 | 1.02 | 1.06 |
| SLS | 0.01 | 0.12 | 0.11 | 0.33 | 0.11 | 0.78 | 1.06 | 1.18 |
TTO: tea tree oil; SLS: sodium lauryl sulfate.
Two response variables were evaluated for each mixture: pH of the solution and foam expansion. Both were measured following the experimental protocol defined in section 2.2. Foam expansion was obtained using equation 1.
As the defined components have both lower and upper constraints (see table 1), the feasible mixture region was not a simplex. Therefore, standard simplex-type mixture designs could not be used. As stated by Myers et al. [16], when both upper and lower bound constraints are present in a mixture experiment, the feasible design space is an irregular hyper polytope, and a computer-generated design should be used in the experiment. They suggested that either an I-optimal or a D-optimal design is appropriate, but also noted that an extreme vertices design could be used in such situations. Nevertheless, an adequate I-optimal or D-optimal design is superior to the extreme vertices design when comparing prediction variance performance using the fraction of the design space plot (FDS) [16].
In this work, an I-optimal design was created using the software Design-Expert version 11. I-optimality criteria was favored over D-optimality for the following reasons: The I-optimal algorithm chooses runs that minimize the average scaled prediction variance across the region of experimentation, while the D-optimal algorithm chooses runs that maximize the determinant of the information matrix (X'X), and, in doing so, minimize the volume of the confidence ellipsoid about the unknown model parameters [17]. I-optimal criteria are desirable for response surface method designs (RSM) when the goal is to optimize prediction capability, requiring greater precision in the estimated model. In contrast, the D-optimal criteria are recommended to build factorial designs where the goal is to find factors relevant to the process. Hence, if good prediction in the design region is the primary goal of the experiment, then I-optimal designs generally have better overall performance [16]. The decision of not doing an initial mixture screening design relied upon the fact that only four design factors were deemed significant in the response variables analyzed. Furthermore, there were no constraints in time and resources, since the deined components, their ranges and associated costs and lab access permitted the execution of an experiment aimed at optimization and prediction.
The I-optimal RSM mixture design chosen for this work was defined based on the criteria established by Myers et al. [16] for selecting a RSM design. Among the recommendations, if resources permit, one must always choose the highest degree order model and run between 8 to 10 additional runs. If the experimenter designs the experiment without some additional points and the chosen model is inadequate, then a problem arises. Half of these additional runs should be replicates of some points in the design and the other chosen as new distinct points so that the lack of fit of the model can be investigated.
The design chosen was fitted to a special cubic model requiring 14 model points, with ive replicate points, ive lack of it points and one additional model point, giving a total of 25 experimental runs which were randomly executed. Equation 3 shows the Scheffe special cubic mixture model used in the mixture experiment.
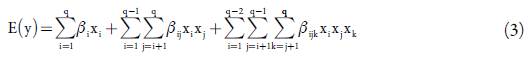
Where q is equal to the number of components in the mixture (four in this case). This design allowed the sequential construction of models of increasing order (linear, quadratic and special cubic) for adequate model fitting and was cost-effective, considering the initial assumptions regarding experimental costs. In addition, it provided good model parameter estimates, an estimate of the pure experimental error and gave sufficient information for making a lack of fit test.
The computer-generated I-optimal design was chosen based on comparing the values of three optimality criteria for different I-optimal designs: Average variance mean, G efficiency and I value. Average prediction variance and I value are measures of I-optimality. I value is particularly useful in comparing I-optimality of designs with an equal number of runs. Thus, lower values of both indicate a better ability to minimize the integral of the prediction variance across the factor space and better optimization of the factor settings [16]. G efficiency seeks to minimize the maximum predicted variance across the entire design space and, particularly, at the edges of it. Hence, a high G-efficiency means that the design is protected against the worst-case prediction variance, allowing it to predict new response values anywhere in the design region with a minimized maximum standard error [16]. For these reasons, to increase design optimality, average variance and I value needed to be minimized, and G efficiency needed to be maximized.
Statistical Analysis
Statistical analysis was done in the software Design-Expert version 11. Initially, a type I sequential model sum of squares was performed together with a lack of fit test to determine the highest order polynomial that adequately fitted each response variable. Afterward, an analysis of variance (ANOVA) was performed for each response variable, where non-significant factors were excluded from it. We graphically and analytically assessed the assumptions of normality, homoscedasticity, and independence of residuals to establish statistical validity. All statistical tests were considered significant with a p-value lower than 0.05. Contour plots were also created to analyze response behavior along the region of experimentation.
A regression model was obtained for each response variable. Model suitability was established considering global model significance, coefficients significance and analysis of the structure of residuals. Multiple response optimization was carried out using the regression models obtained for each response variable. From it, an optimal point of operation for the formulation was found, and a design region was determined. Optimization criteria consisted of maintaining a mixture pH lower than to 5.2 and higher than 4.8 while maximizing TTO proportion and maintaining a value of foam expansion higher than 1.9.
RESULTS AND DISCUSSION
Choice of I-optimal design
Table 3 shows the results after changing parameters of both coordinate and point exchange search algorithms in Design-Expert version 11 to generate different I-optimal designs. Design number 3 was chosen among the six designs created since it showed the lowest values in average prediction variance and I value, and the highest G efficiency.
Table 3 Comparison of different optimality criteria for six I-optimal designs.
| Design | Search algorithm | Average variance | G efficiency | I |
|---|---|---|---|---|
| (1) | Coordinate exchange | 0.3165 | 43.7 | 0.3171 |
| (2) | Coordinate exchange | 0.3449 | 27.01 | 0.3455 |
| (3) | Coordinate exchange | 0.3058 | 46.13 | 0.3074 |
| (4) | Point exchange | 0.3276 | 45.73 | 0.3256 |
| (5) | Point exchange | 0.3294 | 42.11 | 0.3293 |
| (6) | Point exchange | 0.3277 | 25.77 | 0.3256 |
Design of experiment (DoE)
Table 4 shows the results obtained for pH and Foam expansion on each experimental run. Table 5 shows the mass amounts of each mixture component for obtaining 30 g solutions.
Table 4 I-optimal design results.
| Components | Response variables | ||||||
| Run | A: water | B: TTO | C: shampoo | D: SLS | Total | pH | Foam expansion |
| 1 | 0.684 | 0.052 | 0.145 | 0.120 | 1.00 | 5.34 | 2.47 |
| 2 | 0.646 | 0.054 | 0.184 | 0.116 | 1.00 | 5.19 | 2.27 |
| 3 | 0.684 | 0.052 | 0.145 | 0.120 | 1.00 | 5.31 | 2.33 |
| 4 | 0.750 | 0.088 | 0.050 | 0.113 | 1.00 | 5.79 | 1.97 |
| 5 | 0.750 | 0.040 | 0.200 | 0.010 | 1.00 | 4.71 | 1.33 |
| 6 | 0.750 | 0.100 | 0.077 | 0.073 | 1.00 | 5.43 | 2.07 |
| 7 | 0.726 | 0.057 | 0.174 | 0.042 | 1.00 | 5.01 | 1.73 |
| 8 | 0.750 | 0.100 | 0.113 | 0.037 | 1.00 | 5.1 | 1.87 |
| 9 | 0.731 | 0.010 | 0.178 | 0.081 | 1.00 | 5.09 | 3.67 |
| 10 | 0.731 | 0.010 | 0.178 | 0.081 | 1.00 | 5.08 | 3.50 |
| 11 | 0.750 | 0.051 | 0.138 | 0.061 | 1.00 | 5.05 | 2.07 |
| 12 | 0.632 | 0.100 | 0.167 | 0.101 | 1.00 | 5.22 | 1.43 |
| 13 | 0.711 | 0.076 | 0.095 | 0.119 | 1.00 | 5.51 | 1.73 |
| 14 | 0.711 | 0.094 | 0.184 | 0.010 | 1.00 | 4.96 | 1.40 |
| 15 | 0.695 | 0.100 | 0.139 | 0.066 | 1.00 | 5.19 | 1.77 |
| Run | A: water | B: TTO | C: shampoo | D: SLS | Total | pH | Foam expansion |
| 16 | 0.641 | 0.100 | 0.200 | 0.059 | 1.00 | 5.08 | 1.43 |
| 17 | 0.659 | 0.100 | 0.121 | 0.120 | 1.00 | 5.38 | 1.33 |
| 18 | 0.695 | 0.100 | 0.139 | 0.066 | 1.00 | 5.12 | 1.87 |
| 19 | 0.670 | 0.010 | 0.200 | 0.120 | 1.00 | 5.17 | 3.33 |
| 20 | 0.750 | 0.051 | 0.138 | 0.061 | 1.00 | 5.08 | 1.97 |
| 21 | 0.700 | 0.064 | 0.152 | 0.083 | 1.00 | 5.2 | 1.87 |
| 22 | 0.750 | 0.018 | 0.112 | 0.120 | 1.00 | 5.41 | 3.77 |
| 23 | 0.684 | 0.052 | 0.200 | 0.064 | 1.00 | 4.98 | 1.93 |
| 24 | 0.600 | 0.080 | 0.200 | 0.120 | 1.00 | 5.2 | 1.73 |
| 25 | 0.684 | 0.052 | 0.200 | 0.064 | 1.00 | 4.99 | 1.87 |
TTO: tea tree oil; SLS: sodium lauryl sulfate.
Table 5 Masses of each component per experimental run for 30 g solutions.
| Run | Water (g) | TTO (g) | Shampoo (g) | SLS 70% (w/v) (g) | Total mass (g) |
|---|---|---|---|---|---|
| 1 | 18.976 | 1.545 | 4.336 | 5.143 | 30.00 |
| 2 | 17.869 | 1.626 | 5.516 | 4.990 | 30.00 |
| 3 | 18.976 | 1.545 | 4.336 | 5.143 | 30.00 |
| 4 | 21.052 | 2.625 | 1.500 | 4.823 | 30.00 |
| 5 | 22.371 | 1.200 | 6.000 | 0.429 | 30.00 |
| 6 | 21.563 | 3.000 | 2.315 | 3.122 | 30.00 |
| 7 | 21.247 | 1.703 | 5.234 | 1.816 | 30.00 |
| 8 | 22.026 | 3.000 | 3.394 | 1.580 | 30.00 |
| 9 | 20.894 | 0.300 | 5.343 | 3.463 | 30.00 |
| 10 | 20.894 | 0.300 | 5.343 | 3.463 | 30.00 |
| 11 | 21.712 | 1.529 | 4.132 | 2.627 | 30.00 |
| 12 | 17.650 | 3.000 | 5.021 | 4.329 | 30.00 |
| 13 | 19.804 | 2.274 | 2.840 | 5.081 | 30.00 |
| 14 | 21.216 | 2.825 | 5.530 | 0.429 | 30.00 |
| 15 | 19.999 | 3.000 | 4.156 | 2.845 | 30.00 |
| 16 | 18.451 | 3.000 | 6.000 | 2.549 | 30.00 |
| 17 | 18.215 | 3.000 | 3.642 | 5.143 | 30.00 |
| 18 | 19.999 | 3.000 | 4.156 | 2.845 | 30.00 |
| 19 | 18.557 | 0.300 | 6.000 | 5.143 | 30.00 |
| 20 | 21.712 | 1.529 | 4.132 | 2.627 | 30.00 |
| 21 | 19.936 | 1.934 | 4.571 | 3.560 | 30.00 |
| 22 | 20.957 | 0.548 | 3.353 | 5.143 | 30.00 |
| 23 | 19.694 | 1.547 | 6.000 | 2.759 | 30.00 |
| 24 | 16.457 | 2.400 | 6.000 | 5.143 | 30.00 |
| 25 | 19.694 | 1.547 | 6.000 | 2.759 | 30.00 |
TTO: tea tree oil; SLS: sodium lauryl sulfate.
Statistical analysis of pH
Model definition
Table 6 shows the type I sequential model sum of squares for pH. It is clear that both the quadratic and special cubic model have significant coefficients when compared to the adjacent lower order models. Table 7 shows the model summary statistics for pH. Here it can be seen that both quadratic and special cubic models have the highest values of R2 statistics and the lowest press. Table 8 shows lack of fit test performed to each model for pH. Lack of fit must be insignificant. That was the case for both quadratic and special cubic models.
Table 6 Type I sequential model sum of squares for pH. In bold are the models most appropriate for fitting pH.
| Source of variation | Sum of squares | Degrees of freedom | Mean square | F0 | P-Value |
|---|---|---|---|---|---|
| Mean | 671.743 | 1 | 671.743 | ||
| Linear | 1.03567 | 3 | 0.34522 | 85.38 | 0.0000 |
| Quadratic | 0.06135 | 6 | 0.01022 | 6.51 | 0.0015 |
| Special cubic | 0.01649 | 4 | 0.00412 | 6.43 | 0.0064 |
| Cubic | 0.00360 | 6 | 0.00060 | 0.87 | 0.5721 |
| Residual | 0.00345 | 5 | 0.00069 | ||
| Total | 672.863 | 25 | 26.91 |
Table 7 Model summary statistics for pH.
| Source ofvariation | Standard error | R2 | Adjusted R2 | Predicted R2 | PRESS |
|---|---|---|---|---|---|
| Linear | 0.0636 | 0.9242 | 0.9134 | 0.8767 | 0.1382 |
| Quadratic | 0.0396 | 0.9790 | 0.9664 | 0.9010 | 0.1110 |
| Special Cubic | 0.0253 | 0.9937 | 0.9863 | 0.8780 | 0.1367 |
| Cubic | 0.0263 | 0.9969 | 0.9852 | * |
Table 8 Model lack of fit test for pH.
| Source of variation | Sum of squares | Degrees of freedom | Mean square | F0 | P-Value |
|---|---|---|---|---|---|
| Linear | 0.0815 | 16 | 0.0051 | 7.38 | 0.0184 |
| Quadratic | 0.0201 | 10 | 0.0020 | 2.91 | 0.1247 |
| Special cubic | 0.0036 | 6 | 0.0006 | 0.8704 | 0.5721 |
| Cubic | 0.0000 | 0 |
As a general rule, one must choose the highest order polynomial that has signiicant coefficients and insignificant lack of fit. Therefore, the special cubic model was chosen to model the pH response.
Analysis of variance of Ph
Table 9 shows the ANOVA for pH. Both the global model and all its coefficients are significant. These means that linear factors, second order, and third order interactions have a significant effect on mixture pH.
Checking of assumptions for the ANOVA of pH
Figure 1 shows the normal probability plot of residuals and residual independence plot for pH. The figure shows that residuals followed a normal distribution and were randomly distributed. Figure 2 verified the assumption of homoscedasticity. We found homogeneity of variance for the residuals when plotted against factor levels. Table 10 shows the analytical tests performed to confirm the validity of all the assumptions. All test were insignificant. Thus, the ANOVA obtained for pH had statistical validity.
Table 9 ANOVA for pH.
| Source of variation | Sum of squares | Degrees of freedom | Mean square | F0 | P-Value |
|---|---|---|---|---|---|
| Model | 1.11 | 13 | 0.0857 | 133.58 | <0.0001 |
| Linear mixture | 1.04 | 3 | 0.3452 | 538.37 | <0.0001 |
| AB | 0.0110 | 0.0110 | 17.21 | 0.0016 | |
| AC | 0.0061 | 0.0061 | 9.56 | 0.0103 | |
| AD | 0.0072 | 0.0072 | 11.29 | 0.0064 | |
| BC | 0.0117 | 0.0117 | 18.25 | 0.0013 | |
| BD | 0.0071 | 0.0071 | 11.09 | 0.0067 | |
| CD | 0.0037 | 0.0037 | 5.74 | 0.0355 | |
| ABC | 0.0114 | 0.0114 | 17.71 | 0.0015 | |
| ABD | 0.0056 | 0.0056 | 8.74 | 0.0131 | |
| ACD | 0.0035 | 0.0035 | 5.49 | 0.0389 | |
| BCD | 0.0104 | 0.0104 | 16.20 | 0.0020 | |
| Residual | 0.0071 | 11 | 0.0006 | ||
| Lack of fit | 0.0036 | 6 | 0.0006 | 0.8704 | 0.5721 |
| Pure error | 0.0035 | 5 | 0.0007 | ||
| Total | 1.12 | 24 |
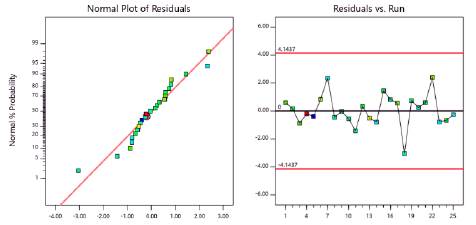
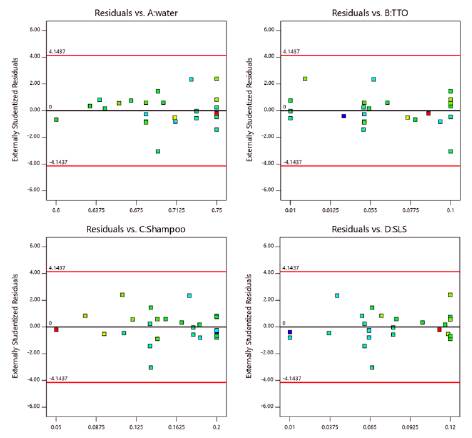
Table 10 Analytical test of normality of residuals (Shapiro-Wilk test), homoscedasticity of residuals (Levene's test), and residuals independence (Durbin-Watson test) for pH.
| Test | Statistic | P-Value |
|---|---|---|
| Shapiro-Wilk | 0.9625 | 0.4798 |
| Levene's A | 0.7445 | 0.7053 |
| Levene's B | 1.3175 | 0.3273 |
| Levene's C | 0.7114 | 0.7310 |
| Levene's D | 2.8172 | 0.0526 |
| Durbin-Watson | 1.9291 | 0.4318 |
RSM analysis T3
The regression model obtained for pH in L_Pseudo Components was:
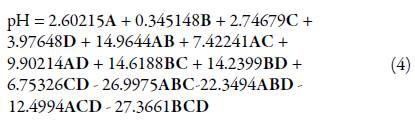
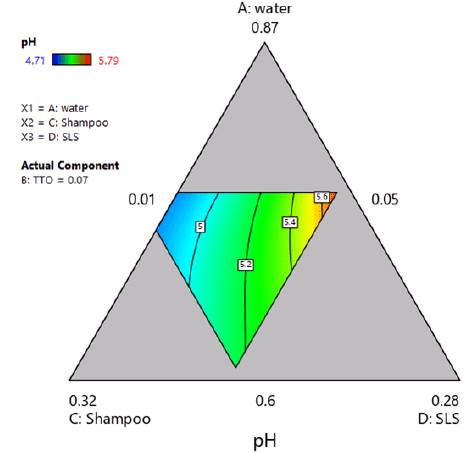
Since the model and all its coefficients were found significant (see table 9), and no structure was found in the residuals (see Figure 2), the regression model was considered suitable for modeling pH. Figure 3 shows a contour plot of pH with TTO proportion equal to 0.07. This scenario was considered important since one of the aims of this work was to maximize TTO ratio while maintaining an adequate pH value. From the figure, it was inferred that higher ratios of shampoo decreased pH while higher ratios of SLS increased it.
Statistical analysis of foam expansion
Model definition T3
Table 11 shows the type I sequential model sum of squares for foam expansion. Table 12 shows the model summary statistics for foam expansion. Table 13 shows lack of fit test performed to each model for foam expansion. Only the special cubic model has insignificant lack of fit and significant type I sequential sum of squares. Consequently, the special cubic model was chosen for modeling foam expansion.
Table 11 Type I sequential model sum of squares for foam expansion. In bold are the models most appropriate for fitting foam expansion.
| Source ofvariation | Sum of squares | Degrees of freedom | Mean square | F 0 | P-Value |
|---|---|---|---|---|---|
| Mean | 111.09 | 1 | 111.09 | ||
| Linear | 9.05 | 3 | 3.02 | 19.63 | <0.0001 |
| Quadratic | 2.78 | 6 | 0.4625 | 15.32 | <0.0001 |
| Special cubic | 0.2668 | 4 | 0.0667 | 3.95 | 0.0317 |
| Cubic | 0.1509 | 6 | 0.0252 | 3.59 | 0.0909 |
| Residual | 0.0350 | 5 | 0.0070 | ||
| Total | 123.37 | 25 | 4.93 |
Table 12 Model summary statistics for foam expansion.
| Source of variation | Standard error | R2 | Adjusted R2 | Predicted R2 | Press |
|---|---|---|---|---|---|
| Linear | 0.3921 | 0.7372 | 0.6996 | 0.6021 | 4.89 |
| Quadratic | 0.1737 | 0.9631 | 0.9410 | 0.8344 | 2.03 |
| Special cubic | 0.1300 | 0.9849 | 0.9670 | 0.7188 | 3.45 |
| Cubic | 0.0837 | 0.9971 | 0.9863 | * |
Analysis of variance of foam expansion
Table 14 shows the ANOVA for foam expansion. Non-significant model terms were excluded from the special cubic model. Model global significance analysis was significant. Similarly, all the model coefficients were found significant. These means that the linear mixture and AB, AC, AD, CD, ABC, ABD, and ACD interactions had a significant effect on mixture foam expansion.
Table 14 ANOVA for foam expansion.
| Source of variation | Sum of squares | Degrees of freedom | Mean square | F 0 | P-Value |
|---|---|---|---|---|---|
| Model | 12.06 | 10 | 1.21 | 77.27 | <0.0001 |
| Linear mixture | 9.05 | 3 | 3.02 | 193.32 | <0.0001 |
| AB | 0.5456 | 0.5456 | 34.95 | <0.0001 | |
| AC | 0.2383 | 0.2383 | 15.27 | 0.0016 | |
| AD | 0.3963 | 0.3963 | 25.39 | 0.0002 | |
| CD | 0.1517 | 0.1517 | 9.72 | 0.0076 | |
| ABC | 0.7320 | 0.7320 | 46.90 | <0.0001 | |
| ABD | 1.23 | 1.23 | 78.83 | <0.0001 | |
| ACD | 0.0904 | 0.0904 | 5.79 | 0.0305 | |
| Residual | 0.2185 | 14 | 0.0156 | ||
| Lack of it | 0.1835 | 9 | 0.0204 | 2.91 | 0.1258 |
| Pure error | 0.0350 | 5 | 0.0070 | ||
| Total | 12.28 | 24 |
Checking of assumptions for the ANOVA of foam expansion
Figure 4 shows the normal probability plot of residuals and residual independence plot for foam expansion. Residuals followed a normal distribution and were randomly distributed. Figure 5 verified the assumption of homoscedasticity. We found homogeneity of variance for the residuals when plotted against factor levels. Table 15 shows the analytical tests performed to confirm the validity of all the assumptions. All test were insignificant. Thus, the ANOVA obtained for foam expansion had statistical validity.
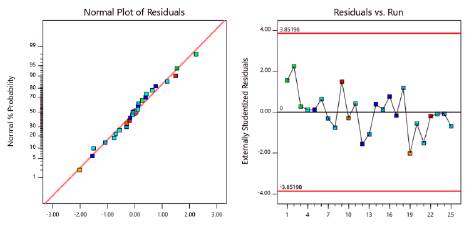
Figure 4 Normal probability plot of residuals and residuals versus run order plot for foam expansion.
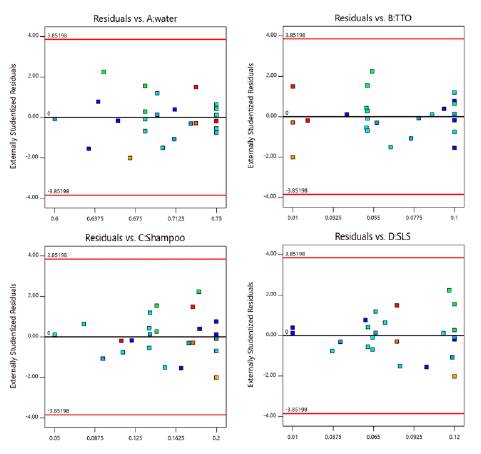
Table 15 Analytical test of normality of residuals (Shapiro-Wilk test), homoscedasticity of residuals (Levene's test), and residuals independence (Durbin-Watson test) for foam expansion.
| Test | Statistic | P-Value |
|---|---|---|
| Shapiro-Wilk | 0.9678 | 0.5991 |
| Levene's A | 0.4120 | 0.9378 |
| Levene's B | 2.5442 | 0.0646 |
| Levene's C | 0.4081 | 0.9398 |
| Levene's D | 1.1533 | 0.4190 |
| Durbin-Watson | 1.5002 | 0.1091 |
RSM analysis
The regression model obtained for foam expansion in L_Pseudo Components was:
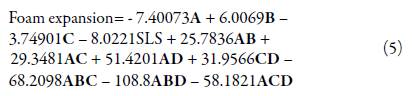
Considering that the model and all its coefficients were significant (see table 14), and there was no structure in the residuals (see figure 5), the regression model was found suitable for modeling foam expansion. Similar to section 3.3.4, figure 6 shows a contour plot of foam expansion with TTO proportion equal to 0.07. From the plot, it can be concluded that the high ratio of TTO substantially affected the ability of the mixture to form foam, since the available foam expansion range was reduced to values between 1.3 and 2.2 in the region of experimentation. Besides, it was found that SLS tended to increase foam expansion while shampoo ratio had a lowering effect on it.
RSM discussion
From the results above, it was found that there were significant linear, second and third order interactions between the chosen factors concerning their effect on pH and foam formation. TTO concentration greatly influenced foam expansion and pH leveling. We found that higher SLS values could have been employed to obtain higher foaming capabilities. However, this entailed the cost of increasing the risk of skin irritation and dryness given its effect on solution pH and surface tension. Shampoo was used to control pH by its buffering capabilities. However, its high viscosity and lack of sufficient surfactant composition made it unsuitable to act as a lone emulsifier of TTO and foaming agent. Water concentration also played a crucial role in the solution. Lower water ratios were correlated to less foam expansion when higher ratios of shampoo were used. Higher ratios of water with higher ratios of SLS increased foam expansion, but also induce higher pH values, reducing its suitability for topical eyelid application.
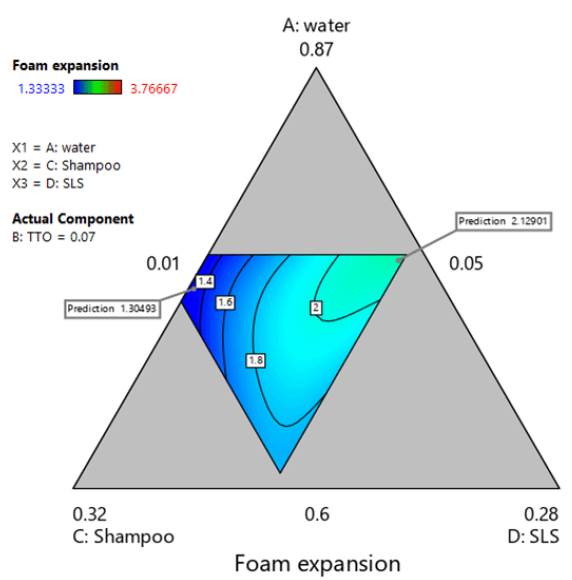
Figure 6 Contour plot of foam expansion with TTO proportion equal to 0.07. Multiple response optimization
Ideally, the optimal mixture would have been the one with a pH equal to 5, foam expansion greater than 3 and TTO ratio equal to 0.1. However, compromises in every aspect had to be made to find a suitable but not ideal mixture. Multiple numerical optimization runs were made to obtain the ideal mixture. It was found that there were no optimal solutions which accomplished the desirable responses and TTO ratio. Hence, an optimization criterion was established, which allowed the search of a mixture formulation that was as close as possible to the ideal one. Table 16 shows the optimization criteria used.
Table 16 Optimization criteria for desired solution.
| Lower bound (Li) | Component | Upper bound (Ui) | ||
|---|---|---|---|---|
| 0.60 | ≤ | A: water | ≤ | 0.75 |
| 0.07 | ≤ | B: TTO | ≤ | 0.10 |
| 0.05 | ≤ | C: shampoo | ≤ | 0.20 |
| 0.01 | ≤ | D: SLS | ≤ | 0.12 |
| 4.8 | ≤ | pH | ≤ | 5.3 |
| 1.95 | ≤ | Foam expansion | ≤ | 3.7667 |
We chose the TTO ratio to lie between 7% and 10% to obtain an optimal effect on Demodex and bacterial eradication. In addition, pH value was considered suitable if it was lower than 5.3 and higher than 4.8. These criteria were established considering that skin exposure time to the optimized solution would be less than 30 seconds. Hence, even though pH might be slightly above or below the recommended value, its effect would not be severely detrimental to skin health in such a short time. Foam expansion was established to be a minimum of 1.90. This value was found to be sufficient for foam to be formed when testing the solution with a foam pump sprayer commonly used for application of these type of solutions. All the other components criteria corresponded to the ranges defined for them in table 1.
Figure 7 shows an overlay contour plot of pH and foam expansion considering the defined optimization criteria and a TTO ratio constant and equal to 0.07. The figure also shows the optimal design region in yellow, which is relatively big enough for withstanding small variations in component proportions.
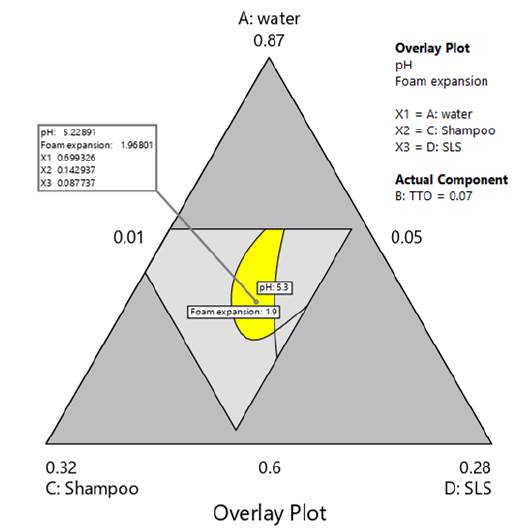
Figure 7 Overlay plot of pH and foam expansion, with TTO ratio equal to 0.07. The region in yellow corresponds to the identified design region.
Table 17 shows the optimized formulation obtained using the optimization algorithm provided by the software Design-Expert version 11. The table also shows the masses of each component for preparing an 80 g solution and the total cost associated for preparing it. This total mass is chosen since it is the common one found on commercial eyelid cleaning solutions. As can be seen, the optimized solution cost less than 2 USD. Commercial foaming solutions containing TTO in unknown concentrations have prices of at least 20 USD. Therefore, the proposed alternative is cost-effective for a treatment that is considered indefinite in patients with blepharitis.
Table 17 Optimized formulation for 80 g solution.
| Component | Proportion | Mass (g) | Price per gram (USD) | Total price (USD) |
|---|---|---|---|---|
| A: water | 0.699326 | 55.94608 | <0.00002 | 0.000112 |
| B: TTO | 0.07 | 5.6 | 0.3 | 1.68 |
| C: shampoo | 0.142937 | 11.43496 | 0.016 | 0.182959 |
| D: SLS | 0.087737 | 7.01896 | 0.002 | 0.014038 |
| Total | 1.877109 | |||
| pH | 5.22891 | |||
| Foam expansion | 1.96801 | |||
CONCLUSIONS
This work proposes a low-cost eyelid cleaning foaming solution for symptom management in patients with blepharitis. An optimized formulation of water, TTO, Baby shampoo, and SLS was found by performing a four-component mixture I-optimal design of experiment. To our knowledge, this is the first study which establishes adequate concentrations of active compounds as a DIY solution. Statistical analysis showed the presence of significant linear, second and third order interactions between components, which together defined regions of high and low pH and foam expansion values.
TTO was found to induce low foam expansion and, even though it by itself did not alter to a significant degree the solution pH, its interaction with the other components was determinant in the definition of an adequate design region where optimal pH and foam expansion values could be obtained. SLS and shampoo performed antagonistic roles in the formulation. The first tended to increase foam expansion and pH values, while the former decreased pH but didn't necessarily promote foam expansion to a high degree when high TTO ratios were also present. Through the use of both numerical and graphical optimization methods, an optimal design region was found, and an optimal formulation was determined. The obtained formulation contained a significant ratio of TTO and resulted in suitable pH and foam expansion values. The low cost and ease of preparation of the formulation make it an affordable, effective alternative in the treatment of both anterior and posterior chronic blepharitis.

