


 English (pdf)
 Article in xml format
 Article references
 Send this article by e-mail
 Cited by SciELO
  Cited by Google
  Similars in
SciELO
Similars in
SciELO  Similars in Google
 Permalink
INTRODUCTION
Pharmaceutical development requires knowledge of the physicochemical properties of drugs, pharmaceutical products, and excipients to meet quality control requirements [1]. In addition to the specifications of content, identity, purity, efficacy, and safety, it is also important that the drug be adequately released to meet the therapeutic objective. Thus, biopharmacotechnical aspects are fundamental for pre-formulation studies, especially those related to physicochemical properties, drug dissolution (factors related to the drug, the reaction medium, the excipients and the manufacturing technique used), intestinal permeability and drug absorption [2-4].
Furthermore, on tests and dissolution profiles, other techniques have been highlighted in the pharmaceutical sciences, in order to know the factors related to drugs and excipients, which directly interfere with the finished product and its therapeutic effects [5]. These tests aim to characterize the samples analyzed for the presence of polymorphisms, drug and formulation thermal stability, morphology, particle size, among others. Thus, the techniques of thermal analysis, such as thermogravimetry (TG) and differential thermal analysis (DTA) [6-9] stand out, as well as spectroscopic techniques, such as X-ray diffraction (XRD) [10, 11], infrared spectrometry (IR) [12] and molecular absorption spectrophotometry in the ultraviolet and visible light region (UV-Vis) [13, 14], besides scanning electron microscopy (SEM) [15,16].
Another relevant tool used mainly in prefabrication studies, is the biopharmaceutical classification system (BCS), which groups drugs by biological membranes according to aqueous solubility and permeability [17, 18]. Low solubility drugs (class II and IV) may present release problems of the pharmaceutical form and bioavailability and therefore need to be meticulously characterized from a physicochemical point of view [19]. BCS, along with dissolution studies, has been beneficial to the pharmaceutical industry and regulatory agencies in many countries, as a scientific approach that allows bioavailability testing for bioequivalence and bioavailability testing of solid oral immediate release pharmaceutical forms. Thus, there is a great impact on cost reduction in the development and testing of new drugs [20, 21].
Low solubility drugs include furosemide (FUR), hydrochlorothiazide (HCT) and nifedipine (NIF), used worldwide in antihypertensive therapy. In Brazil, they are included in the National list of essential medicines (RENAME) and the industry makes numerous pharmaceutical alternatives available to consumers and health professionals, such as generic and similar drugs, as well as those manipulated with presentations in individualized dosages, making it necessary to monitor the quality of these drugs marketed in the country [22-25].
Despite being poorly soluble drugs, some studies in Brazil have shown very rapid dissolution (over 85% of the drug within 15 minutes) for medicines containing furosemide (40 mg), hydrochlorothiazide (25 mg) and nifedipine (10 mg) [26, 27]. Hence, the objectives of this study were to evaluate the physicochemical properties of low solubility drugs (furosemide, hydrochlorothiazide and nifedipine) by TG, DTA, XRD, IR, UV-Vis and SEM techniques, and to evaluate the dissolution of oral solid pharmaceutical forms (tablets and capsules) containing FUR, HCTZ and NIF marketed in Salvador, Bahia, Brazil.
MATERIALS AND METHODS
Standards and samples
Reference standards of FUR from the United States Pharmacopeia (USP) (denominated FURP1) were acquired from Sigma Aldrich (St Louis, MO, USA) and those from the Brazilian Pharmacopeia (denominated FURP2) were acquired from the National Institute for Quality Control in Health-INCQS (Fiocruz, Rio de Janeiro, Brazil), respectively. Reference standards of HCT (HCTZP) and NIF (NIFP) from the Brazilian Pharmacopeia were acquired from the National Institute for Quality Control in Health-INCQS (Fiocruz, Rio de Janeiro, Brazil), respectively. Secondary standards (named as FURA; HCTZA and NIFA), were donated by Pharmacia Bioethica® from Salvador, Bahia, Brazil for physicochemical characterization analyses.
Medicine samples,furosemide (40 mg) and hydrochlorothiazide (25 mg) tablets-reference (R), similar (S) and generic (G) and Nifedipine (10 mg) capsules-reference (R) and compounded (C) were purchased from drugstores in Salvador, Bahia, Brazil.
Chemicals
All reagents were of analytical grade. Doubly distilled water was obtained from a Q341 Quimis distiller (São Paulo, SP, Brazil) and used throughout the experiments. Hydrochloric acid (HCl), sodium chloride, monobasic dihydrogen phosphate and dibasic monohydrogen phosphate were purchased from Quimex (Merck, São Paulo, SP, Brazil) and used as the dissolution media for the dissolution tests. Lactose, micro-crystalline cellulose, hydroxypropyl cellulose, polyvinylpyrrolidone (PVP), magnesium stearate was donated by Pharmacia Bioethica® (Bahia, Brazil).
Equipments
Thermal analyses (TG and DTA) were investigated using differential thermal analysis (DTG-60, Shimadzu®, Japan), with alumina crucible (approximately 8 mg of sample) at a heating rate of10 °C min-1, under a nitrogen flow rate of 50 mL min-1 and thermal range of25-900 °C. XRD analyses were performed in a diffractometer (XRD 6000 Shimadzu®, Japan) using a Cu-Kα radiation tube (40 kV, 30 mA). The samples were analyzed at scanning angles of 10 - 80° (2θ) in a step of 2.0° (2θ) min-1. Fourier transform infrared spectroscopy (FTIR) by the ATR method was used, with an FTIR 100S Spectrometer (PerkinElmer®, Waltham, MA, USA), operating between 4000 and 400 cm-1, with a resolution of 4 cm-1, using the KBr pellet method (approximately 5 mg of sample). SEM images were obtained at magnifications of 200 and 500x, using a JEOL JSM-6390-LV microscope (JEOL, Ltd., Akishima, Tokyo, Japan) with an acceleration of tension at 5 kV, using carbon tape to fix materials in the carrier. The sample was vacuum metallized with gold deposition on them to improve microscope viewing. For all tests, the results were analyzed, and graphs were plotted by the OriginPro 8® software.
The evaluation of physical (weight uniformity, friability, and disintegration) and physicochemical (dissolution) tests was performed in accordance with the Brazilian and the United States Pharmacopoeia general methods [25, 28]. Weight variation was obtained on an electronic balance (Mark, M164-AI, Piracicaba, SP, Brazil). The friability tester was an HX 300-2 Ethik (Vargem Grande Paulista, SP, Brazil). The disintegration analyses were carried out on a 301/AC 01 Nova Ética system (Vargem Grande Paulista, SP, Brazil). The dissolution analysis was carried out on a multi-bath (n= 6) dissolution test apparatus 299 Ethik (Vargem Grande Paulista, SP, Brazil). All spectrophotometric measurements were carried out using a 1240 Shimadzu (Kyoto, Japan) UV-Vis spectrophotometer (190-1100 nm) equipped with a diode array detector. The absorbances of sample solutions were read in 1-cm quartz cells. The detector was set at 271, 272 and 340 nm for FUR, HCT and NIF, respectively.
Preparation of reference solutions and dissolution studies
Stock standard solutions of furosemide, hydrochlorothiazide and nifedipine (500 µg mL-1) were prepared in phosphate buffer (pH 5.8), 0.1 mol L-1 HCl and simulated gastric fluid without pepsin (pH= 1.0), respectively. Calibration standards with concentrations ranging (in µg mL-1) from 5.0 to 50 (furosemide); 5.0 to 30 (hydrochlorothiazide) and 2.0 to 16 (nifedipine) were prepared daily from the stock standard solution by appropriate dilution and analyzed in triplicate by UV-vis spectrophotometry. Curve equations for each drug were obtained for regression analysis by the least-squares method to calculate the calibration model and the correlation coefficient (r) value.
Dissolution studies were conducted using the Brazilian Pharmacopoeia [25] and the United States Pharmacopoeia [28] general methods (table 1), with six replicates at 37±0.5 °C and 900 mL of dissolution medium.
Table 1 Optimal parameters for dissolution studies offurosemide, hydrochlorothiazide and nifedipine.
| Drug | Dosage/pharmaceutical Form | Dissolution medium | Apparatus | Rotation (rpm) |
|---|---|---|---|---|
| Furosemide | 40-mg/tablets | phosphate buffer (pH 5.8) | 2 (paddle) | 50 |
| Hydrochlorothiazide | 25-mg/tablets | 0.1 mol L-1 HCl | 1 (basket) | 100 |
| Nifedipine | 10 mg/capsules | simulated gastric fluid without pepsin (pH= 1.0) | 1 (basket) | 50 |
In all experiments, aliquots of10 mL were withdrawn at predetermined time intervals (1, 3, 5, 10, 15, 20, 25, 30, 45, and 60 minutes) and replaced with an equal volume of fresh medium to maintain a constant total volume in each vessel, following filtration of dissolution samples using 0.45-µm membrane filters; the concentrations of propranolol were determined by the proposed UV spectrophotometric method. The absorbances were converted to concentrations obtained from the equation on the standard curve. Calculations were performed considering the amount of drug removed in each aliquot. The results were expressed as drug release (%) as a function of time.
Dissolution efficiency (DE) was used to evaluate the product dissolution performance under test conditions. This parameter was obtained from the area under the drug dissolution curve up to 60 minutes (AUC0-t), in relation to 100% of the product label value (AUCTR). DE was expressed as a percentage and can be set by the following equation: AUC0-t/AUCTR x 100, where t is time (min) and TR is the product label value [29]. DE values were statistically analyzed using Student's t-test with a significance level of p < 0.05. The DE results of the tested products were subjected to analysis of variance (Anova) using the Statistical Package for the Social Sciences (SPSS) software (version 22.0, IBM).
Validation of the analytical method
The dissolution test was validated to demonstrate suitability. In Brazil, compendial analytical methods must have their suitability demonstrated for their intended use under laboratory operating conditions by presenting a partial validation study [30]. In this case, partial validation must assess at least the parameters of accuracy, precision, and selectivity. To extend the validation studies, International Conference on Harmonization (ICH) recommendations were used [31]. Thus, analysis of selectivity, linearity, precision (repeatability and intermediate precision), accuracy, limit of detection (LOD) and quantification (LOQ) were performed. Possible interferences were evaluated by testing the components of the formulations and comparing them to a placebo.
RESULTS AND DISCUSSION
Physicochemical characterization
Thermogravimetry is useful for evaluation of stability tests [32], polymorphism [9], and quality control of drugs [1, 33]. Figure 1 shows the results for thermal analysis (TG and DTA/DTG) of FURP1 (figure 1A), FURP2 (figure 1B) and FURA (figure 1C). The decomposition profiles are observed to be similar. All DTG curves showed two initial events for all analyses with very similar loss mass values. The first event (between 204.8 and 232.0 °C; Tpeak at 222.5, 222.6 and 218.9 °C (FURP1, FURP2 and FURA, respectively) exhibits a small mass loss (< 3 %), due to evaporation of volatile compounds. In the second (starting at 233 °C; Tpeak= 277 °C), a mass loss (approximately 69 %) was observed without a definite constant mass event in the TG curves, suggesting other sample degradation events, not determined by the DTG, until the end of the test; 2.58 mg (~30%) residue remaining in the crucible suggest that the total decomposition of furosemide occurs at temperatures above 900 °C in an inert atmosphere (N2).
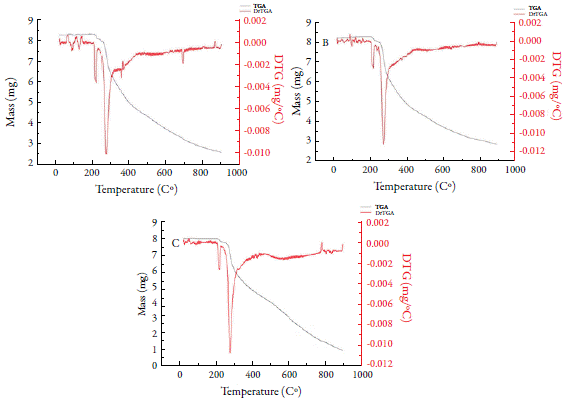
The first decomposition event agrees with Silva et al. in 2013, who determined the first decomposition event, with furosemide water loss occurring between 208 and 240 °C, with a mass loss of 2.8% [7]. However, the authors reported two other events in the temperature range between 240 and 407 °C: the second event, between 240 and 290 °C, with a mass loss of 21.6%, related to the majority loss of 2-methyl-furanyl and furanyl. In addition, a third event (between 294 and 407 °C) with SO2 and CO2 release was observed. Differences between sample decomposition and the literature may be associated with structural and morphological properties, among others.
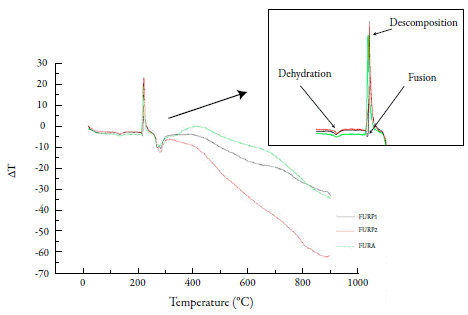
In DTA analysis of furosemide (figure 2), there was a discrete endothermic event occurring at approximately 133 °C. The fusion event of furosemide was only clearly observed in FURP1, evidenced by an endothermic peak at 216.8 °C. For FURP1 and FURA, the fusion occurred together with the first decomposition event (212 °C) and peaked at approximately 222.5 °C. Silva et al. concluded that, in the first decomposition event, with loss of water, there is a condensation reaction of the furosemide molecules, forming dimers, which may be a carboxylic acid anhydride or an amide [7]. Factors such as the presence of polymorphism, mass used in the test, degree of material compaction and particle size may have directly affected the differences observed between FURP1, FURP2 and FURA for thermal analysis.
Thermogravimetric curves (TG/DTG and DTA) for HCTZP (figure 3) showed only a well-delimited degradation event of this drug (between 286.90 and 391.45 °C; Tpeak= 332.30 °C). The mass loss resulting from this event was approximately 46.5% in relation to the initial mass. For HCTZA, there was also a single mass loss event well defined by DTG (between 286.82 and 394.30 °C; Tpeak= 321.11 °C) and mass loss (around 48 %). Souza et al. in 2018 reported three events for HCTZ degradation [34]. The first (between 309.7 and 381.6 °C); the second (381.6 and 531.0 °C) and the third (531.0 and 727.6 °C), with mass losses of 38.1; 26.9 and 34.8%, respectively. Macêdo et al. [35] observed the initiation of drug decomposition at approximately 313.6 °C. DTA curves for Hydrochlorothiazide exhibited two events: the first, defined by an endothermic peak at 270.0 and 270.3 °C; and the second at temperatures of 314.2 and 314.0 °C for HCTZP and HCTZA, respectively.
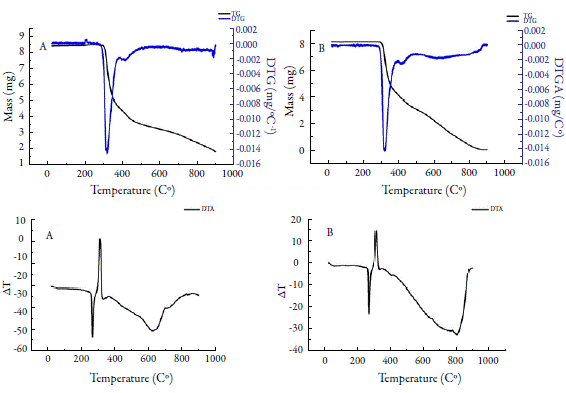
Figure 4 shows TG/DTG and DTA curves for Nifedipine. For NIFP, an event was observed at approximately 160.0 °C with a mass loss of 0.26%, related to moisture. A second event (between 209.24 and 338.0 °C; Tpeak= 294.0 °C) was observed, with a mass loss around 89 %, related to the first decomposition step of nifedipine. A last event (between 512.0 and 773.0 °C), with a mass loss of 11.5% was determined. For NIFA, the dehydration event occurred at 178 °C, with a mass loss of 0.72%. The first decomposition step occurred between 212.2 and 346.8 °C (Tpeak= 290.4 °C), with a mass variation of 94.0%; the second stage began at 577 °C, ending near 900 °C, with a mass loss of 1.35%. At the end of this analysis, 3.9% of the decomposition residue in the crucible was observed.
Both steps of nifedipine decomposition have been reported in other studies. Leite et al. [6] observed the first stage of nifedipine decomposition (between 209.2 and 313.8 °C), with a mass loss of 90.1%, and the second stage (between 533.24 and 677.58 °C), with a mass loss of 4.42%, in an inert atmosphere (N2). Filho et al. [36] detected both steps, but only described the first (between 210.0 and 390.0 °C), with 85.2% mass loss in synthetic air. Thus, the results found for thermogravimetric analysis in this study agree with the literature. DTA curves for NIFP and NIFA showed an endothermic peak at 173 °C relative to drug fusion, which is in the range of 171 to 175 °C [6, 25]. No description of the other peaks detected was found in the literature, being associated only with drug decomposition [36].
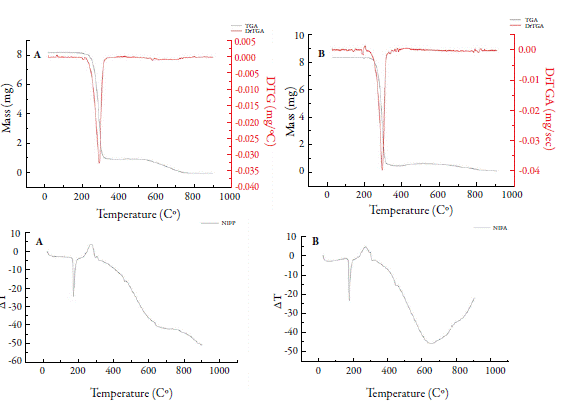
The literature describes that nifedipine form I, more thermodynamically stable, has a melting range of 172 to 173 °C; form II has a melting point of approximately 163 °C and form III (metastable form) in the range 134 to 137 °C [9]. Thus, it is suggested that, in this study, the crystalline forms of nifedipine (NIFP1 and NIFA) are presented in nifedipine form I, being its most stable form.
Spectroscopic techniques such as X-ray diffraction (XRD) are useful for the identification of different (pseudo) polymorphs of an active pharmaceutical ingredient in dry powder formulations [37]. X-ray diffractograms for FURP1, FURP2 and FURA exhibited well-defined peaks (figure 5A ). No significant differences were observed between sample profiles. The most intense peak occurred at 24.7° (2θ) for all samples. There were also peaks at 11.9°; 18.0°; 18.9°; 21.2°; 22.9°; 28.5° and 30.2° (2θ). These data corroborate the study by Shin and Kim and Garnero et al., who showed the crystallinity of the compounds [38, 39]. However, other authors have described peaks at 24.8°; 21.2° and 22.9° (2θ) for furosemide form I [40-42]. Thus, it was noted that, for the furosemide crystals studied (FURP1, FURP2 and FURA), similar profiles were evidenced to forms I and II of these drugs, according to table 2.
Table 2 Peaks exhibited by X-ray diffractometry for furosemide in this study and described in the literature.
The diffractograms obtained for HCTZP and HCTZA were, to their greatest extent, superimposable (figure 5B), with more evident peaks at 19.13°; 28.78° and 35.96°, at the same angles (2θ) and the same intensity. The data obtained agreed with Souza et al. [1] and El-Gizawy et al. [43]. This fact can be explained, since Aceves-Hernández et al. [44] stated that there is no polymorphism for hydrochlorothiazide.
NIFP and NIFA showed intense peaks (figure 5C) at 16.09°; 19.56° and 24.62° (2θ), near to those found by Chinh et al. [45] and presented smaller peaks at 10.42°, 11.77°, 14.73°, 16.93°, 22.47° and 25.92° (2θ). However, Leite et al. [6] reported that pure nifedipine exhibits peaks at 10.6° and 11.9° (2θ), which were not found in any of the analyzed substances. Brown et al. [46] suggested that peak differences may be associated with the type of nifedipine treatment. These authors showed, from drug heating and cooling, a larger number of reduced peaks, associated with the formation of less organized structures. In addition, Leite et al. [6] also showed structural differences by X-ray diffractometry from the recrystallization of nifedipine using different solvents. Additionally, Grooff et al. [9] described that nifedipine form I exhibits prominent peaks at 8.2°, 10.5°, 11.7°, 16.2°, 24.7° and 26° (2θ) and form III at: 7.4°, 9.2°, 11.2°, 12.4°, 12.8°, 15.7°, 16.9°, 24.2° and 26.3°. From the results obtained in this study and comparing them with the literature and other results obtained by thermal analysis, it is stated that the studied nifedipine crystals are arranged in the form I of this drug.
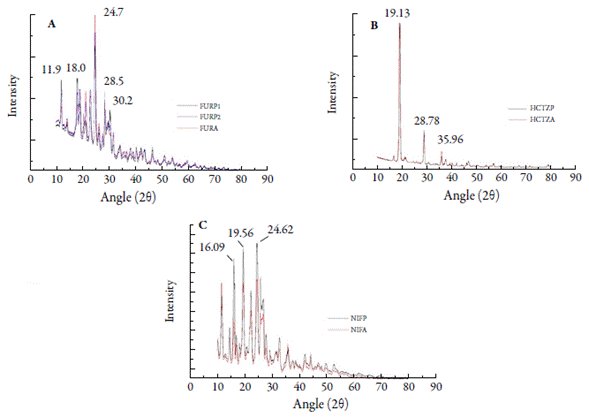
Figure 5 X-ray diffractograms: (A) furosemide (FURP1, FURP2 and FURA); (B) hydrochlorothiazide (HCTZP and HCTZA) and (C) nifedipine (NIFP and NIFA).
Infrared spectroscopy is one of the most important analytical techniques available to drug analysis [11, 47, 48]. FTIR spectra obtained for FURP1, FURP2 and FURA exhibited bands at 1140, 1240, 1318, 1562, 1666, 3282, 3350, 3399 cm-1 (figure 6A). Garnero et al. [40] described that differences in the FTIR spectrum of furosemide forms I and II are observed in the zones between 3400-3200 and 1350-1100 cm-1. These authors described that furosemide form I exhibits characteristic bands at 3398 and 3284 cm-1 (NH sulfonamide stretch), 3352 cm-1 (secondary amine NH stretch) and 1141 cm-1 (symmetric stretch S= O), while form II exhibits bands at: 3345 cm-1 (secondary amine NH stretch), 3251 cm-1 (NH sulfonamide stretch) and 1337 and 1169 cm-1 (asymmetric and symmetric stretch S= O, respectively). Doherty and York [49] suggested that the unit cell of a furosemide crystal, it has an intermolecular hydrogen bonding network involving the sulfonamide group. Moreover, they argued that furosemide II data revealed an alteration in vibrations associated with the sulfonamide group, suggesting a change in the hydrogen bonding sequence within the crystal. Thus, this polymorph may be the result of a molecular conformational change and, consequently, crystalline packaging of the drug. Therefore, it was observed that the crystals (FURP1, FURP2 and FURA) are in forms (I and II) of this drug.
The drugs analyzed (HCTZP and HCTZA) exhibited bands in the FTIR spectra (figure 6B) at 1148, 1317, 1519, 1596, 3165, 3264 and 3359 cm-1. In addition, small bands could be observed at 1021, 1057, 1121, 2836 and 2946 cm-1. El-Gizawy et al. [43] described bands at 3363, 3264 and 3172 cm-1 for the NH group stretch and at 3098 cm-1 for the CH stretch. In addition, bands referring to the CH2 group stretch at wave numbers 2964 and 2863 cm-1 have also been described: at stretching vibrations C= C at 1604 and 1519 cm-1. The bands for group SO2 were displayed at 1329 cm-1 (asymmetric stretching vibrations) and 1171 and 1060 cm-1 (symmetric stretching vibrations). Sonpal et al. [50] observed a band at 3354 cm-1, which was assigned to the stretching of NH bonds and 1570 cm-1, corresponding to the folding of this group into pure hydrochlorothiazide. Therefore, HCTZP and HCTZA are in accordance with the data described in the literature for hydrochlorothiazide. No differences were observed between drug bands (reference and sample). Thus, the presence of polymorphism for hydrochlorothiazide was not characterized.
FTIR spectra for NIFP and NIFA (figure 6C) indicated characteristic bands of N-H and C-H stretch vibrations at 3324 and 2953 cm-1 [51]. The peak at 1678 cm-1 was assigned to the carbonyl styrene vibrations, while the peak at 1647 cm-1 and the absorption region at 792-857 cm-1 were attributed to the C= C stretching and flexural vibrations in the benzene ring. Some characteristic peaks at 1527 and 1494 cm-1 were assigned to flexural vibrations of the NH and NO2 groups. In addition, symmetric and asymmetric C-O stretching vibrations in ester groups were also found at 1120 and 1224 cm-1, respectively [45, 51]. Therefore, the presence of FTIR polymorphism for the analyzed nifedipine crystals was not observed. These results corroborate those obtained by thermal analysis and X-ray diffraction, in this study.
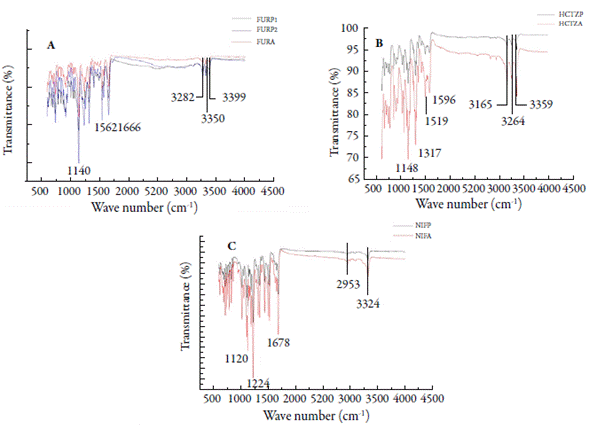
Figure 6 FTIR spectra: (A) furosemide (FURP1, FURP2 and FURA); (B) hydrochlorothiazide (HCTZP and HCTZA) and (C) nifedipine (NIFP and NIFA).
Scanning electron microscopy is widely used for observation of the microstructural characteristics of solids in drug analysis [52, 53]. The FURP1 crystals had a thin, elongated morphology of uniform size and the appearance of blades. For FURP2, smaller, finer divided needle-shaped crystals were visualized. Moreover, for FURA, the crystals were presented without a definite morphological formation and of varying sizes. These results corroborate that there is a morphological difference between the furosemide crystals studied (figure 7A) and the literature [54].
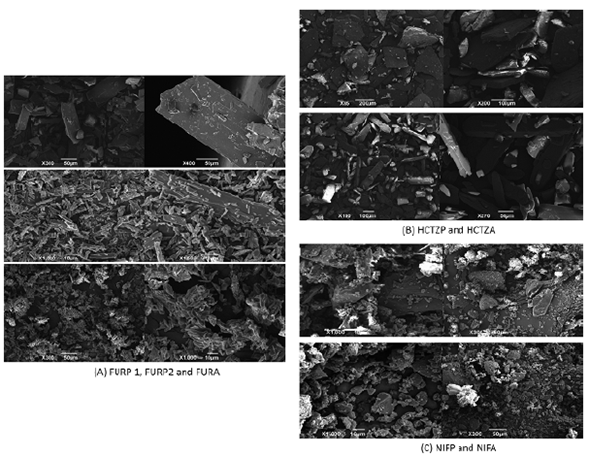
Figure 7 Micrographs obtained by SEM for: (A) furosemide (FURP1, FURP2 and FURA); (B) hydrochlorothiazide (HCTZP and HCTZA) and (C) nifedipine (NIFP and NIFA).
The micrographs obtained for HCTZP (figure 7B) showed large crystals (tile shapes) of uniform size and low thickness. For HCTZA, the crystals were large elongated parallelepipeds, with uniform sizes [15]. After morphological analysis of nifedipine crystals, NIFP and NIFA (figure 7C) were found to have varied sizes and undefined shapes. No other studies characterizing the morphology of pure nifedipine crystals were found in the literature.
Morphological differences observed for furosemide, hydrochlorothiazide and nifedipine crystals can be associated with differences in mass, size, shape, degree of compaction, bulk density and contact surface. Such differences may interfere with thermal analysis, X-ray diffraction and FTIR, as well as drug dissolution since the dissolution rate is dependent on the contact surface between the solid and the solvent.
Validation of the analytical method
Table 3 shows analytical validation parameters of the proposed methods for the determination of Furosemide (FUR), Hydrochlorothiazide (HCTZ) and Nifedipine (NIF). No interference from the matrix components occurred. The linear correlation coefficients were adequate (> 0.990), showing acceptable linearity for the methods. The normality test (Shapiro-Wilk) performed in residues presented no statistically significant results (p-value < 0.05). The LOD and LOQ values were obtained for all drugs, in the range of 0.19 to 0.43 and 0.58 to 1.32 µg/mL, respectively. Precision (RSD <10 %) and accuracy (RE between 98.77 to 108.27 %) were adequate.
Table 3 Analytical validation parameters of UV-Vis methods for the determination of furosemide (FUR), hydrochlorothiazide (HCTZ) and nifedipine (NIF).
* Precision and accuracy of the methods were evaluated by calculating relative standard deviation (RSD %) and relative error percentage (RE %), respectively, for six determinations of FUR (5, 25 and 50 fig mL-1), HCTZ (5, 17.5 and 30 fig mL-1), and NIF (2, 10 and 16 fig mL-1) over 2 days, under the same experimental conditions.
Dissolution studies
Physical tests, such as average weight, friability, and disintegration, are essential for drug quality assessment. The evaluation of weight variation allows verifying if solid pharmaceutical forms (tablets and capsules) of the same batch have uniform weight, i. e. homogeneity, but does not provide information about the uniformity of drug content in each form. Disintegration test is used to check if tablets disintegrate within the specified time limit (usually, 30 minutes) when subjected to the action of the specific apparatus under described experimental conditions [28]. Friability is the tendency of a tablet to lose particles of its composition due to abrasion and mechanical shock [55, 56].
Quality control of medicines is essential for the industry and pharmacy compounding. In Brazil, "similar" drug products contain the same active ingredient and has the same concentration, pharmaceutical form, route of administration, posology, and therapeutic indication, and is equivalent to the medicine registered in the federal agency responsible for sanitary surveillance, and may differ only in characteristics related to the size and shape of the product, shelf-life, packaging, labeling, excipients and vehicle, and similar drugs must always be identified by trade name or brand [23]. Pharmacy Compounding Accreditation Board provides a standardized system for evaluating and validating quality-control techniques performed by compounding pharmacies voluntarily [57].
All analyzed drugs (reference, similar, generic, and compounded) presented weight uniformity, friability and disintegration within the limits recommended by the Brazilian and American Pharmacopoeias, satisfactorily fulfilling the physical quality control tests (table 4).
Table 4 Average weight, friability, and disintegration for furosemide (FUR) and hydrochlorothiazide (HCTZ) tablets and nifedipine (NIF) capsules.
| Test | Furosemide (FUR) | Hydrochlorothiazide (HCTZ) | Nifedipine (NIF) |
|---|---|---|---|
| Average weight (g) | R (0.119) G (0.198) S (0.182) | R (0.111) G (0.126) S (0.150) | R (0.367) C (0.141) |
| Friability (%) | R (0.00) G (0.06) S (0.14) | R (0.50) G (0.21) S (0.17) | - |
| Disintegration (minutes/seconds) | R (23'') G (3') S (5'43'') | R (1'28") G (30'') S (8'53'') | R (11'54") C (6'09'') |
Reference (R); generic (G); similar (S); compounded (C); minutes ('); seconds ('').
The disintegration of a drug is a physical phenomenon and is directly influenced by several factors associated with both formulation (excipients, for example, disintegrants) and production parameters (granulation, porosity, and compression force) [58]. The results suggest that the disintegration times of tablets and capsules are closely linked to these factors, since the use of different excipients in the formulations was observed. Compressive force, among other factors related to the powder compression process, is relevant for friability variations in tablets [59]. Lima et al. [60] observed that, in addition to compressive strength, moisture content was able to change the frictional resistance of hydrochlorothiazide tablets.
In vitro dissolution testing is an important tool used for development, control, and approval of generic dosage forms and can be used to predict the in vivo performance of certain products [61]. These tests show pharmaceutical equivalence (same bio-pharmaceutical specifications of the test and reference products), which is relevant, given the possibility of interchangeability between drug products [62]. The Brazilian and United States Pharmacopoeias recommend that not less than 80 and 60% of the furosemide (40 mg) and hydrochlorothiazide (25 mg) tablets, label amount must dissolve within 30 minutes. For nifedipine (10 mg) capsules, not less than 80% of the drug label amount must dissolve within 20 minutes.
One of the required pharmaceutical equivalence tests is the comparison of similar and generic drug release profiles to that of a reference drug. Drug dissolution profiles may be distinct due to differences in formulations and manufacturing processes, but the differences must not compromise the bioequivalence of the product [63]. Figure 8 shows the levels of furosemide, hydrochlorothiazide and nifedipine, in the dissolution media as a function of time (minutes).

Figure 8 Comparative dissolution profiles: (A) furosemide tablets (40 mg); (B) hydrochlorothiazide tablets (25 mg) and (C) nifedipine capsules (10 mg) (Brazilian and United States Pharmacopoeias recommendations).
For furosemide tablets, dissolution was very fast, i.e. over 85% of the stated amount was obtained within 15 minutes. Therefore, the similarity factor (f2) was not calculated for any drug containing 40 mg furosemide. After 20 minutes of testing, drug concentration stabilization was observed in the dissolution medium (approximately 100% drug release). For hydrochlorothiazide, the similarity factor (f2) was calculated since the similar drug did not release 85% of the drug within 15 minutes [64]. As an established criterion for drugs to be considered pharmaceutical equivalents, f2 must be within the range of 50 to 100. Therefore, it is concluded that the similar drug (f2= 48.74) is not equivalent to the reference drug.
For nifedipine capsules, R and C products showed variations in drug release as a function of time. In the first 10 minutes, there was a similar behavior (release of ≥ 80% of nifedipine stated on product labels) and the similarity factor (f2) was not calculated. After this point, product C released the drug more slowly compared to product R, reaching approximately 94%. This difference may be mainly associated with the difference in excipients and manufacturing technology since the reference capsule had a liquid content in which the drug was already solubilized [65]. These authors evaluated the influence of excipients on nifedipine release, in compounded capsules, and obtained several formulations for the composition of this drug. None of the formulations was able to release the drug adequately, obtaining values below the recommended by the Brazilian Pharmacopoeia. From the pharmacotechnical point of view, it is emphasized that the solvent (Glycerol) present in the R product formulation may have led to an increase in the drug yield rate, playing a fundamental role in the dissolution profile of Nifedipine. In addition, Maria & Santinho [66] highlighted that the exposure time of nifedipine to light can influence the production of compounded drugs. Since this drug is photosensitive, the formation of dihydronifedipine and nitrosodihydronife-dipine may occur, which have little or no pharmacological activity.
In order to obtain comparative data between the studied drugs, the dissolution efficiency values were calculated (% DE), as shown in table 5, as a tool for comparing dissolution profiles, from the values obtained from the area under the curve (ASC) of drug dissolution profiles (reference, similar, generic and compounded).
Table 5 Dissolution efficiency values (% DE) for furosemide (FUR), hydrochlorothiazide (HCTZ) and nifedipine (NIF) within 30 minutes using the trapezoid method.
| Furosemide (FUR) | Hydrochlorothiazide (HCTZ) | Nifedipine (NIF) |
|---|---|---|
| R (98.00) G (86.30) S (74.30) | R (95.81) G (77.00) S (53.90) | R (61.90) C (59.40) |
Reference (R); generic (G); similar (S); compounded (C).
For furosemide tablets (40 mg), the results are in accordance with the literature [26, 67, 68] and suggest that the differences observed in dissolution profiles of products containing 40 mg furosemide may be mainly associated with manufacturing technology (use of excipients, granulation type, compressive strength, etc.) and, moreover, the size and morphology of drug particles. For tablets (reference, similar and generic) containing 25 mg hydrochlorothiazide, the values obtained differed from the literature, where DE ranged from 26.62 to 42.13% [27, 69]. Lee et al. [70] suggested that differences between samples in hydrochlorothiazide dissolution profiles (25 mg) are associated with drug properties (low solubility and permeability), granule size, crystal morphology, formulations, and industrial techniques. No data was found in the literature on dissolution efficiency of Nifedipine (10 mg) using similar methods.
CONCLUSIONS
Physicochemical characterization by TGA, XDR, FTIR, and SEM analysis for FUR, HCTZ, and NIF (raw materials and pharmaceutical formulations) showed differences and similarities between the medicines of each group studied. In the thermal events related to mass loss, they exhibited a significant difference. No presence of polymorphisms was observed for HCTZ and NIF, while by FTIR and DRX, polymorphs (I and II) were noted for FUR samples. It was also possible to infer about the presence of the organic groups that proved their molecular structures, and considerable differences were found in crystal morphological structures.
FUR and HCTZ tablets exhibited similar dissolution profiles with very rapid release to the pharmaceutical specialties (reference, similar and generic). For HCTZ tablets, the similar drug (f2= 48.74) is not equivalent to the reference drug. NIF capsules (reference and compounded), in 10 minutes, showed a release ≥80% of stated on product labels. The results obtained in this study suggest that the quality parameters and drug dissolution profiles may have been influenced by the morphology and size of the crystals, excipients, and technological processes for obtaining tablets and capsules. In this study, simple, rapid, and efficient UV-Vis methods were developed and validated for determination of raw materials and pharmaceutical formulations containing FUR, HCTZ and NIF.

