Inglês (pdf)
 Artigo em XML
 Referências do artigo
 Enviar este artigo por email
 Citado por SciELO
  Citado por Google
  Similares em
SciELO
Similares em
SciELO  Similares em Google
 Permalink
INTRODUCTION
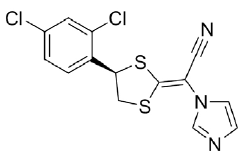
Luliconazole (figure 1), chemically (-)-(E)-[4-(2,4-dichlorophenyl)-1,3-dithiolan-2-ylidene]-1-imidazolylacetonitrile, is a broad-spectrum antifungal developed by Nihon Nohyaku Co Ltd (Osaka, Japan) [1] and it is commercially available as cream 1% (w/w). The drug belongs to the azole class, used to treat fungal infections. The azole class has a mechanism of action toward the inhibition of ergosterol, which is the major sterol present in the fungal cell wall, by inhibiting enzymes that are important to your synthesis, such as sterol 14α-demethylase [2-4].
The indications for the use of this drug are for the treatment of superficial fungal infections caused by Trichophyton rubrum, Trichophyton mentagrophytes, and Epidermophyton floccosum. Furthermore, luliconazole is also effective against Candida spp. [4-6]. The drug was extremely effective against the diseases caused by these microorganisms, improving the clinical status of patients [7, 8].
Analytical stability-indicating methods are important for evaluating drug stability in pharmaceutical form during drug development. These are essential for the product to reach the patient with quality, safety and suitable effectiveness, knowing their respective susceptibility under various stress conditions [9, 10]. The low stability of the active ingredient, associated with some environmental factors, such as heat and light, can affect the effectiveness of the drug, as well as chemical reactions, leading to the formation of degradation products, so there is a need to know the stability of the molecule. The identification of degradation product, caused by some of these factors, is also important as the safety of a drug which can produce toxic pharmacological effects [9, 11].
Software and other computational tools have been of great help for scientific research. In the ield of stability study, they are mainly used as a complement to forced degradation studies. In silico predictions are used to predict likely degradation products of active pharmaceutical ingredient (API), their respective degradation pathways, and also to evaluate alert for genotoxicity [12-14].
Zeneth® software, developed by Lhasam Limited (Leeds, UK), is a most sophisticated program to predict in silico degradation pathways of API under some conditions assisting the elucidation of a probable degradation product [15]. The program is described as an expert system capable of making decisions based on experimental precedence or knowledge base [16]. This software can predict the degradation under various temperatures, pH, light conditions, and also dimerization reaction and interaction with excipients [17-19].
There are some studies in the literature describing the determination of luliconazole in rat plasma by UPLC-MSMS [20], UV spectrophotometric method [21-23], thin-layer chromatography (TLC) [24] and a few works describing quantitative determination and luliconazole stability studies in pharmaceutical formulations by LC [25-27].
However, no studies have been found in the literature describing the validation method, isolation, and identification of the main degradation products by high-resolution mass spectrometry (HRMS). Due to this, the objective of this study is to develop and validate a new stability-indicating analytical method for quantification of luliconazole, identification of molecular mass of the degradation product (DP -1) by alkaline hydrolysis and in silico analysis to suggest and evaluate the chemical structure and the theoretical toxicity, using Zeneth® 7 and OSIRIS Property Explorer, respectively.
MATERIALS AND METHODS
Apparatus
A Shimadzu Prominence® liquid chromatograph (Kyoto, Japan) equipped with a model LC-20AD quaternary pump, SIL-20AC HT autosampler, CTO-20AC column oven, SPD-M20A photodiode-array detector and LC Solution V. 1.24 SP1 manager system software was used. Photodegradation studies were carried out in a photostability UV chamber (1.0 x 0.17 x 0.17 m) with mirrors and equipped with UV-C lamp (Ecolume ZW®, 254 nm, 30 W). A Hanna® pH/mV meter was used to pH determination. The mass spectrometer used was a Photo Ionization Time of Flight Mass Spectrometry (APPI-QTOF MS) controlled by the Compass 1.3 for micrOTOF software package (Bruker Daltonics).
Chemicals and standard
The luliconazole chemical reference standard (CRS) was acquired by Toronto Research Corporation (Ontario, Canada). All chemicals used were of analytical grade, and all solvents were of LC grade. Methanol and acetonitrile were purchased from Avantor® (J.T.BAKER, Center Valley, PA, USA). Phosphoric acid and triethylamine were purchased from Merck® (Darmstadt, Germany) and sodium phosphate from Dinâmica® (Diadema, Brazil). The solvents used (chloric acid, formic acid, and sodium hydroxide) were of purity grade and purchased from Sigma-Aldrich® (Steinheim, Germany). Hydrogen peroxide was obtained from Supelco® (Bellefonte, PA, USA). Ultra-pure water obtained from the equipment Milli-Q® (Millipore, Bedford, USA).
Chromatographic conditions
The chromatographic separation was performed on a Phenomenex® RP-18 column (150 x 4.6 mm, 5 μm). The elution was performed by isocratic elution with a mobile phase mixture of acetonitrile and 0.3% triethylamine solution adjusted to pH 3.3 with 20% (v/v) formic acid (60:40 v/v) at a flow-rate of 1.1 mL.min-1. The mobile phase was filtered using 0.45 μm filter and sonicated for 15 minutes by ultrasonic vibrations before use. The injection volume was 20 μL and the run time 15 min. The column oven was set at 55 °C and the luliconazole was determined by UV detection at 296 nm using photodiode-array.
Preparation of reference standard and sample solution
The CRS and sample solution were prepared by weighing 5.0 mg of luliconazole and dissolving with methanol in a 50 mL volumetric flask to get the concentration of 100 μg.mL-1. An aliquot of 2.0 mL of this solution was transferred to a 10 mL volumetric flask and completed with methanol to obtain a final concentration of 20 μg.mL-1. All the solutions were filtered with a 0.45 μm membrane filter.
Method validation
The developed chromatographic method was validated according to the Official Guidelines [28]. The validation was evaluating the following analytic parameters: robustness, selectivity, linearity, precision, and accuracy. The stability-indicating capability was determined by forced degradation conditions.
The robustness of the method was determined by analyzing the nominal sample and the sample subjected to UV-C radiation with different conditions such as pH of aqueous phase (3.0 ± 0.3), percentage of acetonitrile (62.5 ± 2.5 %), temperature (50 ± 5.0 °C), flow rate (1.0 ± 0.1 mL.min-1) wavelength of detection (296 ± 3 nm) and the different supplier column (Shim-pack® and Phenomenex®). The six factors selected were examined in a Plackett-Burman design (N=12) and the effect (E) of each factor and the estimated experimental error (SE)e were calculated [29]. Statistical analysis allows defining a numerical limit value capable of defining what is significant and what is not. This limit value is derived from the t-test statistical method, according to the equation:

An effect is considered significant at a given a level if t calculated > t critical.
Selectivity
Stress conditions were performed to provide an indication of the stability-indication and the selectivity properties of the method. The solution stock of luliconazole was submitted to hydrolytic, oxidative, thermal, and photolytic conditions. The peak purity test was performed by photodiode array detector (PDA).
a) Acid hydrolysis: This condition was performed maintained 2.0 mL of stock solution ofluliconazole (100 μg.mL-1) at two different concentrations of HCl (0.1 and 1 mol.L-1) for 1 h and stored at room temperature. Subsequently, the solution was neutralized by adding 0.1 mol.L-1 and 1 mol.L-1 NaOH, respectively and diluting with methanol to a final concentration of 20 μg.mL-1. The same procedure described above was performed in water bath at 70 °C for 1 h.
c) Alkaline hydrolysis: This condition was performed maintained 2.0 mL of stock solution of luliconazole (100 μg.mL-1) at two different concentrations of NaOH (0.1 and 0.01 mol.L-1) for 1 h and stored at room temperature. Subsequently, the solution was neutralized by adding 0.1 and 0.01 mol.L-1 HCl, respectively and diluting with methanol to a final concentration of 20 μg.mL-1.
d) Thermal degradation: This condition was performed by adding 2.0 mL of stock solution of luliconazole (100 μg.mL-1) in 2.0 mL of methanol and maintained 2 h s in a water bath at 70°C. After that, the solution was diluted with methanol to a final concentration of 20 μg.mL-1.
e) Oxidative degradation: This condition was performed maintained 2.0 mL of stock solution of luliconazole (100 μg.mL-1) in H2O2 30% for 1 h and stored at room temperature. Thereafter, the solution was diluted with methanol to a final concentration of 20 μg.mL-1. The same procedure described above was performed in water bath at 70 °C for 1 h with H2O2 3% and H2O2 30%.
f) Photolytic degradation: This condition was performed by adding 1.0 mL of stock solution of luliconazole (200 μg.mL-1) in Plastibrand® disposable cuvettes and subjected to UV-C radiation for 0.25 h and 0.5 h in the photostability chamber. Thereafter, all the solutions were diluted with methanol to a final concentration of 20 μg.mL-1.
Linearity
The calibration curve was prepared with seven concentrations (5.0, 10.0, 15.0, 20.0, 25.0, 30.0 and 40.0 μg.mL-1) of luliconazole CRS, which were prepared and injected in triplicate. The results were plotted in graphic with peaks of the chromatographic against the respective concentrations to obtain the analytical curve. The calculation of the regression line was employed by using the method of least squares and the curves were validated through analysis of variance.
Precision
The precision was in two different days (intra-day and inter-day) by analyzing six sample solutions of luliconazole prepared at 20.0 μg.mL-1. The precision was expressed as a percentage of relative standard deviation (%RSD).
Accuracy
The accuracy was determined by percentage recovery by adding aliquots of 0.4, 1.0 and 2.0 mL of the solution standard to sample solution of 20.0 μg.mL-1, corresponding 20, 50, and 100% of the nominal concentration.
System suitability limits
The SSL were established to ensure the validity of the analytical procedure. During the validation, the sample solution was exposed to UV radiation for 0.25 h. Theoretical plates, retention factor, tailing factor, resolution between the luliconazole and its photodegradation product were the parameters evaluated.
Isolation and identification of the degradation product
Luliconazole was subjected to forced degradation under an alkaline stress condition using 0.01 mol.L-1 NaOH for 1 h at room temperature, as described in the selectivity studies. The degradation product was named DP-1 according to the number of products present in the HPLC analysis. The isolation of DP-1 was performed at the same chromatographic conditions used for the method validation. Analysis performed by HRMS was used for the identification of DP-1 molecular ion (m/z).
The mass spectrometer used was a photo ionization time of flight mass spectrometry (APPI-QTOF MS) controlled by the Compass 1.3 for micrOTOF software package (Bruker Daltonics) and operated in positive ion mode. The capillary voltage was maintained at +1500 V and +1000 V to luliconazole and DP-1, respectively, with the end plate offset at -500 V to both molecules. The pressure for the nebulizer gas (N2) was set at 1.5 bar, and the drying gas (N2) flow-rate was 2.0 L.min-1 with a temperature of 200 °C. The full scan mass ranged from m/z 50 to 3000. The data were analyzed using Bruker Compass Data Analysis Software (version 4.2; Bruker Daltonics).
The Zeneth® 7 software was used to predict the structure of the degradation product. The luliconazole structure was drawn in the software and submitted under hydrolysis condition at pH 10.0 to predict the degradation products generated and their degradation pathways.
In silico prediction toxicity
To evaluate the theoretical toxicity risk of the suggested DP-1 two in silico toxicity programs were employed. The potential mutagenic, tumorigenic, irritant, and toxicant reproductive system effect was performed by OSIRIS Property Explorer® free web software and to assess genotoxicity (AMES toxicity), hepatotoxicity and skin sensitization was used the pkCSM free web software [30, 31]. The results were compared to in silico toxicity to luliconazole as control and H2O2 as toxic positive.
RESULTS AND DISCUSSION
Development of analytical method
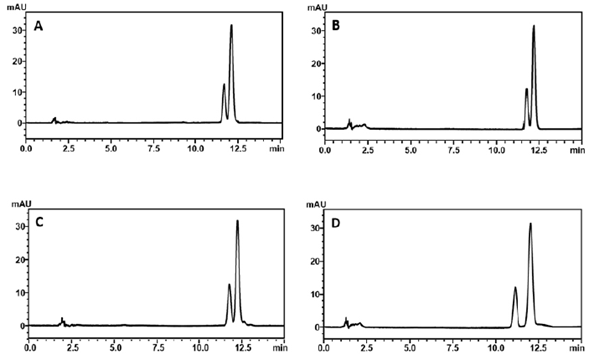
During preliminary degradation studies under photolytic conditions was veriied the formation of a degradation product with similar retention time to luliconazole (figure 2A). The resolution between these peaks was 1.095, which is not recommended according to the literature [32, 33]. Due to this, the method was developed optimizing the chromatographic conditions in order to provide sufficient separation between luliconazole and its photodegradation product, such as aqueous phase with and without triethylamine, at different pH values, and also the addition of phosphate buffers. The use of triethylamine as aqueous component resulted in better peak symmetry. The organic phase (acetonitrile) ration was changed until the complete separation. The oven temperature was also tested.
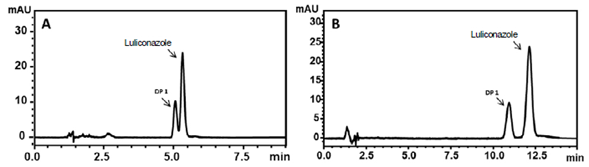
Figure 2 Chromatograms obtained from luliconazole and photodegradation product. Chromato-gram A: Mobile phase composed by a mixture of acetonitrile and 0.3% (v/v) triethylamine solution pH 3.0 (74:26 (v/v)). Chromatogram B: (62.5:37.5 (v/v)).
At first, the tested temperatures (35, 40 and 45 °C) did not show significant differences in the separation of the peaks, however, the drug peak and the degradation product peak had a better resolution when the temperature was set at 50 °C (supplementary figure S1). The use of 0.3% (v/v) pH 3.0 triethylamine solution improved the peak symmetry and lowered the retention time compared to the other pH values tested (4.0, 5.0, 6.0 and 6.5). The peaks were separated with an adequate resolution (R = 2.01) with a simple mobile phase composed of 0.3% triethylamine solution (pH 3.0 adjusted with 20% formic acid v/v) and acetonitrile (62.5:37.5 v/v) at the 50 °C (figure 2B). It was tried to reduce the retention time of the drug allowing for a rapid analysis and determination of luliconazole, however, an acceptable resolution and results of peak parameters was achieved with retention time at approximately 12.1 min. After suitable separation, the experimental design of Plackett-Burman was carried out to evaluate the robustness of the chromatographic method to obtain the best chromatographic condition to be used in this study. Therefore, based on the experiments, the proportion of the aqueous phase and organic phase and the oven temperature was changed to provide the best condition.
Other studies available in the literature did not present complete methodologies for forced degradation tests, according to ICH guidelines [25, 27]. Sonawane et al. [26] validated a stability-indicating method to quantify luliconazole. However, it does not present data confirming the complete resolution between the drug luliconazole and its main photo degradation product.
Table 1 The Selected Plackett-Burman design, parameters evaluated, results of the experiments and effects (E).
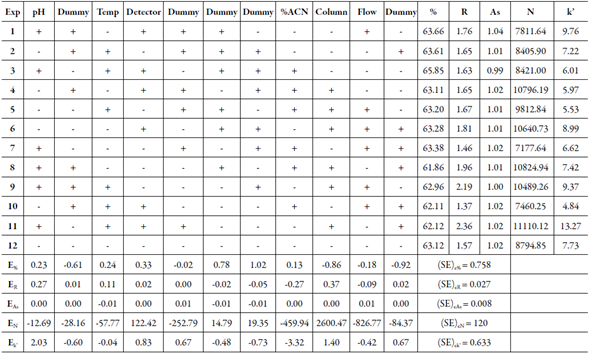
Robustness was studied by small and deliberately changing in the chromatographic method (pH, temperature, wavelength, percentage of organic phase, flow-rate and supplier column). For robustness experiments, the luliconazole CRS solution was injected and a solution of luliconazole exposed to UV-C radiation. The quantification study was performed by degradation percentage of luliconazole under the stress condition. No significant changes in the chromatographic method were made in the experimental, thus considering the robust method. The statistical results obtained shows (table 1) that there is no statistically significant difference using the t-test (t calc < t critical; α = 0.05).
The selectivity was assessed to provide an indication of the stability-indicating proprieties of the analytical method. The luliconazole solution was submitted under stress conditions, such as acid and alkaline hydrolysis, oxidation effect, thermal condition and UVC radiation. The LC method did not show any interference by the solvent used to dissolve the chemical reference substance, no other peaks were evidenced at the same retention time of luliconazole (figure 3A) and the method could separate the potential degradation product from the drug peak.
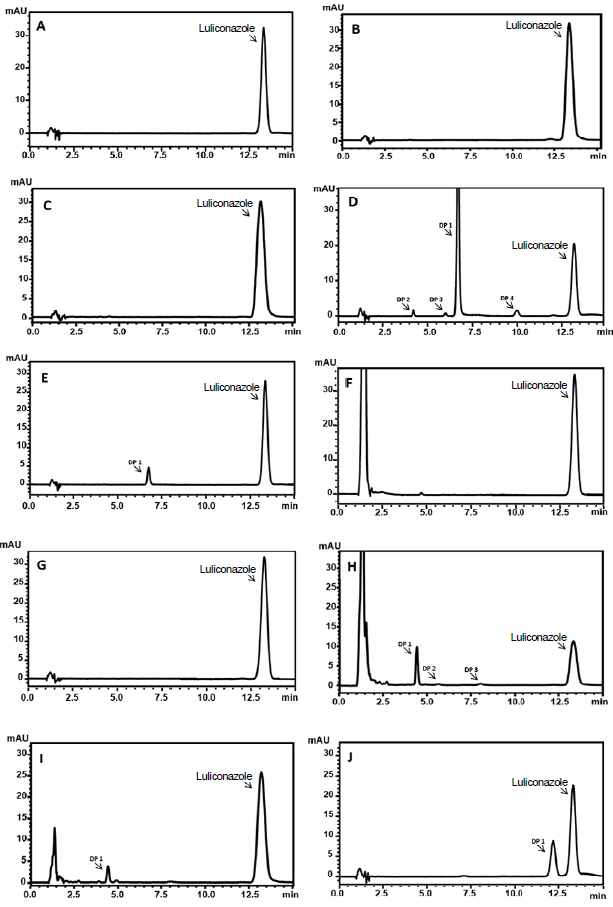
Figure 3 Chromatograms of luliconazole (20 μg.mL-1) under stress conditions. A: Reference substance. B : Acid hydrolysis (0.1 mol.L-1, 70 °C, 1 h). C: Acid hydrolysis (1 mol.L-1, 70 °C, 1 h). D: Alkaline hydrolysis (0.1 mol.L-1,1 h). E: Alkaline hydrolysis (0.01 mol.L-1, 1 h). F: H2O2 (30%, 1 h). G: Thermal (70 °C, 1 h). H: H2O2 (30%, 70 °C, 1 h). I: H2O2 (3%, 70 °C, 1 h). J: Photodegradation UV-C (254 nm, 0.25 h).
Table 2 Results offorced degradation studies ofluliconazole with final concentration of20 μg.mL-1.
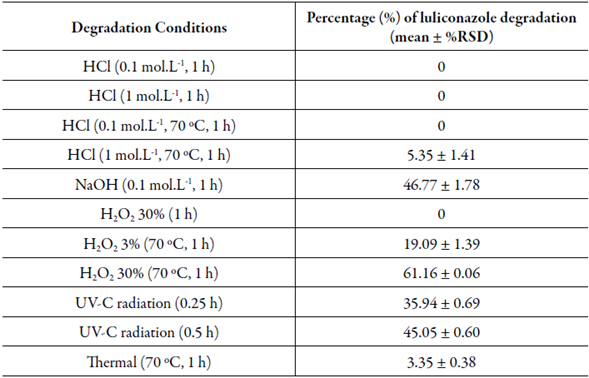
HCl= acid hydrolysis; NaOH= alkaline hydrolysis; H2O2= oxidation effect.
The degradation in acidic conditions at room temperature (0.1 and 1 mol.L-1 HCl) for 1 h and in 0.1 mol.L-1 HCl at 70 °C with for 1 h showed that luliconazole was stable with no additional peak or drug degradation (figure 3B). However, when exposed in 1 mol.L-1 HCl at 70 °C, the drug has a decrease in concentration (5.35%), that it was considered higher for the acceptance limits in this study. Thus, demonstrating the influence of the temperature at the drug degradation (figure 3C). Although, it was not detected any degradation product peak. The assay at alkaline stress condition (0.1 mol.L-1 NaOH) for 1 h, demonstrated the peak area of luliconazole has a considerable decrease and three additional peaks were detected, indicating the drug instability. The use of 0.1 mol.L-1 NaOH provided a fast and excessive degradation over 5-20% (figure 3D) which can point out a drastic degradation and these degradation products formed could be intermediate products. Considering this, a lower concentration of NaOH (0.01 mol.L-1) was tested to achieve a lower degradation rate and the main degradation product was still being detected at approximately 6.5 min (figure 3E).
The drug was stable at H2O2 30% (figure 3F) and thermal condition had a small percentage of degradation (< 5%) during 1 h (figure 3G). It was not detected degradation product at both conditions. However, the luliconazole was susceptible to oxidative degradation at 70 °C, showing a reduction of 61.16% in its initial concentration when submitted at H2O2 30%. Aiming a degradation below 20%, the H2O2 concentration was decreased to 3% and yet still demonstrated the luliconazole instability and it was observed a degradation about 19.09%, resulting in the intended degradation percentage to this study.
Similarly, at the alkaline condition, with higher H2O2 concentration, three degradation products were detected (figure 3H), but with a decreasing concentration for all of them. Two out of the three peaks are not evident anymore and the remained peak was detected at approximately 4.3 min (figure 3I).
Under the photolytic conditions, the luliconazole had a fast degradation. The drug showed about 35% of degradation after 0.25 h s under UV-C radiation and 45% of degradation after 0.5 h s of exposing, presenting high susceptibility when exposed to radiation. In both photolytic stress condition, the only addition peak was detected at approximately 12.1 minutes (figure 3J), as previously mentioned.
A study by Sonawane et al. [26] had demonstrated by using a forced degradation at similar conditions, an instability of luliconazole at acid hydrolysis with 1 mol.L-1 HCl, for 75 min at 60 °C and 0.1 mol.L-1 HCl, for 75 min at 100 °C. The results showed about 23% and 21% of degradation for both conditions, respectively. In this study, the same HCl concentration was used, but the exposure time and temperature were 60 min and 70 °C for both concentrations. The results were 5.35% and 0% of degradation in 1 mol.L-1 and 0.1 mol.L-1, respectively, as demonstrated before in table 2. Table 2 also demonstrates the oxidative condition which during the luliconazole exposure at H2O2 30% at room temperature has no degradation, condition assayed for 1 h, but when submitted at 70 °C for 1 h the drug concentration decreased at H2O2 30%, as well as when submitted to H2O2 at 3%. The oxidative condition was also evaluated in previously reported data [26] which demonstrated the luliconazole instability at H2O2 3% for 24 h and H2O2 30% for 2 and 24 h at room temperature. Due to this, the forced degradation studies presented in this study can suggest that both exposure time and temperature may contribute to the luliconazole instability.
The calibration curves were constructed by plotting concentration versus area where linearity over the 5.0-40.0 μg.mL-1 range was presented. The correlation coefficient of the analytical curve was 0.9982 and the linear equation was y = 30294x - 4139.1, where x is concentration and y is the peak area. The analysis demonstrated that the regression equation was linear (Fcalculated = 7506.7 > Fcritical = 4.6; a = 0.05) with no deviation from linearity (Fcalculated = 2.51 < Fcritical = 2.96; a = 0.05).
The precision was performed by assaying repeatability and intermediate precision. Repeatability (intra-day) has been assessed through the analysis of 6 luliconazole samples, injected in triplicate at the same concentrations. The results were 101.19 ± 1.37 and 100.88 ± 1.20 (mean ± RSD). The intermediate precision (inter-day) was assessed on two different days by the same analyst and the mean ± RSD for inter-day was 101.04 ± 1.19 (n = 12). The low variability of the results indicated the precision of the method.
Accuracy was determined from recovery assays by adding known amounts of a luliconazole CRS to the sample luliconazole solution (20 μg.mL-1), corresponding 20, 50, 100%. A recovery rate of 100.23 ± 0.72, 99.78 ± 0.78 and 99.94 ± 0.23 was observed for low, medium, and high levels, respectively.
System suitability limits (SSL)
The SSL are essential to verify the quality of the chromatographic system, evaluating the equipment performance, analytical operations, and samples constitute [33]. The suitability system was verified and determined from the robustness experiments, by evaluating the resolution between the luliconazole peak and the photodegradation product peak. The resolution (R > 2) that demonstrated adequate separation was showed in experiment 9, where the degradation product and drug had a retention time of 12.22 min and 13.36 min, respectively. Experiment 11 also demonstrated a good peak separation, however, the retention time of the luliconazole peak was 16.52 min. The other results of parameters investigated (theoretical plates and tailing factor) are summarized in table 3.
Isolation and structure elucidation of the degradation product
Forced degradation studies demonstrated a formation of a majority degradation product in alkaline conditions (0.01 mol.L-1 NaOH) at room temperature. The DP-1 was isolated using the same chromatographic conditions described in the method validation and its molecular structure was elucidated using HRMS analysis.
The mass spectrometer conditions were optimized with direct injection of luliconazole and DP-1 solutions (2 μg.mL-1) at a flow rate of 3 μL.mL-1. The best response was obtained with capillary voltage, extractor voltage, RF lens voltage, source temperature, APPI probe temperature and cone voltage of 3.0 kV, 3.0 V, 0.3 V; 120 °C, 350 °C and 38 V, respectively. Mass spectra of luliconazole and DP-1 were recorded in positive mode of atmospheric pressure photo-ionization (APPI) and revealed and confirm their respective molecular mass. The obtained value at m/z 353.9688 [M + H+] it is matching with molecular weight of luliconazole (figure 4). The mass spectra of DP-1 indicated a major peak at m/z 118.1545 (figure 5), which is 235 Da less than luliconazole.
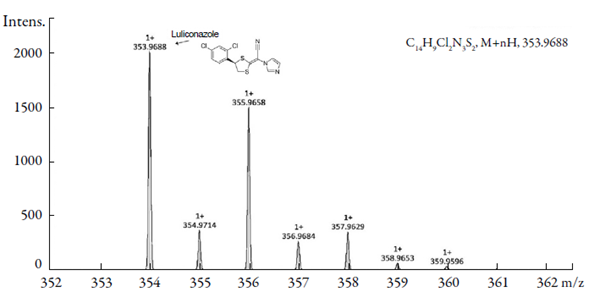
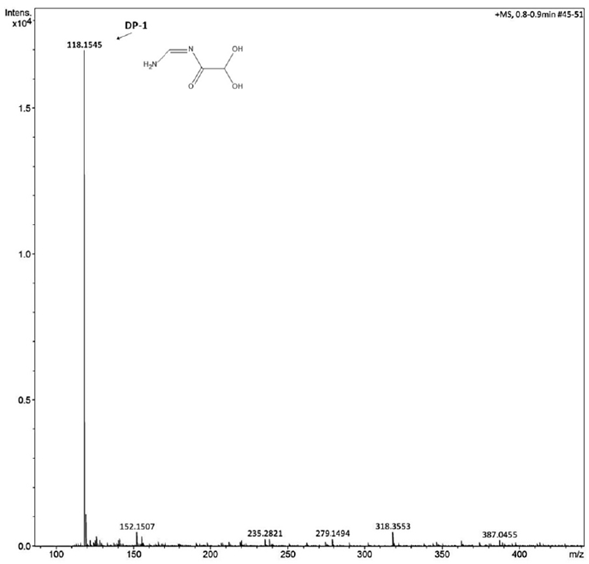
Figure 5 Mass spectra of degradation product by alkaline hydrolysis and its probable chemical structure.
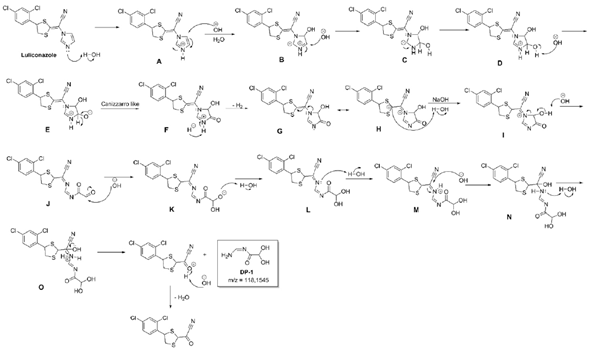
The Zeneth® 7 software showed a degradation product generated at hydrolysis condition (pH 10.0) with the molecular mass corresponding to the mass spectrum of high resolution (HRMS) of DP-1 which should be assign to hydroxyacetamide derivative. This degradation product was name as "(Z)-N-(aminomethylene)-2,2-dihydroxyacetamide" and the figure 6 demonstrates the degradation pathway of this product (DP-1). The basic hydrolysis mechanism of luliconazole should occurs mainly by the degradation of the imidazole core. After protonation of the basic nitrogen of the imidazole ring, the corresponding carbons 4 and 5 should undergo nucleophilic attack of the hydroxyl leading to the formation of intermediate D. A deprotonation of OH group followed by hydride elimination and abstraction of the proton of nitrogen forms the intermediate G with concomitant H2 elimination [35]. Its resonance structure H has the negative charge in the carbon between the two sulfur atoms of the dithiolane ring and it is well stabilized by the vacant d orbitals of the vicinal sulfurs [36]. The reaction of this structure with water leads to the formation of the dicarbonyl compound J by the ring opening ofthe a-hydroxy carbonyl derivative I. Another nucleophilic attack of the HO- on the aldehyde of intermediate J leads to the generation of the hydrate L. After the formation of a hydrate, the imine in which the nitrogen atom is attached to the electron-withdrawing group cyano is very susceptible to nucleophilic attack by water in order to give the hemiamidal-type product N [37]. Acyclic hemiaminals are very readily fragmented into carbonyl compounds and amines. Therefore, the hemiaminal fragmentation, in the presence of water, releases the DP-1 from the structure.
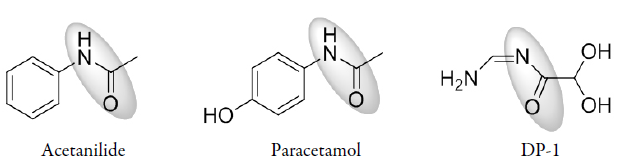
Acetamide groups are widely present in molecules used to treat diseases. This group is present, for example, on the structure of the analgesic and antipyretic drugs acetanilide (N-phenylacetamide) and paracetamol (N-acetyl-/ara-aminophenol). From this, other acetamide derivatives were introduced in the pharmaceutical field with varied activity [38, 39]. A study by Kaplancikli et al. [39] with acetamide derivatives demonstrated that new drugs having the acetamide group attached to benzothiazole and tetrazole rings contribute to reducing the nociceptive response. Arylacetamide derivatives are also compounds that have been reported with good antiprotozoal, antibacterial, and anticancer activities [40-42]. These compounds are important intermediates that help to obtain new pharmacological substances [40-43]. Therefore, based on the presence of an acetamide group, the possible molecule formed at alkaline hydrolysis of luliconazole can be a promising structure from a pharmacological point of view (figure 7).
Toxicity prediction in silico of degradation product
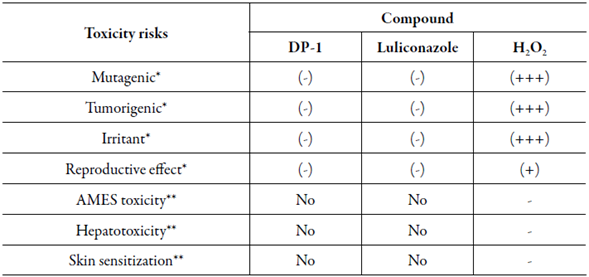
Two open-source programs were used to predict theoretical toxicity of DP-1. The in silico properties are given in table 4, where shows that DP-1 has no risk to cause any theoretical toxicity, such as mutagenic, tumorigenic, irritant, and reproductive effect, calculated by OSIRIS. Furthermore, the DP-1 also has no risk to cause AMES toxicity, hepatotoxicity and, mainly, has no skin sensitization, which is an important side effect to evaluate due to the drug administration route since a positive result to this parameter could mean that the compound can induce allergic contact dermatitis. No result demonstrated the similar effect of H2O2 remaining the same results obtained for in silico prediction of luliconazole, suggesting that the DP-1 is not potentially toxic to the organism. Toxicity studies of degradation products are necessary to indicate the caution that should be taken with drugs.
CONCLUSION
A simple and selective method for the quantitative determination of luliconazole by high performance liquid chromatography has been developed. The method was developed and validated with selectivity, capable of separating the drug peak with its respective degradation products, linearity, precision, accuracy, and robustness. The chromatographic system provided a good peak shape and acceptable resolution in analysis time of about 15 min. Study of stability at different conditions proved that the drug is stable under some conditions; however, instable under alkaline and UV-C radiation stress condition, due to this, the drug must be kept protected of the light. The alkaline condition demonstrated an unknown degradation product, which was analyzed by HRMS after isolation, showing a main peak at m/z 118.1545 relative to molecular weight of the product. The method was validated according to ICH guidelines and due to these characteristics, the method can be routinely used in quality control testing as there is no official method available.