


 English (pdf)
 Article in xml format
 Article references
 Send this article by e-mail
 Cited by SciELO
  Cited by Google
  Similars in
SciELO
Similars in
SciELO  Similars in Google
 Permalink
INTRODUCTION
Honey is a natural, fluid, and viscous substance, produced by bees from flower nectar and sugary insect excretions [1]. Its main composition is water and monosaccharide (fructose, glucose, and sucrose), which may vary according to the raw material, the geographic region, and the climatic conditions [2]. Honey has a high nutritional value, containing an approximate average of 80 % carbohydrates (in average 35 % glucose, 40 % fructose and 5 % sucrose) and 20 % water [3], among other substances, such as invertase, diastase and glucose oxidase enzymes, amino acids, 5-hydroxymethylfurfural (HMF), phenolic compounds (cinnamic acids and benzoic acids) and flavonoids (flavanones, flavones and flavanols) [4]. Vitamins and minerals are found in small amounts, as well as organic acids such as acetic and gluconic acid [5-8].
In recent years, with increase in studies conducted with apitherapy, an increase in honey consumption has been observed. Apitherapy (Apis is a Latin word that means bee) is the practice of using bee products such as honey, pollen, propolis, royal jelly, and bee venom for disease prevention or treatment proposes [9]. Regarding the medicinal properties of honey, several activities have been confirmed such as: antibacterial [10], gastrointestinal protector [11], antioxidant [12], healing [13], anti-inflammatory and treatment of burns [5]. For instance, human use of honey to medicinal propositions is traced to some 8000 years ago as depicted by Stone Age paintings. Herein, the ancient Egyptians, Assyrians, Chinese, Greeks, and Romans employed honey for wounds and diseases of the gut [9].
Products that have a high demand in their supply, such as honey, are attractive for adulteration and fraud processes [14, 15]. These, in the case of honey, can occur through the addition of syrups, molasses, starch, water, oils, among other substances that impair their properties and quality [16]. Once adulterated, the honey may have its physicochemical characteristics altered, such as moisture, weight, density, conductivity, and pH [17]. In addition to these, microbiological contamination can also be verified, which may indicate improper manipulation. Also, the absence of pollen grains in honey sediment can possibly indicate fraud [18]. It is also worth noting that adulteration has a profound impact on the therapeutic properties of honey, thus changing its biological effects and compromising the safety of its use in the context of apitherapy [19].
Honeys without registered official labels and without adequate quality control are more conducive to presenting some sort of adulteration and fraud. The evaluation of the quality of honey required by the Brazilian government, through its physicochemical properties, helps reduce adulteration and frauds since they are extremely important to ensure a good quality of the honeys. For this reason, we have analyzed two groups of honey collected in retail markets, both registered and not registered by the official inspection service, in order to compare and evaluate their quality. Therefore, analysis of the physicochemical, microbiological, and microscopic properties required by Brazilian legislation have been performed.
METHODS
Physicochemical analysis
All samples were bought in the city of Betim, in the Minas Gerais state, Brazil, and were produced by different suppliers. We divided them into two groups: six samples had a label (obtained in supermarkets), and six samples did not have an official label (obtained at popular fairs). The samples were analyzed in triplicate for their physicochemical, microbiological, and microscopic parameters, as follows: The analysis for color determination was fair according to Vidal and Fregosi (1984) [20], in which the samples were previously heated to 40 °C for 30 minutes and then transferred to 10 mm buckets and analyzed using the UV-VIS spectrophotometer (Shimadzu UV 1700), at 560 nm, with glycerin solution as white. Subsequently, the color classification was determined from the conversion of the absorbance results using the Pfund scale.
Free, lactonic and total acidity tests were performed, following AOAC's 962.19 method [21], by potentiometric titration. To determine free acidity, we used standardized solutions of sodium hydroxide 0.05 N (NaOH) and, to determine lactones, we used hydrochloric acid 0.05 N (HCl).
The pH was measured according to AOAC's [21], from a solution containing 10 g of honey, dissolved into 75 mL of Milli-Q water, free of carbon dioxide, using a pHmeter (Digimed).
Electrical conductivity was measured from a solution with 20 % honey (w/v) in a digital conductivity equipment (Mettler Toledo) at 20 °C, following the method of [22].
Moisture content was determined according to AOAC's 969.38B method [21], by refractometry, using a manual refractometer, with the respective temperature correction through the Brix scale (°Bx). The value obtained from °Bx was subtracted from 100 and the moisture value was determined.
The ashes present in the honeys were performed by gravimetric analysis. A clean crucible was taken to the muffle at 550 °C, and then left there for 1 hour, then transferred to a desiccator to cool down and then be weighed. Then, 5 g of honey were transferred to the crucible to be charred in a muffle for 3 hours at 550 °C. Again, the crucible with the charred sample was transferred to a desiccator to cool down and then be weighed. The difference between the weight of the crucible in both moments determined the amount of ash present in the honeys [23].
The determination of insoluble matter was performed by gravimetric analysis. A clean pore 3 sintered crucible (16 to 40 microns) was taken to the greenhouse, at 135 °C, and left there for 1 hour, and then weighed. The honey was diluted into ultrapure water at 80 °C, 25 % m/v, then submitted to a vacuum filtration system, where the sintered crucible was used as a filter element. After being filtered, he was submitted to the greenhouse again, weighed and then the analysts proceeded with the calculations [1, 23, 24].
The Louveaux et al. (1978) [25] method was used to evaluate the presence of pollen grains in the samples. 10 g of each sample were weighed and diluted into 20 mL of distilled water. The sets were then centrifuged at 3000 rpm for 7 minutes. The supernatant was discarded, and the sediment was resuspended with distilled water and centrifuged again. Later, the sediment retained at the bottom of the tubes was placed on a histological slide and fixed by heating at 35 °C. Subsequently, two drops of liquid glycerin and gelatin [26] were added and the coverslip was applied, leaving the slides to dry for 24 hours. Qualitative analysis was performed under an optical microscope (Olympus BX50) and the photomicrographs were taken using the Image-Pro software (version 10) and the Motic 3.0MP camera.
Microbiological trials
The microbiological analysis performed were count of mesophile bacteria, presence of molds and yeasts, total coliforms, Salmonella spp. and their biochemical identification, all according to the analytical methods of the Normative Instruction SDA - 62, of 08/26/2003 [27]. From the data obtained by colony count, the number of microorganisms present in the sample under analysis was calculated for each analysis and the result expressed in colony forming unit per gram (CFU/g).
Statistical analysis
We calculated the mean and standard deviation for the physicochemical and microbiological parameters of both the labeled and unlabeled honey samples. We performed the normality test for all quantitative physicochemical and microbiological variables using the Shapiro-Wilk test. Then, we checked if there were significant differences between the labelled and unlabeled honey samples, using the T test to normally distribute variables and the Mann-Whitney test for the other variables. The significance level used in the tests was 5%. The analysis was performed in the R software, version 4.0.0 [28].
RESULTS
Physicochemical parameters of honey
The main results obtained through the physicochemical analysis of the twelve honey samples are expressed in table 1. Of all physicochemical analysis performed, only moisture content showed significant difference between the two groups (p < 0.05) (figure 1).
Table 1 Physicochemical results of official labelled and not samples of honey.
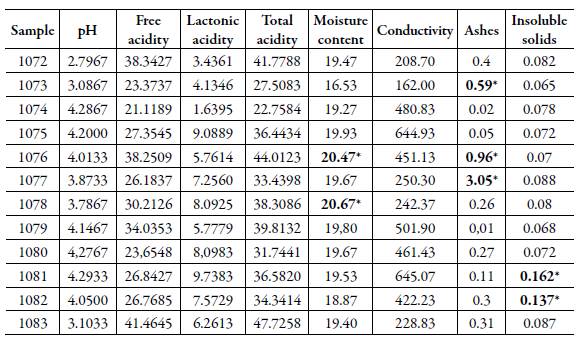
Subtitle: Free, lactonic and total acidity values were expressed by milliequivalent per kilo (mEq/kg); conductivity by microsiemens per centimeter (μS/cm); moisture content, ashes, and insoluble solids by percent (%); * values above the quality standard (AOAC, 1999); SD: standard deviation; IL: inferior limit; UL: upper limit.
Color analysis
During the collection of the honey samples, a significant difference in their color was observed. Through spectrophotometry, it was possible to classify the honey samples according to their color. The predominant color of the honey samples analyzed was light amber (60 %), and the official labeled samples ranged from light amber to dark amber, while the unlabeled samples ranged from without color (0.9323 ± 0.059) to light amber.
Free, total and lactonic acidity and pH analysis
As example values for quality standards, the values obtained for total acidity (figure 1G) ranged from 22.76 mEq/kg to 47.73 mEq/kg, with an average of 36.2 ± 6.94 mEq/kg, when compared to the values established by the AOAC (< 50.0 mEq/kg). This applied to all the samples. The unlabeled honeys presented a mean total acidity of 36.61 ± 7.23 mEq/kg (ranging from 27.50 ± 0.71 to 47.72 ± 1.26 mEq/kg) and the official labeled showed an average of35.79 ± 7.29 mEq/kg (ranging from 22.75 ± 1.32 to 44.01 ± 0.71 mEq/kg), which means no significant difference was found between the groups (p > 0.05).
The average lactonic acidity (figure 1E) was 6.4 ± 2.41 mEq/kg (1.64 to 9.74 mEq/ kg), while the free mean acidity (figure 1B) was 29.8 ± 16.67 mEq/kg (21.12 to 41.46 mEq/kg), with no significant difference (p > 0.05) between groups either. The results found in the pH (figure 1F) analysis showed no significant difference between the groups (p > 0.05), with their values ranging between 2.79 ± 0.01 and 4.28 ± 0.01, with an average of 3.83 ± 0.53.
Electrical conductivity and moisture analysis
The electrical conductivity (figure 1A) analysis of the twelve samples presented an average of 391.64 ± 168.63 μS/cm, with variation between 162.00 and 645.07 μS/cm, with no significant difference between the groups (p > 0.05), and the moisture content (figure 1C) results ranged from 16.53 ± 0.31 % to 20.67 ± 0.12 % with an average of 19.44 ± 1.03 %.
The unlabeled samples presented an average moisture content of 18.91 ± 1.19 % (16.53 to 19.67 %) and the official labeled, 19.99 ± 0.47 % (19.27 to 20.67 %). Therefore, the groups showed a significant difference between them (p < 0.05).
Insoluble solids and ash analysis
The mean found in the analysis of insoluble solids (figure 1D) was 0.0884 ± 0.0299 % (0.0650 ± 0.0150 % to 0.1620 ± 0.010 %), with no significant difference between groups (p > 0.05). The unlabeled samples had as average insoluble solids content 0.1010 ± 0.0390 % (from 0.0650 ± 0.0150 % to 0.1620 ± 0.010 %), whereas for the samples with an official labeled, the mean content was 0.0760 ± 0.0080 % (from 0.0680 ± 0.0060 to 0.0880 ± 0.0170 %).
Like insoluble solids, the mean found in the ash analysis (figure 1H) showed a great variation between its results, with an average of 0.52 ± 0.83 %. The unlabeled samples had an average of 0.72 ± 1.19 %, while the official labeled samples average was 0.33 ± 0.15 %. However, no significant difference was observed between the groups (p > 0.05).
Microbiological analysis
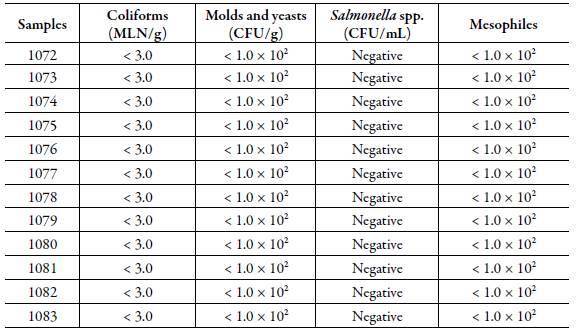
For the microbiological analysis, the presence of Salmonella spp. was not detected and mold and yeast counts were < 1.0 X 10² CFU, according to table 2.
Pollen spectra of honey
Of the twelve samples analyzed, only two did not present pollen grains in their constitution (figure 2). Four samples showed a predominance of the Eucalyptus pollen type (Myrtaceae). One sample, besides having a large number of grains also of the Eucalyptus type, presented numerous grains of Malvaceae family. Pollen grains of the Mimosa type were predominant in one sample. Two samples showed a great diversity of pollen grains and the presence of a grainy mass, but without a predominance of a single pollen type. In two samples there were many plant fragments, and a few pollen grains were observed, although these grains belonged to several botanical families.
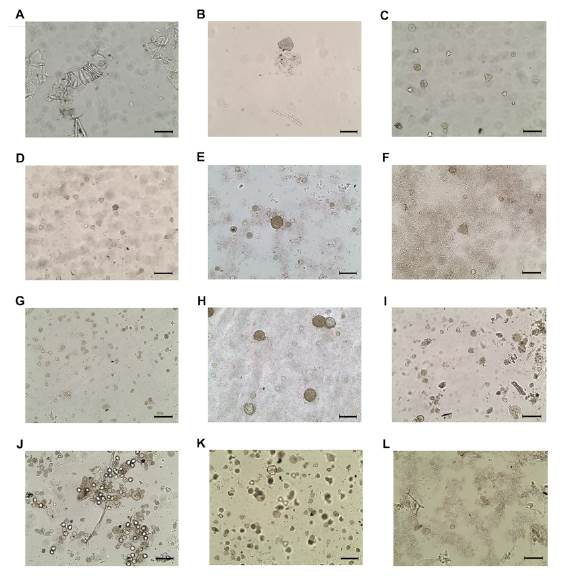
Figure 2 Optical microscopy photomicrographs of pollen grains present in honey samples from the Betim region, MG, with an optical magnification of 200x. A:1072 sample without pollen; B: 1073 sample without pollen; C: 1074 sample with Eucalyptus (Myrtaceae) pollen; D: 1075 sample with Eucalyptus (Myrtaceae) pollen; E: 1076 sample with great diversity of pollen grains and presence of granular mass, without, however, predominating a single pollen type; F: 1077 sample without predominating a single pollen type; G: 1078 sample with Fabaceae (Mimosa) pollen; H: 1079 sample with family Myrtaceae and Malvaceae pollen; I: 1080 sample without predominating a single pollen type; J: 1081 sample with Eucalyptus (Myrtaceae) pollen; K:1082 sample with Eucalyptus (Myrtaceae) pollen; L: 1083 sample without predominating a single pollen type.
DISCUSSION
Our study shows that the official labeled honeys met the requirements of the current legislation, while some unlabeled samples did not. Each kind of honey has distinct physicochemical and microscopic characteristics, which may explain the variability of these parameters between the labeled and unlabeled groups. Regarding microbiological contamination, no sample was outside the established limits, which demonstrates the safety in terms of the presence of bacteria and fungi in these honey samples from Betim, MG.
PHYSICOCHEMICAL PARAMETERS OF HONEY
The evaluation of honey quality is important because its quality can be affected by several factors such as: heating, liquefaction, clarification, or aging. Still, even with the mandatory implementation of these analyses, it is possible to find adulteration and fraud in honey. These quality-related analyses should be performed to promote a genuineness and quality of the product to the consumer, emphasizing the importance of product standardization to avoid fraud and tampering.
Currently, the required analyses are reducing sugars, moisture, apparent sucrose, insoluble matter, minerals, acidity, diastase activity and hydroxymethylfufural, in order to standardize and ensure the quality of honey [1, 23].
Honey coloration is associated with its floral origin, storage conditions such as time, light, temperature and moisture content, minerals, and honey ripening in the hive [29]. Due to this sensory characteristic of honey, color has a great influence in the choice of honey by the consumer [30, 31]. Those with dark color have higher ash contents, while the light ones have levels below 0.1% [32].
As well as coloration, acidity did not present significantly different values between the groups. It is determined by organic acids originated from different sources of nectar that determine the acidity of honey during its maturation process [33]. Thus, honey acidity is a component that contributes to the maintenance of its stability, reducing the development of microorganisms, which are consistent with the findings of microbiological analysis, since all samples presented values within the normality for acidity.
On the other hand, just like, the Brazilian legislation does not require the evaluation of honey pH as a mandatory analysis, so there is no pre-established pH range [23]. The pH values differ from the floristic composition used as raw material for its production, since the pH of honey is influenced by the pH of nectar and varies according to the hydrogen ions dissolved in water, as well as its acidity, besides containing a varied number of organic acids and amino acids in its composition, conferring its acid character. However, it was observed that three unlabeled samples presented abnormal pH values, compared to other studies that had pH ranging from 3.68 to 4.97 [34] and 3.60 to 5.35 [35].
Conductivity is recognized by some authors as an important proof of the botanical origin of honey [24, 36, 37]. However, to compose the international standards of honey quality, a maximum limit of 800 μS/cm of conductivity was established [24]. Based on this parameter, both groups presented values within the standard, but without significant difference between them. In addition, a great variation in honey conductivity was observed, probably due to different concentrations of organic acids, minerals, proteins, and other substances that compose it. Another study reinforces this variation, in which 57 samples of different honeys were analyzed, presenting a variation of 100 to 2103 μS/ cm depending on the region of Brazil from which they were collected [38].
On the other hand, the analysis of the contents of insoluble matter in water revealed that two of the unlabeled samples analyzed were outside the standard established by the AOAC: a maximum content of 0.1 %. The number of insoluble solids in water varies mainly according to the hygienic character during honey production [39] and its evaluation allows to establish a honey purity index [40].
We know that the ash concentration of a honey sample should not exceed 0.5 %. From this point, our results show three samples, one unlabeled and two official labeled, expressed results above the reference value. The ashes directly express the amount of minerals present in honey, which can be influenced by factors such as bee, beekeeper management of the hives, climate, soil, and botanical origin [41].
Regarding the moisture analysis of honeys, the significant difference found between the groups can be explained by the poor storage and conditioning conditions of the unlabeled honey, which was in reused bottles (glass bottles of beer, pepper) and some were sealed by corks, which reduces their low level of moisture content in relation to the official labeled samples, since the pores present in the stoppers allow water to pass through them. Two official labeled samples had values above the allowed by the Brazilian legislation, which establishes a maximum limit of 20 % for all types of honey. The moisture content of a honey varies according to the rate of dehydration of nectar during its transformation process, raw material used for its production, climate, and harvest time [42].
However, both groups of honey produced satisfactory effects, indicating that their collection was performed at the correct time, since, when collected early, the moisture content values tend to be above 20 % due to low dehydration during their transformation process [43]. Moreover, this low moisture content value contributes to a reduction in microbiological contamination of the samples [44], which was verified through microbiological tests counting mesophyll bacteria, presence of molds and yeasts, total coliforms of thermolabile and Salmonella spp.
Microbiological analysis of honey
In microbiological analysis, negative or non-significant or non-significant results were observed in all samples (mesophile bacteria, presence of molds and yeasts, total coliforms of thermolabile, Salmonella spp.). The absence of microorganisms in the samples of both groups can be explained, in addition to the care in the packaging and added to this, by the low moisture content of the samples, since the water present in honey has a strong interaction with sugars; there is a decrease in water activity reducing its availability to microorganisms [45]. Another factor that contributes to the absence of microorganisms is the acidity of honey, which, due to the presence of hydrogen ions (low pH), maintains its chemical stability, inhibiting the growth of microorganisms [45]. Other factors, in addition to osmotic pressure and pH, also contribute to the low microbial contamination in honey such as presence of hydrogen peroxide, bee-defensin-1 peptide, and phenolic compounds [46].
Pollen spectra of honey
The presence of pollen indicates the type of honey, and its absence is a strong indication of adulteration. This was identified in two samples without pollen (figure 2), and these also had the lowest pH values (table 2), with one pH below 3. However, there was no distinction with the other results, both physical-chemical and microbiological. Which indicates how important it is to carry out all physical-chemical, microscopic, and microbiological analyzes in the search for the quality and authenticity of honeys.
CONCLUSION
We conclude that the physicochemical methods, combined with the microbiological and microscopic methods were sufficient to define the adulterated and falsified honeys. In addition, our results show the importance of official labels to guarantee the quality of marketed honey and to bring safety and protection to this product, since no labelled honey was adulterated. Finally, we conclude that identifying the presence or absence of pollen in the samples is a safe and reliable way to verify the authenticity of honey.

