English (pdf)
 Article in xml format
 Article references
 Send this article by e-mail
 Cited by SciELO
  Cited by Google
  Similars in
SciELO
Similars in
SciELO  Similars in Google
 Permalink
Introduction
In order to be useful, the results of a spirometric test on any person should be contrasted with reference values (RV) that conform to the characteristics of the population of origin. 1-3 However, the assessment of ventilatory function in a particular subject is still done based on RV derived from foreign populations. By way of example, the European Respiratory Society (ERS) proposed using the values reported by Roca et al.4 and Roca et al.5 for diagnosing respiratory diseases in Spanish subjects, although the ethnic and demographic variability of the population of the European Union (in general) and of Spain (in particular) may force to resort to RV derived from Asian and African subjects.
In the USA, Hankinson et al.6 created separate RV for the Caucasian, Afro-American and Mexican-American populations studied in 81 regions of the country based on the Third National Health and Nutrition Survey (NHANES III). Spirometry values found in Caucasian subjects were higher than those reported in 1983 by Knudson et al.7 and in 1981 by Crapo et al.8 Furthermore, the RV of the Caucasian subjects were greater than those observed in African-Americans. 6
The RV of the spirometric variables (SV) proposed by Roca et al.5, Hankinson et al.6, Knudson et al.7, Crapo et al.8, Quanjer et al.9 and Pérez-Padilla et al.10 are the most used in the Ibero-Latin-American area. According to the PLATINO Study, carried out in 2006 in five cities of Latin America 10, the RV proposed based on Caucasian and Mexican-American subjects examined during NHANES III described better the clinical reality of the countries of the area than the tables elaborated by Knudson et al.7,11-13
As of the moment in which this work is written, there are no RV for routinely measured SV proper for Cuban workers (CW). This reference gap has been filled with values imported from other populations. However, efforts have been made to document the behavior of SV in healthy, non-smoking CW; Jané-Lara et al.14 obtained RV for spirometry after examining 85 non-smoking workers in the municipality of Cerro, which correlated well with those yielded by Morris et al.15 and Cherniak et al.16. On the other hand, Hechavarría-Miyares et al.17 published RV for SV after studying the healthy workers of the most important economic sectors of the municipality of Puerto Padre in Las Tunas Province. These RV were comparable with those reported by Knudson et al.7, Crapo et al.8 and Morris et al.15
The RV used for the interpretation of spirometric tests in occupational health have become remarkably relevant in recent years. Many workers are exposed repeatedly and for long periods of time to countless harmful substances that may hinder lung function. The resulting lung disease may cause transient or permanent work disability, thus seriously affecting the quality of life of the workers and posing high costs for local and regional health systems. All these reasons justify the existence and operation of a medical surveillance system in occupational pneumology responsible for diagnosing alterations of lung function caused by exposure to various risk factors in the workplace and, by virtue of this, producing adequate RV to achieve this task. 3
Considering all these aspects, the present study has been conducted with the purpose of deriving RV for SV used in the diagnosis of pulmonary conditions that may occur in the CW population attended in the National Institute of Workers' Health (INSAT by its Spanish acronym) of Havana, Cuba.
Materials and methods
This is a retrospective and analytical study conducted in the INSAT Spirometry Laboratory in Havana, Cuba.
Study series
This study series was built based on the records of the subjects treated in the laboratory between January 2009 and October 2015, after applying the corresponding inclusion and exclusion criteria. Information regarding age in completed years, sex (male/female), height (centimeters), weight (kilograms), forced vital capacity (FVC) forced expiratory volume in one second (FEV1), FEV% ratio (=FEV1/FVC) and forced expiratory flow25-75 (FEF25-75) was obtained for each subject.
Height and weight were recorded with an accuracy of 0.1 and were obtained during the spirometric examination according to the procedures prescribed by the International Biological Program. 18,19 Body mass index (BMI) was calculated using the current height and weight values of the subject. 20,21
Inclusion criteria
Subjects of either sex, aged between 20 and 65 years, non-smokers and apparently healthy were included. In the case of workers, it was ensured that the levels of occupational exposure were the permissible according to Cuban standards.
Exclusion criteria
Subjects with the following conditions were excluded from the series: history of chronic respiratory, cardiovascular, neuromuscular diseases (including muscular dystrophy and epilepsy), otorhinolaryngological diseases (such as deviated nasal septum, vasomotor rhinitis and chronic suppurative otitis media) and osteomyoarticular diseases (kyphosis and scoliosis); systemic diseases that could affect ventilatory function such as diabetes mellitus, collagenosis, endocrinopathies, abdominal tumors and ascites; other diaphragmatic conditions; digital clubbing; insufficient weight for height (BMI <18.5kg/m2); excessive weight for height (BMI >25.0kg/m2); and pregnant women.
The records of individuals with a history of major thoracic and abdominal surgery, active peptic ulcer, occupational exposure above the permissible levels and a history of treatments with bronchodilators, β-blockers, vasodilators, antiarrhythmics and digitalis were also excluded.
Likewise, subjects for whom good morphology as part of the maneuvers performed during spirometry was difficult to obtain due to problems of understanding, cooperation or coordination were excluded, as well as patients with physical deformities of the mouth that prevented proper fitting of the mouthpiece of the spirometer, subjects who presented with a flu-like state at the time of obtaining the flow/volume curve, and subjects who had tracheomalacia or other alterations/deformities of the trachea and the airways.
The identification and registry of respiratory or systemic symptoms found in the subjects were done using the respiratory signs and symptoms questionnaire proposed by the UK Medical Research Council. 22 The spirometric measurements were made with an electronic spirometer DATOSPIR-120D (SIBEL S.A., Spain) standardized and calibrated according to locally valid procedures, and a Fleisch pneumotachometer was used as transducer.
Data processing and statistical-mathematical analysis of the results
The data retrieved from the subjects included in the study were processed using the statistical package SPSS version 19 (SPSS Inc., New York, USA) and were summarized by means of location (mean), dispersion (standard deviation) and aggregation (absolute/relative frequencies, percentages), depending on the type of the variable.
The behavior of the selected SV was modeled according to the age and height of the subject using linear regression techniques based on ordinary least squares 20:
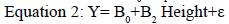

Where Y: FVC, FEV1, FEV%, FEF25-75; ε: residual error; and B0, B1, B2: least squares coefficients of the regression line. Separate predictive equations were built according to the sex of the subject.
For each predictive equation of the selected SV, 95% prediction intervals (PI) were obtained to define the possibility of accepting a future observation as a healthy value. 23
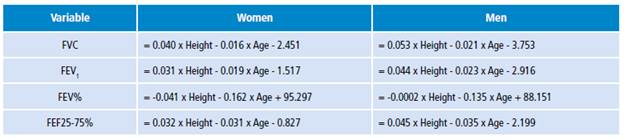
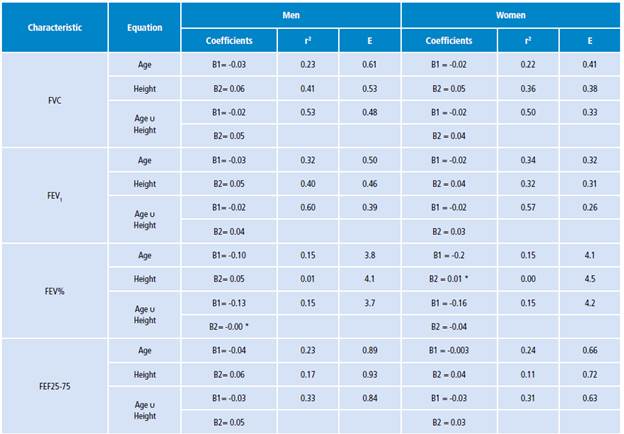
The study also included a comparison of the RV obtained in this research with those used in the daily practice of the authors' laboratory. An exhaustive analysis of the equations that have been proposed for the same purposes in the international literature was not attempted; instead, the formulas of Hankinson et al.6, Knudson et al.7 and Hechavarría-Miyares et al.17 were used as shown in Table 1.
Table 1 Predictive equations of selected spirometric variables.
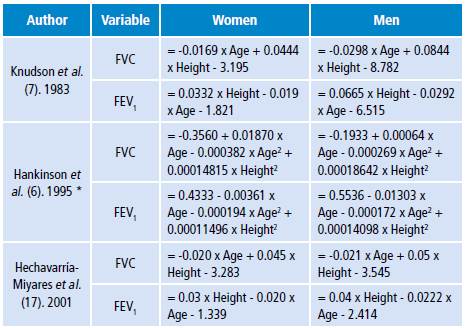
* Only for Caucasian subjects.
Source: Own elaboration based on the data obtained in the study.
Ethical considerations
This research was approved by the institutional ethics committee. Considering the retrospective nature of the study, informed consent from the subjects was not required for inclusion. Data were treated preserving the confidentiality and anonymity of the person from whom they were obtained.
Results
1 370 apparently healthy CW were eligible to be included in the study series. After applying the filters established in the experimental design, the study series was finally made up of 1 086 subjects, who represented 13.5% of the historical records of the Spirometry Laboratory.
Provisions were made to include in the study series subjects with BMI values between 18.5 kg/m2 and 29.9 kg/m2 in selected age ranges. The BMI cutoff point was extended to include overweight subjects since the research team was interested in including subjects with a muscular component superior to the rest of the Cuban population.
Men predominated (56.9%) over women (43.1%). Only 6.2% of the subjects studied were aged >60 years. It should be noted that the legal age for retirement in Cuba was, until 2009, 60 years for men and 55 for women.
Table 2 shows the state of anthropometric and spirometric variables in the subjects included in the study series. Men were taller and heavier than women, but these differences were not observed in the BMI. Additionally, men had higher FVC and FEV1 values; however, the FEV% ratio was similar for both sexes. Higher FEF25 75 values in men may reflect differences related to sex.
Table 2 Distribution of the anthropometric and spirometric variables of the study series according to the sex of the subject.
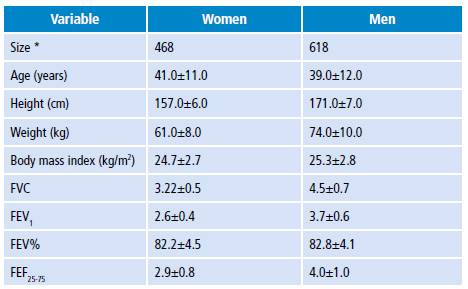
* The size of the series was of 1 086 subjects.
Source: Own elaboration based on the data obtained in the study.
Table 3 shows the statistics of the regression lines adjusted for each spirometric variable according to sex. Annex 1 shows the predictive equations developed. The values of the spirometric variable examined were inversely proportional to the age of the subject, indicating that ventilatory function naturally decreases with age. It is worth noting that about 800-950 mL of ventilatory function is lost between 20 and 65 years of age, regardless of sex.
Table 3 Statistics of the regression models adjusted for each of the spirometric variables examined according to sex, age and height of the subject.
υ: operator "AND".
* p <0.05.
Source: Own elaboration based on the data obtained in the study.
On the other hand, the values of the corresponding spirometric variables increased with the height of the subject, which would imply that taller people may show higher ventilatory volumes. The inclusion in the regression equation of both characteristics was evident in higher values of the coefficient of determination r2 and reduced regression errors.
However, it should be noted that height did not influence the FEV% and, perhaps, its behavior is only attributable to the age of the subject. FEV% is a quotient that integrates FVC and FEV1. Although these SV change with age, it is expected that the ratio of both (in short, the FEV%) remains constant for age and independent of height. In response to this behavior, some authors 24,25 have proposed to remove height from the predictive equation for FEV%. However, for homologation purposes, height was included in the FEV% predictive equations developed for each sex in this study.
Figures 1 and 2 show the comparative behavior of the predictive equations examined in this study for FVC and FEV1 when they were evaluated for height in a reference Cuban person (men: 171 cm vs. women: 157 cm). The expected values of the spirometric variable in question were included within the corresponding 95% PI, indicating that they were indistinguishable from those yielded by the equations proposed by the authors of the essay. The average bias included with each equation used for predicting FVC was 0% for the equation presented in this paper, 6.7% for Hankinson et al.6, -1.9% for Knudson et al.7 and -6.9% for Hechavarría-Miyares et al.17. As for FEV1, bias was 0% for the equation presented in this paper, 5.7% for Hankinson et al.6, 0.6% for Knudson et al.7 and -2.5% for Hechavarría-Miyares et al.17.
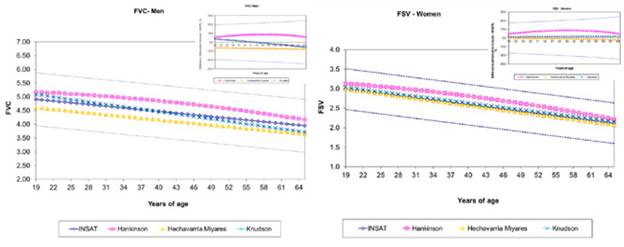
Source: Own elaboration based on the data obtained in the study.
Figure 1 Comparative behavior of different predictive equations of forced vital capacity (FVC). Dashed lines: 95% prediction intervals for the predicted FVC value. Box: bias in the predicted FVC value caused by the predictive equations.
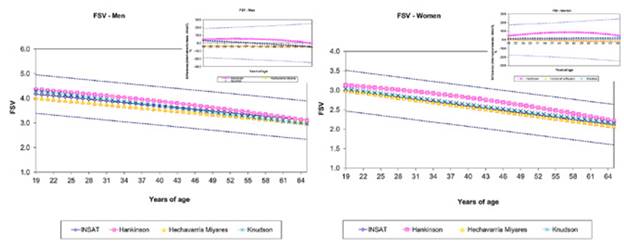
Source: Own elaboration based on the data obtained in the study.
Figure 2 Comparative behavior of different predictive equations of forced expiratory volume in the first second (FEV1). Dashed lines: 95% prediction intervals for the predicted FEV1 value. Box: bias in the predicted FEV1 value caused by the predictive equations.
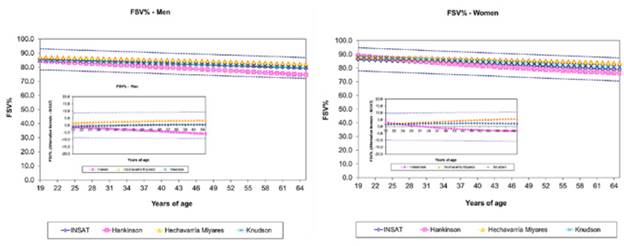
Finally, Figure 3 shows the behavior of the FEV% predictive equations according to the sex of the patient; the values estimated by the alternative equations were included within the 95% PI for the INSAT formula. Bias generated by the different examined equations was 0% for the equation presented in this paper, -2.4% for Hankinson et al.6, 1.0% for Knudson et al.7 and 3.3% for Hechavarría-Miyares et al.17.
Discussion
This work has provided RV and the corresponding predictive equations of the SV assessed in subjects attended in an occupational health institution. In agreement with previous reports, the behavior of the corresponding spirometric variable was dependent on the subject's sex. With known height values, FVC and FEV1 values decreased with age, whereas taller subjects showed higher FVC and FEV1 values when age was set. It was also verified that the RV of the SV predicted using formulas described in the international literature were included within the 95% PI of the equations developed in this work with the subjects treated by the authors. The bias introduced by such formulas was, in any case, <10% of the value obtained with the equations developed locally. In addition, it was verified that the VFE1/CVF quotient behaved as described above.
All of this points towards the predictive validity of the set of formulas proposed here for the description of the SV of interest, thus making possible its introduction in diagnostic exercises conducted as part of the practice in occupational health in the reference institution.
The construction of RV for a specified biological variable by suitably developed predictive equations has been discussed in the past. 2,26,27 The RV reflect the expected behavior of the variable in a specific subject to enable the possibility of inferring making inferences about the affectation that a disease may cause. 28 Thus, the presence of the disease may be suspected if the value obtained from the biological variable exceeds a critical point placed, for example, two standard deviations to the right of the one yielded by the predictive equation. 29
In this study, the RV for the SV were obtained from the retrospective analysis of the databases belonging to the authors' laboratory after the application of the corresponding filters. The existence of computer systems for collecting and storing all kinds of data regarding the patients, and the realization that an important part of this data comes from apparently healthy subjects makes possible the cost-effective construction of predictive equations for observing the behavior of a biological variable that may be quickly transferred to diagnosis. 30-33 Future research should include the assessment of the diagnostic validity of predictive equations developed locally in cases of chronic obstructive pulmonary diseases such as bronchial asthma, asbestosis, silicosis and pulmonary fibrosis, using the ROC methodology. 34,35 Body weight was excluded from the regression model to prevent distortions due to obesity. A BMI >30 kg/m2 may have adverse impacts on spirometric function by limiting respiratory excursion. 36,37 Furthermore, skin color was not taken into consideration for the construction of the regression models, since no differences were found between the SV examined when the present study series was distributed according to skin color. A genetic study of national scope revealed a high miscegenation of the Cuban population, making thus unnecessary to stratify it based on ethnic origins, as could be the case of other countries. 38
Conclusions
The RV derived from the SV used to diagnose ventilatory function in supposedly healthy non-smoking CW depended on the sex and age of the worker, and were comparable with values described in the specialized literature and used in the diagnostic practice of an occupational health institution. A better assessment of the state of ventilatory function in the population of workers assisted in the institution is expected after implementation of the proposed RV.