


 Inglés (pdf)
 Articulo en XML
 Referencias del artículo
 Enviar articulo por email
 Citado por SciELO
  Citado por Google
  Similares en
SciELO
Similares en
SciELO  Similares en Google
 Permalink
Introduction
Among physical characteristics, muscle strength (MS) has gained great importance within the context of health thanks to the progress made regarding knowledge of muscle functions, as it is considered an endocrine and immune organ and because of its role in metabolism. 1 At first, muscles were thought to be involved only in movement and regulation of energy metabolism; however, in the last decade, new evidence has suggested that skeletal muscle acts as an endocrine organ because it expresses and produces several cytokines and peptides in response to muscle contractions. 2,3
Currently, there is sufficient evidence of the association between MS and the reduction of the risk of mortality from all causes. For decades, good levels of MS have been associated with a preventive effect against chronic and metabolic diseases, while low muscle performance is associated with metabolic syndrome, cancer and increased risk of mortality from all causes, both in men and women. 4-7 This association has been confirmed in the meta-analyzes of Volaklis et al.8 and Cooper et al.9, who observed an inverse correlation between MS and mortality, even after adjusting factors for some confounding variables such as physical activity levels and cardiorespiratory fitness, both in adult and younger populations.
Timpka et al.10 conducted a prospective study with 38 588 Swedish adolescents (16-19 years), and concluded that the risk of mortality from all causes decreased by 20% in participants with the best results in grip strength and leg extension, compared to those who obtained low MS results. Other studies 11-12 reported similar results and identified that subjects with moderate or high muscular capacity have a risk reduction of 35% and 44%, respectively, compared to those with low MS levels. However, up to date, few studies have evaluated the association between muscle strength and metabolic syndrome. 13
The studies by Jurca et al.14 and Aoyama et al.15 reported an inverse correlation between MS and metabolic risk (β=-0.37; p<0.0001), which was marginally non-significant after further adjustment with aerobic fitness.
For this review, several search strategies were used including searches in specialized journals, in the Cochrane Central Register of Controlled Trials, and in the MEDLINE, PubMed, ProQuest, Hinari, SPORTDiscus, Embase, CINAHL, PsycINFO, PEDro and Ovid databases. After gathering all the data, it was observed that, until now, few studies have evaluated the association between MS and metabolic syndrome, and the results are contradictory. These observations were confirmed by Wijndaele et al.13 and a recent meta-analysis conducted by Volaklis et al.8
In the Colombian context, several studies have addressed this issue. Ramírez-Vélez et al.16, in a cohort study conducted with 6 095 adults aged between 18 and 40 years, observed that the group of participants with low and moderate levels of MS/body mass (BM) presented higher values in the cardiometabolic risk score index, regardless of their body mass index (BMI) (p<0.001). On the other hand, the group with high MS/BM values had higher levels of cardiometabolic protection.
On the other hand, García-Hermoso et al.17 demonstrated that adults with good MS levels and low fat have significantly lower levels of metabolic risk compared to those with low MS levels. Ramírez-Vélez et al.18 studied the association between MS and cardiovascular health in 1 199 children and young people and observed that high levels of MS (absolute or relative) are significantly (p<0.001) associated with better cardiovascular health.
The purpose of this study was to identify the correlation between the different manifestations of MS and the plasma concentrations of cholesterol, triglycerides, HDL-C and LDL-C in a group of young adults. This approach has been little studied, since most research works focus on the correlation between aerobic capacity and metabolic risk biomarkers, whose results are contrary to those related with MS, as concluded by Jurca et al.14, who report that MS and cardiorespiratory fitness are independently and inversely related to metabolic syndrome.
Materials and methods
Design and population
This is an observational, descriptive and correlational cross-sectional study that was carried out in the Exercise Physiology Laboratory of Universidad Pedagógica Nacional in 2016. The group of participants consisted of 50 university students (37 men and 13 women) aged between 19 and 25 years, who participated voluntarily in the study. Inclusion criteria were: being a university student, men and women with low levels of physical activity and capable of performing physical exercise; exclusion criteria were: suffering from any type of pathology, being habitual smokers or drinkers, and having participated or being involved in structured programs of physical exercise or training in the last year.
This study was designed following the deontological norms recognized by the Declaration of Helsinki 19 and the Resolution 8430 of 1993 of the Ministry of Health of Colombia 20, which regulate clinical research in humans. The Research Ethics Committee of the Universidad Pedagógica Nacional (VGU-400, March 28, 2017) approved the study. In addition, all participants were informed of the details of the study and signed the informed consent.
Body composition
Anthropometric measurements were total BM, evaluated using an electronic scale (Healht Metter 599 KL with 0.50g precision); height, measured with a height rod (Detecto D52, USA); and BMI, estimated using the formula BMI=weight (kg)/size (m)2.
Maximum strength
Days before the assessments, the procedure of each MS and peak anaerobic power test was carefully explained to the subjects. Six minutes of specific warming-up of the involved muscle groups was performed before the evaluations.
The maximum muscular strength of the upper limbs was evaluated using the bench press test on a Smith machine by directly determining the one-repetition maximum (1RM). The test began with a load of 40% of the body weight of each subject and the participants were asked to perform 4-6 repetitions 21; at the end, the OMNI-RES scale was applied. 22 According to the score assigned to the effort, progressive increases of 10% were made. Maximum strength was determined when the subjects were only able to perform one repetition-maximum with said load. There was a 3-minute recovery period between each series to avoid fatigue.
The maximum strength of the lower limbs was evaluated performing a half squat on a Smith machine, using the same upper limb protocol, but starting with a load of 60% of body weight.
Peak anaerobic power
Peak anaerobic power of upper limbs was assessed using the Wingate test on a Monark 871E bicycle (Monark exercice, Varberg Sweden). Height and distance between the subject and the pedals of the bicycle were adjusted in order to align the glenohumeral joint with the center of the pedals; then three warming-up rounds were performed at 40RPM with a load of 0.10% of body weight and a sprint was executed for 5 seconds at minutes 2, 3 and 4. After 3 minutes of recovery, the participants performed the test using a load of 4.5% of body weight for men and 3.5% for women. 23
Peak anaerobic power of the lower limbs was assessed by using the Wingate test on a Monark 834E bicycle (Monark exercice, Varberg Sweden). Previously, the participants warmed-up for 5 minutes at 40RPM, with a load of 0.30% of body weight and a sprint was executed for 5 seconds at minutes 2, 3 and 4. After 3 minutes of recovery, the participants performed the test using a load of 7.5% of body weight for men and 6.7% for women. Saddle height was adjusted to ensure that knee flexion was not greater than 5 degrees.
The Optojump Microgate® Germany was used to estimate flight times (precision of 1/1000 seconds) with two types of jumps: countermovement jump (CMJ) and squat jump (SJ). Two attempts of each type of jump were made at intervals of 6 minutes between both, selecting the best record for statistical analysis.
Isometric strength
Grip strength of both hands was assessed by dynamometry method, using a Takei Grip-A dynamometer T.K.K 5001 (Scientific Instruments Co. Ltd, Tokyo, Japan) with a measuring range of 0-100kg and precision of 0.5kg. Two attempts were made with each hand, with recovery periods of 3 minutes; the best result was recorded. Likewise, isometric leg strength was evaluated with a Takei Back-A dynamometer T.K.K 5002 (Scientific Instruments Co. Ltd., Tokyo, Japan) with a measuring range of 0-300kg and precision of 0.5kg, using the same procedure.
Metabolic biomarkers
The analysis of plasma concentrations of triglycerides, HDL and total cholesterol (TC) was carried out on an empty stomach, asking the subjects not to consume any food after 11:00 pm the night before taking the blood sample. Blood was extracted from the cephalic vein, placing the subjects in supine position. Triglycerides were analyzed using the lipase/glycerol kinase/glycerol phosphate oxidase enzymatic method. HDL-C cholesterol was analyzed using the polyanion/cholesterol esterase/homogeneous oxidase enzymatic method. Measurements were made on an Olympus AU5400 analyzer (Olympus Diagnostica, Hamburg, Germany).
Statistical analysis
The results were analyzed using the SPSS software (version 20.0, SPSS, Inc., Chicago, IL). For the anthropometric, clinical, biochemical and strength condition variables, mean, standard deviation and coefficient of variation were calculated for each study group. On the other hand, to determine the correlations between variables of MS and metabolic risk markers, bivariate correlations were calculated through the Pearson coefficient for the total number of participants in the sample. The normality of the variables was verified by Kolmogorov-Smirnov test, using a level of significance of 5%. A qualitative rating scale was used according to the magnitude of the correlation observed: weak for values >0.40; moderate, between 0.41 and 0.60; strong, between 0.61 and 0.80; and very strong, between 0.81 and 1.
Results
The population that participated in the study had an average age of 21.8±2.3 years and 74% were men. Table 1 shows the descriptive statistics of the general anthropometric, biochemical, strength and peak anaerobic power characteristics of the study population.
Table 1 Morphological, biochemical, strength and peak anaerobic power characteristics of the population evaluated.
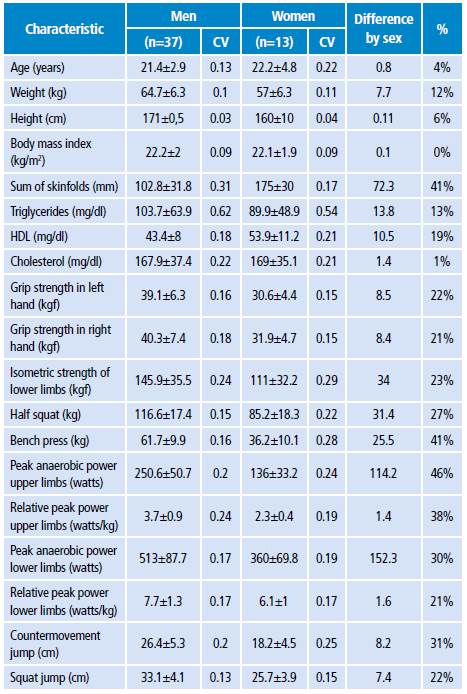
CV: covariance.
Source: Own elaboration.
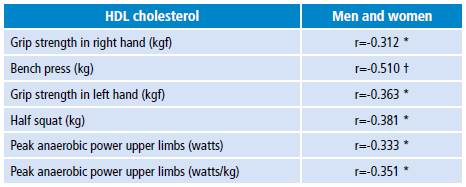
Table 2 presents the partial correlations between HDL-C values and strength and power indicators. HDL-C values have low and negative correlations with values p<0.01 and p<0.05 for muscle strength and power tests. No sex differences were identified in the distribution of total cholesterol. A higher proportion of women with HDL-C values >40 mg/dL and triglycerides >200 mg/dL were observed (p<0.05). No strong associations of HDL-C with the strength and power variables were found in the group of men or women.
Discussion
The present study provides elements to discuss the relationship between different manifestations of MS and plasma values of triglycerides, total cholesterol, LDL-C and HDL-C. Evidence on this regard is scarce and contradictory, and the results of certain studies are difficult to interpret due to some weaknesses and the inadequate control of factors that may influence lipid metabolism and statistical power. 24 This statement is confirmed in the review carried out by Durstine et al.25 and in the meta-analyzes of Kelley et al.26 and Zhang et al.27, who analyzed workout plans in different populations and found few interventions that used MS training as a physical activity strategy. Most studies used low intensity aerobic work.
Blood levels of HDL-C are 4-24 mg/dL, but they are higher in subjects who perform physically demanding work or perform resistance exercise on a regular basis, compared to less active people. The relative differences of HDL-C between these two groups range between 9% and 59%. 25,28 The same pattern is observed with TC and LDL-C. 26 However, this situation is not the same when MS is the physical activity performed.
Zhang et al.27 observed, in a population of young adults, a low to moderate negative correlation between the different manifestations of strength and HDL-C, as well as a lack of correlations with triglycerides, TC and LDL-C. These results agree with the results of this study and the reports of most of the previous works.
Jurca et al.14 identified a moderate inverse association between the prevalence of metabolic syndrome and MS (β=-0.37, p<0.0001), which decreases (β=-0.08, p <0.01) when it is adjusted with cardiorespiratory fitness. 29
Wijndaele et al.13 reported low inverse correlations in men and moderate correlations in women (p<0.05) between MS and triglycerides, cholesterol and HDL-C.
Artero et al.30 identified moderate inverse correlations between grip strength and triglycerides (p<0.01), and HDL-C and cholesterol (p<0.001).
Steene-Johannessen et al.31 conducted a study to identify the independence between MS and cardiorespiratory fitness for the risk of metabolic disease. The researchers evaluated standing long jump-explosive power, grip strength, abdominal strength and cardiorespiratory capacity directly using the peak oxygen uptake. The results indicate a negative association of MS and metabolic risk (β=-0.337, p<0.001), and a weak negative correlation of grip strength with triglycerides and positive with HDL-C.
Regarding the methodology, the most commonly used tests in previous studies for the assessment of maximum strength and peak power were hand dynamometry and long jump. For this study, dynamic strength tests were used based on the 1RM methodology, such as bench press or squats, and explosive tests such as the Wingate test, CMJ or SJ, which could make the results between the studies little comparable. For example, in this study, the best correlation of HDL-C was obtained with bench press and not with hand dynamometer, which had similar correlation values to power in upper limbs. This could indicate that the level of correlation between HDL-C and MS depends on the type of test used to assess the maximum strength.
Fernández et al.32, in a study on the correlation between the different manifestations of strength, observed that although the musculature of the upper or lower limbs is under evaluation, there is great variability in the correlation between the tests. This difference could be explained by the contribution of the muscle groups involved in the movements to each of the tests, which may not be the same. This would indicate that the information provided in each of the tests is specific to the muscle group and movement, and cannot be extrapolated to another muscle group or movement. This difference can also be attributed to the neuromuscular implications of the different types of muscle actions involved in each test.
However, the reason why there are no positive correlations between high levels of strength and plasma levels of HDL-C, as is the case of cardiorespiratory capacity, remains unresolved. In this regard, Prabhakaran et al.24 carried out an MS training for 14 weeks, with two sets of eight repetitions and bench press, leg extension and rowing workouts performed at 85% of 1RM. The results of the program led to significant reductions of cholesterol by 9% (p<0.05) and LDL-C by 14.3% (p<0.05) in the TC/HDL ratio. Triglycerides and HDL-C did not report significant changes.
Likewise, Kokkinos et al.33 carried out a strength-training program in 37 subjects with three types of exercises. The results indicated that none of the proposed workout plans generated significant changes in plasma concentrations of triglycerides, total cholesterol, HDL-C and HDL2-C. Later, the same authors carried out another study with trained subjects performing strength work at 70% of 1RM and did not observe significant changes in plasma concentrations of triglycerides, TC, HDL-C or LDL-C. 34
In the study by Manning et al.35, 16 sedentary obese women trained 3 times a week for 12 weeks performing three sets of 6-8 repetitions at 60-70% of 1RM. No significant changes were observed in body weight, BMI or CT, HDL-C, LDL-C, TG, TC/HDL-c, apo AI or apo B-100 levels. 35
Goldberg et al.36 developed a free-weight workout plan for 16 weeks in a group of sedentary young men and women. Women presented a 9.5% reduction in cholesterol, 17.9% in LDL-C and 28.3% in triglycerides. The total cholesterol/HDL-C and LDL/HDL rates were reduced by 14.3% and 20.3%, respectively. In men, the LDL-C cholesterol was reduced by 16.2%, while the total cholesterol/HDL and LDL/HDL levels were reduced by 21.6% and 28.9%, respectively.
Only one study 37 that observed an increase in HDL-C and a decrease in TC and LDL-C in a similar way was identified; this study was conducted through strength training and resistance training. There, the results would indicate that, although participants presented significant gains in MS, strength training did not alter the plasma levels of TC, HDL-C, LDL-C, triglycerides, nor the TC/HDL-C ratio, as is the case of aerobic training programs. One possible explanation is the specificity of the adaptive response to physical activity, which, according to the level and type of stimulation, generates changes in hormonal profiles and inflammatory and immune parameters, as well as intrinsic changes in skeletal and cardiac muscles.
Although the mechanisms underlying the effect of physical activity on the lipid profile are not clear, one hypotheses raised several decades ago about the cause of the increase in plasma HDL-C due to the effects of aerobic exercise is related to the metabolic adaptations that the muscle undergoes due to an increase in enzymatic activity, which leads to an increase in the capacity to oxidize fatty acids in comparison with glycogen. This better use of plasma triglycerides occurs because of the increase in the lipoprotein lipase (LPL) activity that is located in the lumen of blood capillaries and hydrolyzes triglycerides, allowing the uptake of free fatty acids (FFA) and the increase in muscle angiogenesis. 38
One of the possible mechanisms involved in HDL-C modulation is reverse cholesterol transport, which removes cholesterol from the circulation and distributes it to peripheral tissues and the liver. Two important events occur during aerobic exercise: 1) the increase of lecitin-cholesterol acyltransferase (LCAT), an enzyme responsible for ester transfer to HDL cholesterol, and 2) the reduction of cholesterol ester transfer protein (CETP), the enzyme responsible for the transfer of HDL cholesterol to the other lipoproteins. 39,40 This increases the activity of lipoprotein lipase, although data on this issue are inconsistent. 41 All this increase in the degradation of lipoproteins rich in triglycerides, by means of apoproteins transfer could lead to an increase in the plasma concentration of HDL-C.
In physiological terms, aerobic physical activity performed for a long period creates resistance and keeps the cardiac pump elevated at a constant rate, which can boost cardiac function and increase HDL. 28
This series of biochemical and physiological mechanisms is not activated in the same way during strength workout. Each type of workout poses a challenge for the organism's control systems to generate an adequate adaptive response. In this sense, and from a functional and metabolic point of view, muscle cells are not a homogeneous tissue and the cell signaling mechanisms and endocrine responses for the two types of workouts are different. Fatty acids are oxidized mostly in type I oxidative fibers that are primarily activated during low to moderate intensity physical activity. On the contrary, strength workout with moderate or high loads increases the activation of glycolytic fibers, therefore decreasing the participation of oxidative fibers. Similarly, cardiovascular function during SM workout is intermittent, since a high heart rate pump is not maintained at a constant rate, but for short periods (2-3 seconds) followed by recovery.
These statements are supported by the work of Aellen et al.42, who studied the effects of anaerobic and aerobic training performed 4 times a week for 9 weeks on lipoprotein concentrations in a group of 62 healthy untrained men. 33 subjects performed physical activity at low intensity, 16 at an intensity above the anaerobic threshold (blood lactate concentration >4 mmol) and 12 served as controls. The caloric expenditure calculated from both training groups was similar; TC, HDL-C, the subtractions of HDL-C (HDL2-c, HDL3-c) and LDL-C were evaluated in the three groups. With anaerobic training, these variables turned to the opposite direction compared to aerobic training, which influenced the lipoprotein profile in the desired direction. The authors concluded that training above the anaerobic threshold has no effect on the blood lipoprotein profile and that changes are achieved with moderate training intensities. The study by Said et al.43 obtained the same results. However, Lira et al.44, in their study on acute response to different percentages of 1RM, observed that the concentration of HDL-C was significantly higher after training at 50% -1RM and at 75% -1RM compared to 110%.
Conclusions
This research identified a moderate to low inverse correlation between HDL-C and the different manifestations of MS. However, these results are preliminary and should be observed with caution due to several study limitations that may have generated a bias. Therefore, it is suggested to carry out studies with a larger sample size, but with the same participation of men and women to verify if similar responses are presented between them.
Along the same lines, a nutritional analysis should be included to quantify the energy expenditure of each subject, as well as the quantification of the level of physical activity and the determination of the ethnic group of each participant. With regard to women, it is important to know whether they are menstruating during the collection of the samples and which phase they are in due to the effect it has on the fluctuations of the lipid profile.
Due to the lack of evidence and the contradictory results of different works carried out on the subject, this study contributes to the consolidation of the evidence of the relationship between MS and metabolic risk markers and also indicates the need to establish this relationship from broader valuations of MS.

