


 English (pdf)
 Article in xml format
 Article references
 Send this article by e-mail
 Cited by SciELO
  Cited by Google
  Similars in
SciELO
Similars in
SciELO  Similars in Google
 Permalink
Introduction
Scientific evidence suggests that health status and quality of life in students are directly related to their physical fitness (PF).1 PF is understood as a set of capacities and functions that allows people to perform physical and sport-based exercises and physical activities with vigour2 and efficiency3 in their daily life.
Recent studies suggest an association between having low PF levels in life stages such as childhood and adolescence and having a higher risk of developing physiological events (abnormal levels in parameters such as systolic blood pressure, lipoprotein cholesterol and plasma glucose; insulin resistance; deterioration of bone tissue; among others) and psychosocial disorders (stress, psychological distress, among others) in adulthood. 4,5 Given its importance for health, normative values have been established to analyze the evolution of the PF status in young people, finding that the optimal level has not been reached in some places of Europe, 6,7 Oceania 8, Asia9, Africa10 and America. 11,12
Epidemiological studies have reported a progressive increase in PF levels as age increases. 11,13,14 In this context, men have shown better values in different components such as cardiovascular, musculoskeletal and motor capacity, 15 while women have better scores in morphological indicators such as anterior trunk flexibility. (8
Another morphological indicator considered when analyzing PF is body composition. 16,17 A body mass index (BMI) indicative of overweight or obesity may favor the onset of concomitant cardiovascular and metabolic diseases and psychosocial disorders. 4,6,18 Moreover, body composition associates weight with height19 and, although it does not distinguish whether overweight is caused by fat or lean mass, it is a valid indicator of body mass index, 20 which has been established in the scientific literature as the most accurate anthropometric predictor of PF status. 21
Other valid and reliable anthropometric indicators are waist circumference (WC) and waist-to-hip ratio (WHR), which have been classified into percentiles in order to estimate metabolic risk, 22 total body fat and intra-abdominal and central fat in young individuals. 23 In this regard, Mazicioglu et al.24 state that WHR values >0.85 in women and >0.94 in men are closely related to the development of high blood pressure in the future.
The relationship between the anthropometric indicators described and the risk of suffering from overweight or obesity is well established and has been well analyzed around the world. 6 This relationship includes both genetic25 and lifestyle factors, including a deficit of physical activity (PA) and PF. 3
According to the scientific literature, regular and adequate physical activity is one of the best (complementary) strategies to combat increasing rates of overweight and obesity in children and adolescents. 3,26 Therefore, physical exercise is understood as the practice of PA in a structured, planned, and systematic way with the objective of improving one or more components of PF. 25
Although much of the variability of PF is determined by genes, environmental constraints, especially PA, can influence it, 25 perhaps in a two-way relationship. 3 However, whether this relationship is consistent has been questioned, considering that PA performance among young people is characterized by being unpredictable, unsystematic and of short duration and, consequently, may not change the status of PF, especially at the cardiovascular level. 27
In summary, in young individuals, it has been described that being younger, 13,28 female, 17,29 overweight, 30-33 and having a PA deficit is associated with a worse PF status. 15,34 However, some studies suggest that, regardless of age and sex, a person can be overweight and have a healthy PF status if there is an optimal PA level, confirming the phenotype known as fat but fit. Said concept refers to overweight or obese people who have acceptable PF levels and who may have better health conditions than those who have the same level of overweight but worse PF status. 35-37 Based on this information, the objective of this work was to analyze the PF status of a sample of elementary students taking into account age, sex, BMI and PA level.
Materials and methods
Design and participants
Ex post facto descriptive and cross-sectional empirical study of 103 participants (63 females and 40 males) aged 8-12 years (9.94±1.40 years). A sample was obtained for convenience and the participants, who were enrolled in schools from the Region of Murcia (Spain), provided the informed consent signed by their parents or legal guardians. Schoolchildren with osteoarticular pathologies were excluded from the study.
Ethical considerations
This study followed the ethical principles established by the Declaration of Helsinki38 for human research. This article derives from a doctoral thesis developed at the Department of Plastic, Musical and Dynamic Expression of the Universidad de Murcia (Murcia, Spain), and was approved by the doctoral committee of the Faculty of Education of that university; this body verifies compliance with the corresponding ethical considerations during the conduct of the study.
Instruments
PF was measured using the ALPHA-Fitness test battery, which was modified as follows: the skin folds were not measured and the 4x10m shuttle run test of the extended version was added. 2,16 The reliability and validity tests of this battery were verified with individuals from similar socio-cultural environments. 17
Body weight was measured with an electronic scale (model 220, SECA, Hamburg-Germany) and height with a stadiometer (Holtain Ltd., Dyfed, UK). Based on these values, BMI was calculated using the formula: weight (kg)/height (m2). Considering the specific international standards for age and sex, schoolchildren were classified according to their BMI into normal weight (<25 kg/m2) and overweight-obesity (≥25 kg/m2). 19
Waist circumference (WC) and hip circumference (HC) were measured using an anthropometric tape (Harpenden Anthropometric Tape, Holtain Ltd, Dyfed-UK) and WHR was estimated using the WC/HC ratio. Speed-agility was deduced through the 4x10m shuttle run test, 39 for which a professional stopwatch was used (HS-80TW-1EF, Casio, Tokyo, Japan). To calculate the maximal handgrip strength, a hand-held dynamometer test40 was performed using a digital dynamometer with adjustable grip (TKK 5041 Grip D, Takei, Tokyo, Japan), as well as a ruler to adapt the grip width. The explosive power of the lower body was established through a standing long jump test41 using a PVC fiberglass measuring tape (74-Y100M, CST/Berger, Chicago, USA).
Aerobic capacity was estimated by means of the 20m shuttle run test, using a portable audio device (Behringer EPA40, Thomann, Burgebrach, Germany) and a USB flash drive (Hayabusa, Toshiba, Tokyo, Japan).42 The record considered for the study was the last completed stage or half-stage.
In order to obtain the overall PF variable, known as zPF-ALPHA, maximal handgrip strength, explosive power of the lower body and aerobic capacity values were added, and the speed-agility value was subtracted. 17
PA was measured with the Physician-based Assessment and Counseling for Exercise (PACE) 43 instrument, which consists of 2 items that estimate the weekly PA performed by an individual for at least 60 minutes (PACE 1, how many times in the last week; PACE 2, how many days in a typical week). Internal consistency, reliability and validity were verified in individuals of similar ages by Rosa-Guillamón et al.3, and Cronbach's Alpha for the present study was 0.847.
Based on the results of the last questionnaire, and taking into account the criteria established by the Department of Health and Social Care of the United Kingdom, 44 the participants were classified into 2 groups according to their level of PA: physically inactive (X<5 hours) and physically active (X≥5 hours). 45 Likewise, a variable that combined BMI and PA level was created, which resulted in 4 groups: A: normal weight/physically inactive, B: normal weight/physically active, C: overweight-obesity/physically inactive, and D: overweight-obesity/physically active.
Procedure
This study was carried out during the 2016-2017 academic year, and the data were collected in October 2016. Before applying the tests, a warm-up based on joint mobility and dynamic stretching was performed for 8 minutes.
Only one trial was allowed for each test and the PACE questionnaire was administered in the presence of the interviewer, so that any doubts that could arise could be promptly solved.
Statistical analysis
Sex differences were analyzed using Mann-Whitney U-test for continuous variables and Pearson's chi-square test for categorical variables. The Mann-Whitney U test was also applied to study the relationship between weight status and PF. On the other hand, to analyze the combined association between PA and weight status with PF, the Kruskal-Wallis H test was applied using the SPSS program (v.23.0, Chicago, Illinois, USA), with a significance level of p<0.05.
Results
Table 1 shows that males had better physical performance in the 4x10m shuttle run test, hand-held dynamometry and 20m shuttle run test (p<0.05), as well as in the variable zPF-ALPHA (p<0.01). It also shows that there is a trend towards increasing PF levels as age increases in both sexes.
Table 1 Physical fitness by age and sex (males: 40 and females: 63).
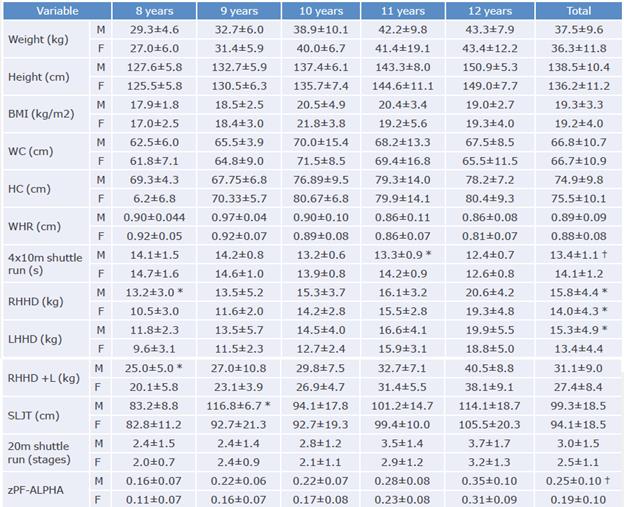
M: male; F: female; BMI: body mass index; WC: waist circumference; HC: hip circumference; WHR: waist-to-hip ratio; RHHD: right hand-held dynamometry; LHHD: left hand-held dynamometry; RHHD +L: right hand-held dynamometry + left; SLJT: standing long jump test; zPF-ALPHA: physical fitness-ALPHA.
* p< 0.05.
† p< 0.01.
Source: Own elaboration.
Schoolchildren with normal weight had lower WC, HC (p<0.01) and WHR (p<0.05) values, as well as better physical performance in the 20m shuttle run (p<0.001). Overweight-obese children had higher values in the right hand-held dynamometry (RHHD), left hand-held dynamometry (LHHD) and right + left hand-held dynamometry (RHHD+L) tests (p<0.05) (Table 2). Physically active schoolchildren had lower BMI, WC and HC (p<0.05) and better performance in the 20m shuttle run test (p<0.01) (Table 3).
Table 2 Relationship between body mass index and physical fitness.
| Variable | Normal weight (n=65) | Overweight-obesity (n=38) | Z |
| WC (cm) | 61.4±6.7 | 75.9±10.3 | -6.802 * |
| HC (cm) | 74.9±9.8 | 75.5±10.1 | -6.665 * |
| WHR (cm) | 0.89±0.09 | 0.88±0.08 | -2.379 t |
| 4x10m shuttle run (s) | 13.7±1.2 | 14.0±1.3 | -1.319 |
| RHHD (kg) | 14.0±4.1 | 15.9±4.6 | -1.912 t |
| LHHD (kg) | 13.3±4.5 | 15.6±4.7 | -2.487 t |
| RHHD+L (kg) | 27.3±8.2 | 31.5±9.1 | -2.157 t |
| SLJT (cm) | 97.4±19.1 | 93.9±17.8 | -0.855 |
| 20m shuttle run (stages) | 3.0±1.4 | 2.1±0.9 | -3.888 * |
| zPF-ALPHA | 0.22±0.11 | 0.19±0.09 | -1.463 |
WC: waist circumference; HC: hip circumference; WHR: waist-to-hip ratio; RHHD: right hand-held dynamometry; LHHD: left hand-held dynamometry; RHHD +L: right hand-held dynamometry + left; SLJT: standing long jump test; zPF-ALPHA: physical fitness-ALPHA.
* p< 0.001.
†p< 0.05.
Source: Own elaboration.
Table 3 Relationship between physical activity and physical fitness.
| Variable | Physically inactive (n=74) | Physically active (n=29) | Z |
| Weight (kg) | 37.9±11.8 | 34.0±8.1 | -1.368 |
| Height (cm) | 137.5±11.2 | 136.2±10.1 | -0.205 |
| BMI (kg/m2) | 19.7±3.9 | 18.1±3.0 | -1.928 * |
| WC (cm) | 68.1±11.0 | 63.2±9.4 | -2.007 * |
| HC (cm) | 76.6±10.5 | 71.8±7.8 | -2.107 * |
| WHR (cm) | 0.89±0.08 | 0.88±0.09 | -0.466 |
| 4x10m shuttle run (s) | 13.9±1.1 | 13.7±1.5 | -1.005 |
| RHHD (kg) | 14.9±4.4 | 14.2±4.5 | -0.646 |
| LHHD (kg) | 14.3±4.6 | 13.6±5.1 | -0.660 |
| RHHD +L (kg) | 29.3±8.6 | 27.8±9.2 | -0.623 |
| SLJT (cm) | 94.5±17.0 | 100.2±22.1 | -1.394 |
| 20m shuttle run (stages) | 2.4±1.2 | 3.3±1.4 | -3.018 t |
| zPF-ALPHA | 0.20±0.09 | 0.24±0.13 | -1.628 |
WC: waist circumference; HC: hip circumference; WHR: waist-to-hip ratio; RHHD: right hand-held dynamometry; LHHD: left hand-held dynamometry; RHHD +L: right hand-held dynamometry + left; SLJT: standing long jump test; zPF-ALPHA: physical fitness-ALPHA.
*p<0.05.
†p<0.01.
Source: Own elaboration.
Physically active students with normal weight had higher zPF-ALPHA values. These differences were only significant in the 20m shuttle run test (p<0.001), in which lower WC, HC, (p<0.01) and WHR (p<0.05) values were also obtained (Table 4).
Table 4 Combined relationship between body mass index and physical activity and physical fitness.
| Variable | A (n=34) | B (n = 31) | C (n = 22) | D (n = 16) | X2 |
| WC (cm) | 62.6±7.1 | 60.0±6.1 | 77.1±11.3 | 74.2±8.8 | 47.591 * |
| HC (cm) | 71.1±6.0 | 69.7±6.6 | 86.2±8.5 | 79.8±10.3 | 48.794 * |
| WHR (cm) | 0.88±0.08 | 0.86±0.08 | 0.89±0.09 | 0.93±0.07 | 8.443 t |
| 4x10m shuttle run (s) | 13.8±1.3 | 13.5±1.1 | 13.7±1.1 | 14.4±1.4 | 5.091 |
| RHHD (kg) | 14.3±4.1 | 13.7±4.1 | 16.8±5.4 | 14.6±3.1 | 4.998 |
| LHHD (kg) | 13.5±4.4 | 13.1±4.8 | 16.2±5.3 | 14.7±3.8 | 7.096 |
| RHHD +L (kg) | 27.8±8.1 | 26.8±8.4 | 33.0±10.4 | 29.3±6.6 | 5.555 |
| SLJT (cm) | 94.2±18.9 | 100.9±18.9 | 94.7±21.5 | 92.8±11.3 | 3.095 |
| 20m shuttle run (stages) | 2.9±1.3 | 3.2±1.4 | 2.1±0.9 | 2.0±0.9 | 15.883 * |
| zPF-ALPHA | 0.21±0.10 | 0.24±0.12 | 0.20±0.11 | 0.17±0.06 | 2.944 |
A: normal weight/physically inactive; B: normal weight/physically active; C: overweight-obesity/physically inactive; D: overweight-obesity/physically active; WC: waist circumference; HC: hip circumference; WHR: waist-to-hip ratio; RHHD: right hand-held dynamometry; LHHD: left hand-held dynamometry; RHHD +L: right hand-held dynamometry + left; SLJT: standing long jump test; zPF-ALPHA: physical fitness-ALPHA.
* p< 0.001.
† p< 0.05.
Source: Own elaboration.
Discussion
The results of this study demonstrate a positive relationship between PA and PF. In this sense, physically active people have healthier BMI, WC, HC and aerobic capacity values (Table 3).
BMI and PF were directly correlated; thus, children with normal weight had healthier WC, HC and aerobic capacity values, while overweight-obese children had higher RHHD, LHHD and RHHD+L values (Table 2). Physically active participants with normal weight presented better WC, HC, WHR and aerobic capacity values in the analysis of the combined relationship between BMI, PA and PF. On the other hand, physically active schoolchildren with overweight-obesity had lower WC and HC values than their physically inactive classmates; however, they also showed worse physical performance in PF tests, which did not prove the existence of the phenotype known as fat but fit (Table 4).
With respect to sex, males had better physical performance in the aerobic capacity, speed-agility and upper body strength tests (p<0.05), so they obtained higher zPF-ALPHA scores (p<0.01) compared to females (Table 1). This had already been reported in previous studies,16,17,26 with the exception of flexibility. 15,46
Golle et al.,14 in their 4-year longitudinal study, reported that girls up to age 10 achieve better scores in tests involving the upper limbs, flexibility and agility. This may indicate that sex-specific maturation processes can have a positive impact on PF in healthy schoolchildren. In this sense, genetics may reveal a part of muscular and cardiorespiratory endurance that is associated with greater capacity of skeletal muscle in relation to body weight in men due to the secretion of testosterone, and a lesser efficiency of neuromuscular coordination in women due to gynecoid fat redistribution.47 Likewise, girls under 12 years of age reach about 85-90% of VO2 max in terms of average absolute values compared to the boys of the same age group, which would explain these differences. 48
The PF index increased slightly in all components (morphological, motor, skeletal muscle and aerobic) as age increased in both sexes; this result was similar to some studies13,28 but contrary to others. 49 These differences in the results may be caused by growth (height, weight and body dimensions), absolute VO2 max values and the level of maturation (somatic, skeletal and sexual) of schoolchildren. 47,48
Regarding body composition, participants with overweight-obesity had better grip strength (p<0.05), while those with normal weight had lower WC, HC and WHR values (p<0.05) and healthier aerobic capacity (p<0.05). These better results in schoolchildren with overweight-obesity have been found in tests that require isometric force, as is the case of the hand-held dynamometry test and medicine ball overhead throws, perhaps due to a greater amount of lean mass that allows supporting this additional load and to the fact that fat mass favors inertia in the propulsion of the device and joint stabilization when gripping the dynamometer. 18 BMI, aerobic capacity, adiposity and VO2 max are independent entities, except in tests where submaximal aerobic capacity is used. 31
In terms of PA performance, physically active schoolchildren had lower BMI, WC and HC (p<0.05) and higher aerobic capacity (p<0.05). The available evidence coincides with these results3,32,33; however, Ortega et al.6 state that even though there is a relationship between PA and PF in schoolchildren and young individuals, it is not consistent, and that it is, therefore, questionable what intensity, frequency and duration of PA should be taken into account to determine the effects on body composition and an improvement in PF, especially aerobic. 6 In this sense, the most recent literature review conducted by Rosa-Guillamón50 concludes that the primary objective of intervention programs should be teaching schoolchildren to adopt an active and responsible lifestyle when acquiring other health habits.
The improvement of PF can be based on the development of at least one of its main determinants, such as cardiorespiratory fitness, muscle strength or body composition. Thus, the current recommendations established by the US Healthy People 2010 initiative45 (≥60 minutes/day, >5 days/week of moderate PA or ≥20 continuous minutes, ≥3 days/week, > 6 metabolic equivalent of vigorous activity) appear to be adequate as long as adherence to PA is consolidated.
Finally, significant differences were found between WC, HC, WHR (p<0.05) and aerobic capacity (p<0.001) in favor of normal weight/physically active boys. This is consistent with Lopez-Gallego et al.,15 who concluded that the results are better based on the age increase of the evaluated participants and in favor of boys (except in flexibility tests). These authors also confirmed that people who perform more PA or some training obtain better results in jumping tests than physically inactive people; however, they do not carry out an analysis of PF based on sex, age and PA together, so direct comparisons cannot be made, 15 hence the novelty of this study. Other research6,29 indicates that schoolchildren who perform more PA have greater cardiorespiratory capacity.
A possible explanation for these results is that about 30-40% of the variance in PF measures could be attributed to factors other than changes in BMI and that more deficient nutrition and decreased PA lead to a lower training effect and PF level.51 For this reason, it is undeniable that PF has a close link to children's health and lifestyle. In this sense, schools and physical education teachers play an important role in identifying the level of PF and in promoting an active lifestyle, 2,16 since assessing the level of PF from an early age can contribute to obtaining reports on the health status of the school population in order to encourage the adoption of healthy lifestyles. 3,50
The lack of representativeness of the sample is one of the limitations of this study, as well as the fact that other parameters that could potentially influence PF, such as socioeconomic status, maturity stage or hormonal factors, were not included. On the other hand, one of the strengths was the administration of a battery of PF tests within the school environment, which allows teachers to know the motor needs of their students and, in this way, design educational programs aimed at developing motor skills, enjoying PA and generating adherence to it throughout their lives.
Conclusions
This study showed that schoolchildren who are active and have normal weight have a better PF and aerobic capacity and a lower BMI, WC and HC compared to their overweight and physically inactive peers; however, overweight-obese schoolchildren have higher grip strength values. In terms of sex, boys have better PF levels, but there is a slight increase in PF as age increases in both sexes.
Achieving optimal levels of PF throughout life requires adopting a healthy lifestyle from childhood, and the best strategy for achieving this is to promote the autonomous practice of PA among schoolchildren.

